

Abstract
Objective
To evaluate and compare staging systems for differentiated thyroid carcinoma and predicted outcome in an endemic goiter region with iodine substitution and to examine the risk profile of differentiated thyroid carcinoma and compare it against nongoiter regions.
Summary Background Data
Differentiated (papillary or follicular) thyroid carcinoma has a favorable prognostic outcome. In numerous studies prognostic factors have been identified and staging systems created, particularly in Anglo-American centers (nonendemic goiter regions), to evaluate individual prognostic outcome.
Methods
In a retrospective study, the authors assessed 440 patients with differentiated thyroid carcinoma (papillary, n = 293; follicular, n = 147) and a long-term follow-up of median 10.6 years to determine the predictive accuracy of nine staging systems applicable to the study population; the systems were compared by calculating the proportion of variation explained.
Results
With regard to cause-specific mortality, the difference between the respective stages and/or risk groups was highly significant for every staging system. By means of calculating the proportion of variation explained, MACIS scoring supplied the most reliable prognostic information for differentiated thyroid carcinoma (relative importance 16.93%). EORTC and UICC/AJCC systems had a relative importance of 16.34% and 13.96%, respectively, also a high level of accuracy; this implies that they are superior to the other six staging systems. If we separate papillary and follicular carcinoma, for the former the MACIS score with a relative importance of 15.05% is clearly superior to the other staging systems, whereas for the latter the EORTC score and the UICC/AJCC staging system, with relative importance of 17.04% and 16.58%, respectively, yield the best prognostic information.
Conclusions
By applying staging systems in an endemic goiter region with iodine substitution, the best prognostic information for papillary thyroid carcinoma has been achieved with the MACIS score, while for follicular thyroid carcinoma the EORTC score and the UICC/AJCC system have the best prognostic accuracy. Because of the individual factors, which are easy to obtain and generally available (age, T, N, M classification), the uncomplicated handling, and the widespread use and the good predictive accuracy, the UICC/AJCC classification is the staging system of choice for comparing published results.
Follicular cell-derived thyroid carcinoma is the most common endocrine malignancy, representing almost 2% of all reported human cancers. 1 The prognostic outcome is favorable. In many studies predictive factors have been compiled, and particularly in Anglo-American centers (nonendemic goiter regions) staging systems for individual prognostic data have been defined 2–15 for different therapeutic strategies. Nevertheless, none of the existing systems is adequate in predicting outcome. We sought to evaluate and compare the various staging systems in terms of their predictive accuracy in an endemic goiter region where table salt is enriched with iodine. In Austria iodine substitution was started in 1923, but it was banned by the German Reichsgesetzgebung (Law) in 1938. In 1963 the addition of 10 mg potassium iodide/kg table salt was reintroduced. This dose was doubled in 1990 to 20 mg potassium iodide/kg table salt. 16 In supplying iodized salt for goiter prevention, the daily urinary iodine excretion was increased to a median of 140 mg iodine/g creatinine, and thus normalization was achieved. 16,17 The incidence of anaplastic thyroid carcinomas decreased; however, both the relative and absolute numbers of differentiated thyroid carcinomas rose. 18,19
We sought to answer the following questions: Is it possible to apply the staging systems published in the literature in endemic goiter regions? Which staging system best describes the prognostic differences between the stages and/or risk groups? Which staging system is suitable for comparison? Are there differences in the risk profile between endemic goiter regions with iodine substitution and nonendemic goiter regions?
METHODS
Patients
Based on a computer-assisted search of the literature (Medline), all available staging systems for differentiated thyroid carcinoma (DTC) were identified. 2–15 They were applied to 440 patients with DTC who received primary treatment at the Department of Surgery, Division of General Surgery, Section of Endocrine Surgery, University of Vienna, from 1965 to 1995. Three hundred sixty-one patients (82%) were treated with total or near-total thyroidectomy (320 and 41 patients respectively) followed by radioiodine ablation therapy. Seventy-nine patients underwent a less-than-near-total thyroidectomy (bilateral subtotal resection in 67, palliative resection in 12). Two hundred ninety-three patients (66.6%) had papillary thyroid carcinoma (PTC) and 147 (33.4%) had follicular thyroid carcinoma (FTC). Eleven patients with PTC showed a tall-cell variant and two patients showed a columnar cell variant. Thirty-nine of the FTC patients showed a Hurthle cell carcinoma. These 52 patients were classified as having poorly differentiated disease. The gender ratio was 3:1 in favor of women (331 women, 109 men). The mean age at presentation was 52.3 ± 17.2 years (median 55 years, range 10–88). The median follow-up period was 10.6 years (mean 12.6 years ± 4.9 months).
Staging Systems
Staging systems with tumor grading as prognostic factors could not be used since such tumor grading has not been regularly carried out at our hospital. This applies to the AGES score of the Mayo Clinic, 4 the SAG system, 10 the NTCTCS system, 13 and the system applied at the University of Murcia, Spain. 14 DNA ploidy was also not examined, so the DAMES classification 7 was not suitable either. The following systems were analyzed and compared: European Organization for Research on Treatment of Cancer (EORTC) System, 2 Union Internationale Contre le Cancer/American Joint Committee on Cancer (UICC/AJCC; TNM), 3 MACIS, 5 AMES, 6 Clinical Class, 8
Ohio University, 9 Memorial Sloan-Kettering (MSK), 11 University of Alabama at Birmingham/M.D. Anderson Cancer Center (UAB-MDACC), 12 and University of Münster. 15
Statistical Analysis
For each staging system, Kaplan-Meier survival curves with respect to cause-specific mortality were set up and the statistical significance of the difference between the stages and/or risk groups was computed by the log-rank test. The results were compared with the original article in the respective publication. Differences in distribution of the ordered levels of staging between our data and the original publication were calculated using the chi-square trend test. Comparison between the staging systems was effected by calculating the proportion of explained variation (PVE). 20
RESULTS
Staging Systems
EORTC System
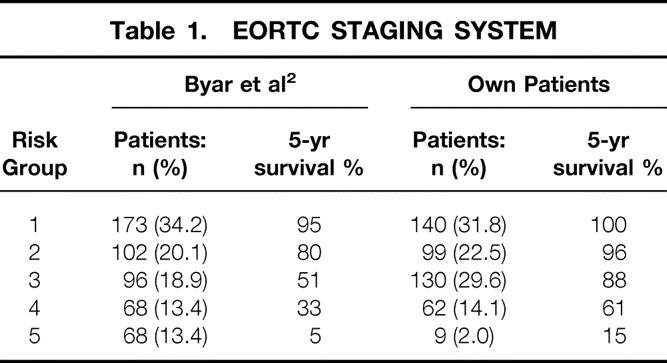
The EORTC system, developed in 1979, was the first staging system for thyroid carcinoma. 2 It is based on a multivariate analysis of 507 patients from 23 European hospitals with a median follow-up of 40 months and includes all thyroid carcinomas (in other words, also anaplastic and medullary cancer). Patients are divided into five risk groups on the basis of a prognostic scoring system; age, gender, histology, differentiation, tumor invasion, and distant metastases are the risk factors taken into account.
Allocation of our patients into the different risk groups and comparison with the original article by Byar et al. 2 is shown in Table 1. Five- and 10-year carcinoma-specific survival rates were 100% and 99.2% for group 1, 95.9% and 91.8% for group 2, 88.1% and 79.4% for group 3, 61.3% and 33.8% for group 4, and 15.0% and 15.0% for group 5. With regard to cause-specific mortality, the five groups showed significant differences (P = .0001).
Table 1. EORTC STAGING SYSTEM
UICC/AJCC (TNM) System
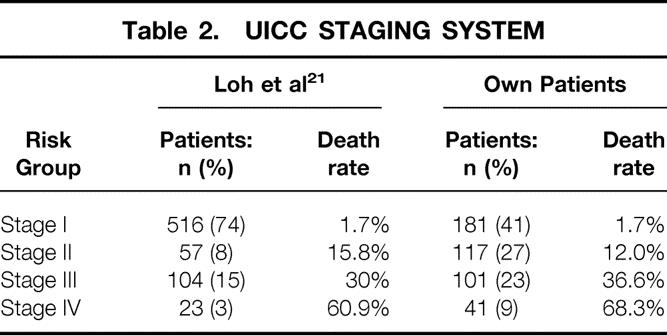
This system was introduced in 1987, updated in 1992, and complemented in 1997 (pN0 only if at least six lymph nodes are tumor-free). 3 Anaplastic and medullary carcinomas are taken into account but classified separately. Based on the TNM classification, patients are grouped into four stages, also considering age. Patients less than 45 years comprise stages I and II. For these young patients, only the presence or absence of distant metastases is decisive. No comparison of our data sets with those in the original publication was possible since no patient data were reported. For this reason, we used for comparison a North American study population of 700 DTC patients. 21
The breakdown into stages I to IV of the UICC/AJCC classification is shown in Table 2. Sixty-eight percent of all patients were in stages I and II, with the most favorable prognostic outcome. The relevant 5- and 10-year carcinoma-specific survival rates were 99.4% and 97.9% for stage I, 94.4% and 88.0% for stage II, 78.9% and 64.7% for stage III, and 50.6% and 31.9% for stage IV. With respect to cause-specific mortality, the difference between the stages was highly significant (P = .0001).
Table 2. UICC STAGING SYSTEM
MACIS System
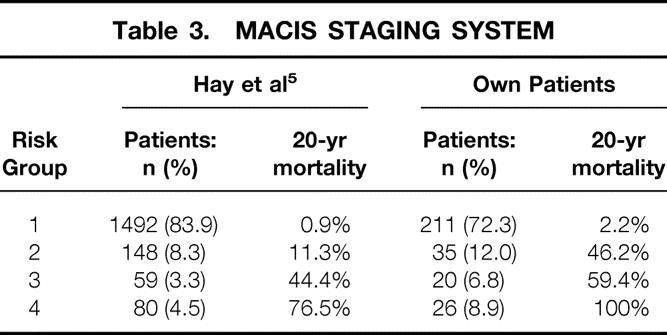
This system is an update (1993) of the AGES scoring introduced at the Mayo Clinic in 1987;4 MACIS is applicable only to PTC. 5 The following prognostic factors form the basis for this system: distant metastases (metastases), age, completeness of surgery, tumor invasion, and size. A scoring system allocates patients into four risk groups. The placement of our PTC patients into risk groups 1 to 4 is shown in Table 3. So that we could compare the different staging systems, the MACIS scoring was also applied to FTC patients and survival curves were calculated for DTC. Thus, we have a shift of distribution patterns toward groups with poorer prognosis. The scoring of the DTC patients showed 59.7%, 14.0%, 9.6%, and 16.7%, respectively, for groups 1 to 4. The relevant 5- and 10-year carcinoma-specific survival rates were 100% and 97.5% for group 1, 85.6% and 83.3% for group 2, 81.4% and 80.3% for group 3, and 55.5% and 30.2% for group 4. The statistical difference between the various risk groups was highly significant (P = .0001).
Table 3. MACIS STAGING SYSTEM
AMES System
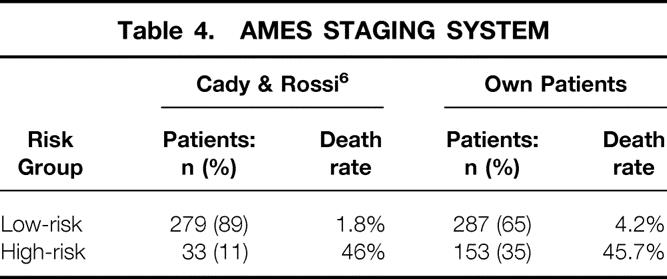
The AMES system was developed in 1988 at the Lahey Clinic with a cohort of 821 DTC patients 6 and is based on age, distant metastases, tumor extension, and size. The patients are subdivided into a low-risk and a high-risk group. Allocation of our patients in the two risk groups is shown in Table 4. Five- and 10-year carcinoma-specific survival rates were 98.6% and 96.5% in the low-risk group and 70.5% and 52.3% in the high-risk group. Once more, the statistical difference between the two risk groups (P = .0001) was highly significant.
Table 4. AMES STAGING SYSTEM
Clinical Class System
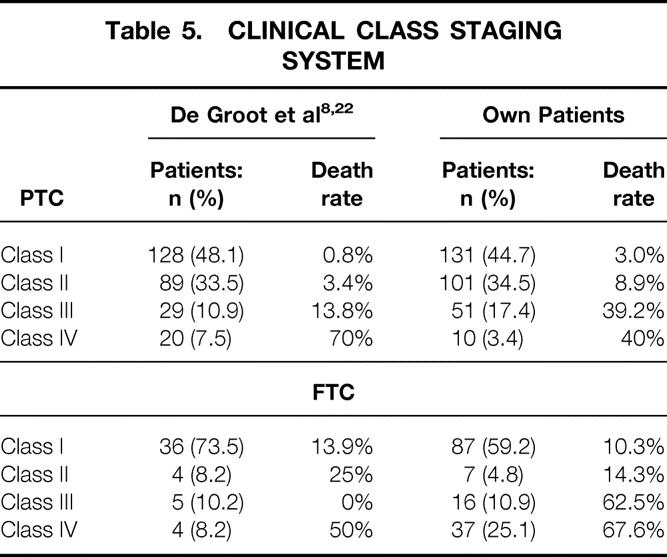
This system was compiled in 1990 at the University of Chicago 8 and subdivides 269 PTC patients into four risk categories based on the local (T, N classification) and the systemic extension (M classification) of the carcinoma. The applicability of this system to FTC was confirmed in 1995 with a cohort of 49 patients. 22 For comparison with the original articles, patients with PTC and FTC were studied separately (Table 5), but for comparing the different staging systems, FTC and PTC were classified together. Our DTC patients were allocated to class I to IV as follows: 49.5%, 24.5%, 15.2%, and 10.7%. The 5- and 10-year carcinoma-specific survival rates were 97.5% and 94.2% for class I, 95.0% and 92.6% for class II, 75.5% and 55.5% for class III, and 54.4% and 38.3% for class IV. The difference between the four classes was highly significant (P = .0001).
Table 5. CLINICAL CLASS STAGING SYSTEM
Ohio System
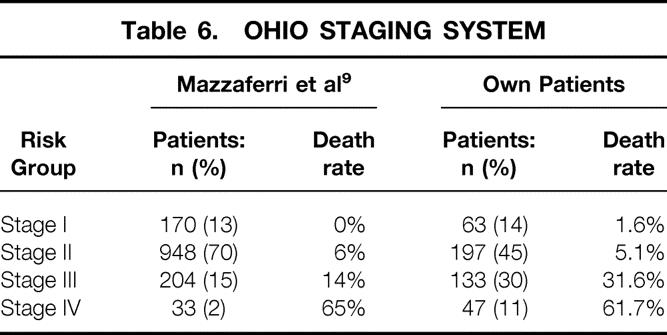
This staging system was developed in 1994 with a DTC patient population of 1,355. 9 Based on the criteria of tumor size, lymph node involvement, multifocality, local tumor invasion, and distant metastases, the patients were subdivided into four stages. The classification of our patients in the different stages is shown in Table 6. The respective 5- and 10-year carcinoma-specific survival rates were 100% and 96.9% for stage I, 97.9% and 96.5% for stage II, 82.0% and 67.3% for stage III, and 54.4% and 38.3% for stage IV. Differences in survival for the stages were highly significant (P = .0001).
Table 6. OHIO STAGING SYSTEM
Memorial Sloan-Kettering System
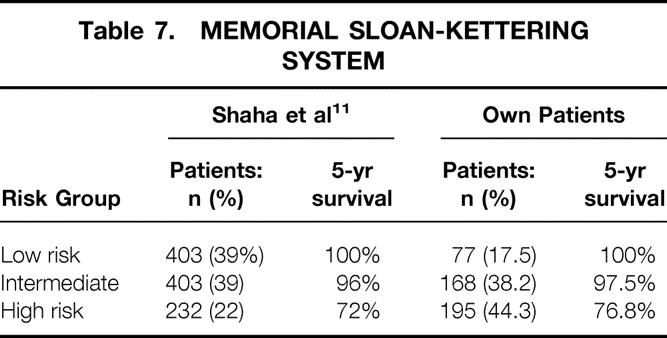
This system was published in 1994, reporting on 1,038 DTC patients. 11 Classification was based on patient age, tumor size, histology (type and differentiation), and distant metastases. The percentage of our patients in the low-risk group was surprisingly low (17.5%). Intermediate- and high-risk groups represented 38.2% and 44.3%, respectively (Table 7). The low-risk group had 5- and 10-year carcinoma-specific survival rates of 100%, compared to 97.5% and 94.9% in the intermediate-risk group and 76.8% and 61.6% in the high-risk group. Again there were highly significant differences between the three risk groups (P = .0001).
Table 7. MEMORIAL SLOAN-KETTERING SYSTEM
UAB-MDACC System
This system was developed at the University of Alabama in Birmingham and at the M.D. Anderson Cancer Center in Houston and includes low-risk, intermediate-risk, and high-risk groups. 12 Only two prognostic factors (patient age and distant metastases) are involved. In the low-risk group are patients below 50 years of age without distant metastases. In the intermediate group are patients above 50 years of age without distant metastases. The high-risk group incorporates patients of any age with distant metastases. Within the risk groups there is a further subdivision based on tumor size (<3 cm, 3 or more cm).
The low-risk, intermediate-risk, and high-risk groups represented 38.8%, 50.1%, and 11.1% of our patients, respectively. The low-risk group had 5- and 10-year carcinoma-specific survival rates of 99.4% and 96.3%, compared to 87.8% and 78.5% for the intermediate-risk group and 54.4% and 38.3% for the high-risk group. Differences in cause-specific survival were highly significant (P = .0001).
University of Münster System
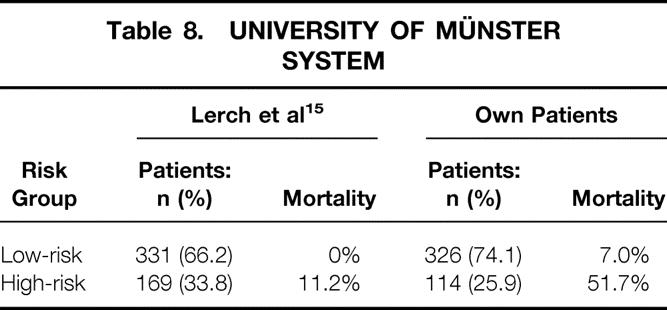
This system was developed in 1995, embodying a cohort of 500 DTC patients. 15 They were divided into low- and high-risk groups: patients with local tumor invasion (T4) and/or distant metastases would be in the high-risk group. Other risk factors are not taken into consideration. The low-risk group and high-risk group represented 73.6% of our patients and 26.4%, respectively (Table 8). The 5- and 10-year survival rates were 96.7% and 93.6%, respectively, for the low-risk group compared to 67.1% and 48.3% for the high-risk one. There were highly significant differences between the two risk groups (P = .0001).
Table 8. UNIVERSITY OF MÜNSTER SYSTEM
Evaluation of Staging Systems
With respect to carcinoma-specific mortality, all these staging systems showed a highly significant difference between the various stages and/or risk groups (P = .0001). Calculation of the PVE demonstrates that the MACIS system (relative importance 16.93%) had the best prognostic accuracy for DTC (PTC and FTC), followed by the EORTC score (16.34%) and the UICC/AJCC staging (13.96%).
Since the histologic type (follicular vs. papillary) is a highly significant risk factor, with distinct differences in cause-specific survival (P = .0001), the nine staging systems were also applied separately to PTC and FTC patients. For PTC, the MACIS score, with a relative importance of 15.06%, was greatly superior to all other staging systems. For FTC, the EORTC score and the UICC/AJCC staging, with a relative importance of 17.04% and 16.58%, yielded the best prognostic predictability. The relative importance of the various staging systems is shown in Table 9.
Table 9. PROPORTION OF VARIATION EXPLAINED (PVE) FOR ALL STAGING SYSTEMS
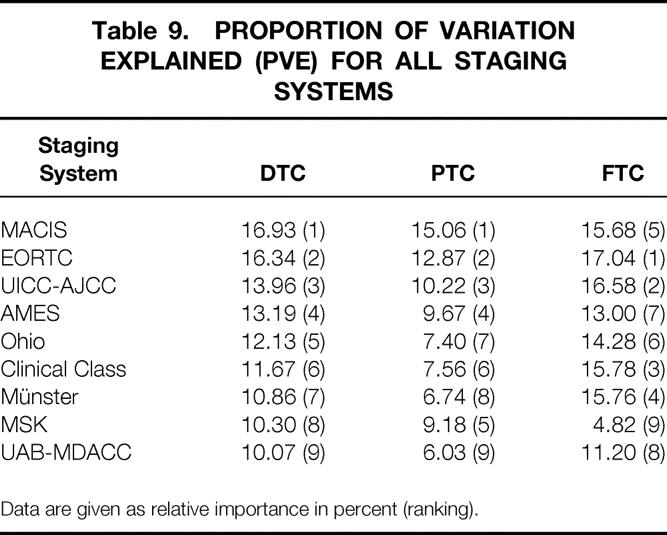
Data are given as relative importance in percent (ranking).
Comparison With Original Publications
The percentage of patients in the low-risk groups was significantly higher in our cohort compared to the other original publications from Europe (EORTC, P = .019; University of Münster, P = .009; see Tables 1 and 8). Comparison with the original reports from North America showed a significantly lower proportion of our patients in the low-risk groups for almost all analyzed staging systems (UICC/AJCC, MACIS, AMES, Ohio, MSK, UAB-MDACC;P = .001; see Tables 2–4, 6, and 7). An exception was seen in the distribution of PTC patients in the Clinical Class system, where no significant difference could be found between our population and the original publication by De Groot et al. 8 (P = .802; see Table 5). Nevertheless, the percentage of FTC patients in clinical classes with low risk was again significantly lower in our population compared to the original publication by De Groot et al. 22 (P = .018; see Table 5).
Differences in prognosis between our patients and original publications are shown in detail in Tables 1 to 8.
DISCUSSION
Most of the staging systems were developed by multivariate analysis of a specified patient population. Applying such a system to a different patient population may therefore diminish prognostic accuracy. 23 It was the objective of this study to test the staging systems published in the literature as to their suitability for an endemic goiter region with iodine substitution and to identify the optimal staging system to enable risk-oriented therapeutic strategy and comparison with published results.
Basically, we found that all these systems could be applied to our own cohort. The differences in cause-specific survival among the different stages and/or risk groups were highly significant (P = .0001). By calculating the PVE, the MACIS, EORTC, and UICC/AJCC systems (in this ranking) turned out to be best suited for our purpose. A similar comparison of different staging systems was done by Brierley et al. with a cohort in Canada. 24 They demonstrated that the prognostic accuracy of the UICC/AJCC system was equal to that of the AGES, EORTC, MACIS, and AMES systems and better than the Clinical Class, Ohio, and MSK systems. Because of the simple management, the UICC/AJCC system was recommended as the method of choice. De Groot et al. 25 compared EORTC, AGES, AMES, Clinical Class, and UICC/AJCC, identifying the latter as the best system for allocating patients into risk groups. Sherman 26 tested several staging systems (UICC/AJCC, EORTC, AMES, Ohio, Clinical Class, MACIS) involving a patient cohort in the United States and compared the systems with one that he developed within the National Thyroid Cancer Treatment Cooperative Study (NTCTCS). Sherman stated that his own and the UICC/AJCC system had the highest prognostic accuracy. However, the PVE values in Sherman’s cohort are much poorer than ours. Steinmüller et al. compared the UICC, AGES, AMES, and EORTC systems, using a European patient population, and found that the AGES and EORTC systems had the most accurate prognostic outcome. 27 The explanation for this was that no patient from the AGES low-risk group and no patient with FTC and an EORTC score less than 54 or PTC and an EORTC score less than 73 died of thyroid cancer.
If we consider PTC and FTC separately, there are some shifts in the prognostic scoring of the different staging systems. For PTC, the MACIS system, which was developed only for PTC, had the best prognostic outcome, followed by EORTC and UICC/AJCC. Even the AMES and the MSK systems were fairly well suited, whereas the remaining systems (Clinical Class, Ohio, University of Münster, and UAB-MDACC) had a low PVE value. Sherman also studied the applicability of many different staging systems for PTC and, similar to our results, found that NTCTSC (which we did not include in our studies), UICC/AJCC, EORTC, and MACIS had the best prognostic index for PTC, whereas AMES, Ohio, and the Clinical Class system were less suited. 26
However, EORTC and UICC/AJCC had the best prognostic accuracy for FTC. Interestingly enough, the Clinical Class system, originally designed for PTC 8 but also with a confirmed applicability in FTC, 22 the University of Münster system, and the MACIS score, although also developed for PTC only, had a high prognostic accuracy for FTC in our patient population. The other staging systems, when applied to our study population, yielded markedly lower PVE values.
Comparing the data in the original EORTC article 2 with our own cohort, we found that the percentage of our patient population in the poor prognostic groups was much lower, and the 5-year survival rate for all prognostic groups was by far better. This may be explained by the fact that we only included differentiated carcinomas, whereas Byar et al. also incorporated anaplastic and medullary carcinomas, implying that the ratio shifts toward the groups with poorer prognosis. The reason for our better survival results may be due to the different parameters of the analysis: mortality irrespective of the cause mentioned in the original article, carcinoma-specific mortality in our study.
We could observe that the proportion of patients in the low-risk groups is generally and significantly lower in our patient cohort compared to the original reports from the Anglo-American region. The reason for this may be the higher proportion of FTC patients (33% vs. 11–26%) and the higher age at presentation (mean 52.3 years vs. 35.7–43.1 years) in our population compared to the original reports. Apart from a few exceptions, 21 there could also be observed a trend toward a more favorable prognosis, especially for patients in the low-risk groups, in the original studies from North America. Statistical quantification of differences in prognosis was not done because of missing detailed patient data from the original publications.
Interestingly enough, this trend in the direction of a more positive outcome in the North American region could not be confirmed in a Canadian article. 24 This paper also analyzes a number of staging systems (EORTC, AGES, UICC-AJCC, AMES, MACIS, Clinical Class, Ohio, and MSK) where the patient distribution in the prognostic groups, apart from the EORTC score, is similar to ours, showing an even higher percentage in the groups with poor outcome. Nevertheless, the patients described by Brierley et al. 24 represent selected patients sent from all over Canada to have external beam irradiation and therefore likely represent patients considered to have a more guarded prognosis. They may therefore not be comparable to our patients and patients from other North American studies.
A re-evaluation of the AMES system at the Lahey Clinic with a larger patient population 28 confirms the higher incidence in the AMES low-risk group (78%) compared to our cohort. The 20-year survival rate in the low- and high-risk groups was 96% and 50%, and thus better than in our patient population (93% and 34%). In the study by Sanders and Cady 28 the percentage of FTC was as low as 20%.
A 1998 National Cancer Data Base Report 29 examined PTC and FTC separately and classified them in accordance with UICC/AJCC staging. Compared to our patient population, the number of classifiable PTC cases in stage 1 was higher (68.0% vs. 53.1%). The poorer prognosis of our PTC cases compared to the 5-year survival rates in stages I to IV (100% vs. 99.3% for stage I, 100% vs. 97.9 for stage II, 94% vs. 85.0% for stage III, and 48% vs. 44.4% for stage IV) was confirmed. In this study the FTC cases accounted for 13% of the DTCs. Half of the classifiable FTCs were in UICC/AJCC stage 1, whereas only 17.2% of our FTC cases were classified in stage 1 and 23.8% of our patients were classified as stage IV, compared to 8.8% in the North American study. Also, our 5-year survival rates for the FTC patients in stages II and III were definitely poorer, with 91% and 58.9% versus 99% and 82% in the North American patient population, whereas in stage I, with 100% compared to 99%, and in stage IV, with 53.2% compared to 47%, our patients interestingly showed a slightly better prognosis.
In Australia, 30 the separation into cohorts with better and poorer prognostication shows a similar outcome compared with the United States but a difference compared with our results. In the AMES and MSK classifications there were decidedly more patients in the groups with a better prognosis than in our patient population, whereas the distribution of PTC cases in the MACIS scoring system, as reported for the United States, was similar to our series. In Australia there were 27% FTC cases, less than in our study. Because of the limited number of patients and the short follow-up period, no data sets were published on cause-specific mortality.
Two papers published by the U.S. and German Thyroid Cancer Group 31–33 confirmed that the incidence of follicular (and also anaplastic) carcinomas is higher in regions with iodine deficit (Germany) than in North America, and that consequently the number of patients in the better prognostic groups is lower. A comparison of our data (endemic goiter region with iodine substitution) with those of Germany (region with iodine deficit) bears out that our figures (33% FTC cases compared to 29% in Germany 32) are even slightly higher. During the observation period, iodine substitution caused a marked drop in anaplastic carcinomas and a respective increase in DTC. However, among the differentiated carcinomas there was no decrease in FTCs, which make up about one third in the group of DTCs. Bacher-Stier et al. concurred with these observations in Western Austria, 19 yet they reported a minimal downtrend of follicular carcinomas caused by iodine substitution. Concerning patient distribution patterns in the UICC/AJCC staging system, both PTC and FTC, there were more patients in stages III and IV (PTC, 29.1% vs. 18.9%; FTC, 39.0% vs. 24.2%) in our patient population compared to Germany (iodine-deficient region). Unfortunately, the German study offered no data on cause-specific mortality. 32 In another publication from Germany, 15 proposing a new staging system (University of Münster), there were significantly more high-risk patients (33.8%) (MS system) than in our patient population (26.4%). The FTC incidence was higher (39.8%) than in our study. What is surprising is the striking difference in the cause-specific mortality (0% in the low-risk group and 11.2% in the high-risk group), compared to 7.0% and 50.4% in our patient population (see Table 8). Steinmüller et al. 27 reported on 139 DTC patients, applying four staging systems (EORTC, AMES, AGES, and UICC). The incidence of FTC (30.2%) was slightly lower than in our study. Whereas the allocation of PTC cases to the different prognostic groups in the above staging systems is similar to ours (AGES not used), our FTC cases were clearly shifted in the direction of groups with poorer prognosis. Five- and 10-year survival rates for PTC, with 94% and 88% versus 92% and 89%, are similar to ours, but for FTC they are definitely worse, with 78% and 66% versus 88% and 80%. This is probably due to the high rate of distant metastases in our FTC patient population (25.8%). In the German study, FTC patients had distant metastases in only 11.9%27 and 15.1%15 of the cases. Yet the data from another German institution (Heinrich Heine University, Düsseldorf) indicated a metastasis rate of 19%34 for FTC. There was no information about stage distribution or cause-specific mortality.
In conclusion, all staging systems analyzed here demonstrate a highly significant difference in carcinoma-specific survival between the respective stages and/or risk groups, so in principle they may all be used in an endemic goiter region with iodine substitution. The MACIS score is the system with the best predictive accuracy regarding cause-specific survival in patients with PTC and shows good results in patients with FTC. The EORTC score and the UICC/AJCC staging system (TNM) yield the best prognostic accuracy for FTC and are also very well suited for classifying patients with PTC into risk groups. For the UICC/AJCC system, the individual factors are simple to identify and generally available (age, T, N, M classification). Since the procedure is also easy to manage and widely used, we generally recommend the UICC-TNM staging classification as the system of choice for comparing published results. All analyzed staging systems allow risk stratification only after surgical therapy, so the aim of using a risk-oriented surgical strategy cannot be achieved. Reoperations and radioiodine ablation can eventually be avoided in the low-risk patients.
The percentage of patients in groups with good prognostic outcome was significantly lower in our iodine-substituted endemic goiter region than in North America. This might be due to the higher percentage of FTC and the higher age at presentation in our population. Additionally, a higher cause-specific mortality rate is seen in our population. Follicular cell-derived thyroid carcinoma in an endemic goiter region such as Austria seems more aggressive than in North America.
Footnotes
Correspondence: Bruno Niederle, MD, Department of Surgery, Division of General Surgery, University of Vienna Medical School, Währinger Gürtel 18-20, A-1090 Wien, Austria.
E-mail: bruno.niederle@akh-wien.ac.at
Accepted for publication May 13, 2002.
References
- 1.McIver B, Hay ID. Postoperative management of differentiated thyroid carcinoma. In Doherty GM, Skögseid B, eds. Surgical endocrinology. Philadelphia: Lippincott Williams & Wilkins; 2001: 87–108.
- 2.Byar DP, Green SB, Dor P, et al. A prognostic index for thyroid carcinoma: a study of the EORTC Thyroid Cancer Cooperative Group. Eur J Cancer 1979; 15: 1033–1041. [DOI] [PubMed] [Google Scholar]
- 3.Sobin LH, Wittekind C. UICC. TNM classification of malignant tumours, 5th ed. New York: Wiley-Liss; 1997.
- 4.Hay ID, Grant CS, Taylor WF, et al. Ipsilateral lobectomy versus bilateral lobar resection in papillary thyroid carcinoma: a retrospective analysis of surgical outcome using a novel prognostic scoring system. Surgery 1987; 102: 1088–1095. [PubMed] [Google Scholar]
- 5.Hay ID, Bergstralh EJ, Goellner JR, et al. Predicting outcome in papillary thyroid carcinoma: development of a reliable prognostic scoring system in a cohort of 1779 patients surgically treated at one institution during 1940 through 1989. Surgery 1993; 114: 1050–1058. [PubMed] [Google Scholar]
- 6.Cady B, Rossi R. An expanded view of risk-group definition in differentiated thyroid carcinoma. Surgery 1988; 104: 947–953. [PubMed] [Google Scholar]
- 7.Pasieka JL, Zedenius J, Auer G, et al. Addition of nuclear DNA content to the AMES risk-group classification for papillary thyroid cancer. Surgery 1992; 112: 1154–1160. [PubMed] [Google Scholar]
- 8.De Groot LJ, Kaplan EL, Mc Cormick M, et al. Natural history, treatment, and course of papillary thyroid carcinoma. J Clin Endocrinol Metab 1990; 71: 414–424. [DOI] [PubMed] [Google Scholar]
- 9.Mazzaferri EL, Jhiang SM. Long-term impact of initial surgical and medical therapy on papillary and follicular thyroid cancer. Am J Med 1994; 97: 418–428. [DOI] [PubMed] [Google Scholar]
- 10.Akslen LA. Prognostic importance of histologic grading in papillary thyroid carcinoma. Cancer 1993; 72: 2680–2685. [DOI] [PubMed] [Google Scholar]
- 11.Shaha AR, Loree TR, Shah JP. Intermediate-risk group for differentiated carcinoma of the thyroid. Surgery 1994; 116: 1036–1041. [PubMed] [Google Scholar]
- 12.Beenken S, Roye D, Weiss H, et al. Extent of surgery for intermediate-risk well-differentiated thyroid cancer. Am J Surg 2000; 179: 51–56. [DOI] [PubMed] [Google Scholar]
- 13.Sherman SI, Brierley JD, Sperling M, et al. Prospective multicenter study of treatment of thyroid carcinoma: initial analysis of staging and outcome. National Thyroid Cancer Treatment Cooperative Study Registry Group. Cancer 1998; 83: 1012–1021. [DOI] [PubMed] [Google Scholar]
- 14.Ortiz Sebastian S, Rodriguez Gonzalez M, Parilla Paricio P, et al. Papillary thyroid carcinoma. Prognostic index for survival including the histological variety. Arch Surg 2000; 135: 272–277. [DOI] [PubMed] [Google Scholar]
- 15.Lerch H, Schober O, Kuwert T, et al. Survival of differentiated thyroid carcinoma studied in 500 patients. J Clin Oncol 1997; 15: 2067–2075. [DOI] [PubMed] [Google Scholar]
- 16.Eber O. Zur Entwicklung der Jodsalzprophylaxe in Österreich [editorial]. Wien Klin Wochenschr 1998; 110: 733–737. [PubMed] [Google Scholar]
- 17.Galvan G. Iodine supply and struma in Austria. Acta Med Austriaca 1993; 20: 3–5. [PubMed] [Google Scholar]
- 18.Passler C, Scheuba C, Prager G, et al. Anaplastic (undifferentiated) thyroid carcinoma (ATC): a retrospective analysis. Langenbeck’s Arch Surg 1999; 384: 284–293. [DOI] [PubMed] [Google Scholar]
- 19.Bacher-Stier C, Riccabona G, Tötsch M, et al. Incidence and clinical characteristics of thyroid carcinoma after iodine prophylaxis in an endemic goiter country. Thyroid 1997; 7: 733–741. [DOI] [PubMed] [Google Scholar]
- 20.Schemper M, Stare J. Explained variation in survival analysis. Stat Med 1996; 15: 1999–2012. [DOI] [PubMed] [Google Scholar]
- 21.Loh KC, Greenspan FS, Gee L, et al. Pathological Tumor-Node-Metastasis (pTNM) staging for papillary and follicular thyroid carcinomas: a retrospective analysis of 700 patients. J Clin Endocrinol Metab 1997; 82: 3553–3562. [DOI] [PubMed] [Google Scholar]
- 22.DeGroot LJ, Kaplan EL, Shukla MS, et al. Morbidity and mortality in follicular thyroid cancer. J Clin Endocrinol Metab 1995; 80: 2946–2953. [DOI] [PubMed] [Google Scholar]
- 23.Hannequin P, Liehn JC, Delisle MJ. Multifactorial analysis of survival in thyroid cancer. Pitfalls of applying the results of published studies to another population. Cancer 1986; 98: 1749–1755. [DOI] [PubMed] [Google Scholar]
- 24.Brierley JD, Panzarella T, Tsang RW, et al. A comparison of different staging systems. Predictability of patient outcome. Thyroid carcinoma as an example. Cancer 1997; 79: 2414–2423. [PubMed] [Google Scholar]
- 25.DeGroot LJ, Kaplan EL, Straus FH, et al. Does the method of management of papillary thyroid carcinoma make a difference in outcome? World J Surg 1994; 18: 123–130. [DOI] [PubMed] [Google Scholar]
- 26.Sherman SI. Toward a standard clinicopathological staging approach for differentiated thyroid carcinoma. Semin Surg Oncol 1999; 16: 12–15. [DOI] [PubMed] [Google Scholar]
- 27.Steinmüller T, Klupp J, Rayes N, et al. Prognostic factors in patients with thyroid carcinoma. Eur J Surg 2000; 166: 29–33. [DOI] [PubMed] [Google Scholar]
- 28.Sanders LE, Cady B. Differentiated thyroid cancer. Reexamination of risk groups and outcome of treatment. Arch Surg 1998; 133: 419–425. [DOI] [PubMed] [Google Scholar]
- 29.Hundahl SA, Fleming ID, Fremgen AM, et al. A national cancer data base report on 53,856 cases of thyroid carcinoma treated in the U.S., 1985–1995. Cancer 1998; 83: 2638–2648. [DOI] [PubMed] [Google Scholar]
- 30.Chaplin JM, O’Brien CJ, McNeil EB, et al. Application of prognostic scoring systems in differentiated thyroid carcinoma. Aust NZ J Surg 1999; 69: 625–628. [DOI] [PubMed] [Google Scholar]
- 31.Cady B. Comparative analysis of thyroid carcinoma in Germany and the U.S. Cancer 2000; 89:1–4. [DOI] [PubMed]
- 32.Hölzer S, Reiners C, Mann K, et al. Patterns of care for patients with primary differentiated carcinoma of the thyroid gland treated in Germany during 1996. Cancer 2000; 89: 192–201. [DOI] [PubMed] [Google Scholar]
- 33.Hundahl SA, Cady B, Cunningham MP, et al. Initial results from a prospective cohort study of 5583 cases of thyroid carcinoma treated in the United States during 1996. Cancer 2000; 89: 202–217. [DOI] [PubMed] [Google Scholar]
- 34.Hellman P, Goretzki P, Witte J, et al. Follicular thyroid carcinoma. In: Doherty GM, Skögseid B, eds. Surgical endocrinology. Philadelphia: Lippincott Williams & Wilkins; 2001: 75–85.