Abstract
The initial rate of Fe2+ movement across the inner envelope membrane of pea (Pisum sativum) chloroplasts was directly measured by stopped-flow spectrofluorometry using membrane vesicles loaded with the Fe2+-sensitive fluorophore, Phen Green SK. The rate of Fe2+ transport was rapid, coming to equilibrium within 3s. The maximal rate and concentration dependence of Fe2+ transport in predominantly right-side-out vesicles were nearly equivalent to those measured in largely inside-out vesicles. Fe2+ transport was stimulated by an inwardly directed electrochemical proton gradient across right-side-out vesicles, an effect that was diminished by the addition of valinomycin in the presence of K+. Fe2+ transport was inhibited by Zn2+, in a competitive manner, as well as by Cu2+ and Mn2+. These results indicate that inward-directed Fe2+ transport across the chloroplast inner envelope occurs by a potential-stimulated uniport mechanism.
In plants, metal ions are taken up from the soil into the root and then distributed throughout the plant, crossing both cellular and organellar membranes. The low availability of free iron in the soil has led plants to develop mechanisms to compete for complexed iron through the processes of protonation, chelation, and reduction. Plants generally use one of two strategies to obtain iron from the soil solution. Strategy I plants, which include dicots and non-graminaceous monocots, utilize three steps for iron uptake involving acidification of the rhizosphere by an H+-ATPase, reduction of Fe3+ to Fe2+ by an NADH reductase, and uptake of iron by an iron transporter (Römheld and Marschner, 1986a). Strategy II plants release a phytosiderophore into the rhizosphere to bind iron followed by uptake of the chelated iron complex (Römheld and Marschner, 1986b). Once iron enters the plant, further transport throughout the plant via the xylem would likely occur as chelates of siderophores or of citrate, Gly, or Cys.
Once iron reaches the leaf, presumably it has to be absorbed by the leaf cells, possibly by a mechanism similar to strategy I (Brüggeman et al., 1993). 59Fe(III)-3-epihydroxymugineic acid only accumulated in the interveinal regions of illuminated barley (Hordeum vulgare) leaves (Bughio et al., 1997). Iron absorption by isolated illuminated chloroplasts was much higher than those kept in darkness. More than 90% of iron in leaf cells is located in chloroplasts (Terry and Abadia, 1986), with 75% to 80% of the iron in the chloroplast stroma and the remainder associated with the thylakoid membranes (Bughio et al., 1997). The absorption of iron by illuminated chloroplasts was inhibited by 3-(3,4-dichlorophenyl)-1,1-dimethylurea, suggesting that iron absorption depends upon electron transport in thylakoids or the ATP generated by these membranes (Bughio et al., 1997).
The iron acquisition mechanism of chloroplasts is not known. The activity of an H+-ATPase has been measured in isolated pea (Pisum sativum) chloroplast inner envelopes (Berkowitz and Peters, 1993; Shingles and McCarty, 1994; Peters and Berkowitz, 1998), but has not been directly linked to metal transport. However, the proton gradient formed by the activity of an envelope H+-ATPase was sufficient to couple this ATPase to a potential-stimulated Ca2+ uniporter (Roh et al., 1998).
The transport of iron across membranes may be facilitated by metal transporters, which have recently been discovered in plants (Eide et al., 1996; Grotz et al., 1998) and also have homologs in fungi and animals (Grotz et al., 1998; Guerinot, 2000). The first identified member of this family, IRT1 (iron regulated transporter), was expressed in roots of Arabidopsis plants and induced by iron deficiency (Eide et al., 1996). This protein subsequently was shown to transport Mn2+ and Zn2+ in addition to Fe2+ and is now classified within the ZIP (ZRT, IRT-like protein) family of divalent metal transporters (Guerinot, 2000). Two members of this family have N-terminal amino acid sequences, which suggest they are targeted to the chloroplast; and their topology predicts that they are integral membrane proteins (Grotz et al., 1998).
Isolated membrane vesicles are useful in membrane transport studies (Sze, 1985). Several different membrane impermeable fluorescent indicators have been loaded into chloroplast inner envelope vesicles as a way to measure ion fluxes across this membrane (Shingles and McCarty, 1994; Shingles et al., 1996; Roh et al., 1998). Combined with stopped-flow spectrofluorometry, the kinetics of rapid ion transport can be easily followed on a millisecond time scale. Initial rates of transport can then be measured and calibrated for ion transport across the chloroplast inner envelope membrane. A method based upon digital fluorescence microscopy to determine the levels of chelatable (free) iron in intact cells has been described recently (Petrat et al., 1999, 2000). These assays are based upon the use of Phen Green SK (PGSK), a fluorophore that is selectively sensitive to Fe2+ over Fe3+ (Petrat et al., 1999). In this study, we have loaded PGSK into isolated chloroplast inner envelope vesicles and utilized stopped-flow spectrofluorometry to measure ferrous iron transport rates across these membranes.
RESULTS
Phen Green Assay for Ferrous Iron
PGSK was first used as a fluorescent probe to measure free iron levels in hepatocyte and human erythroleukemia K562 cells that had been preloaded with the fluorophore (Petrat et al., 1999, 2000). We showed that PGSK entrapped in isolated vesicles might be used to measure the transport of ferrous iron across membranes (Shingles et al., 2001). Iron binding quenches PGSK fluorescence.
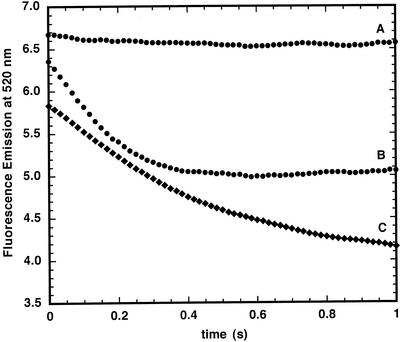
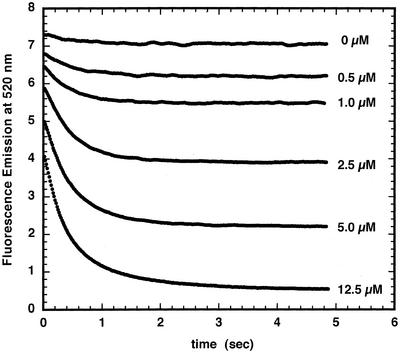
The transport of Fe2+ into asolectin membrane vesicles, which have no intrinsic iron transporters, was compared with that of chloroplast inner envelopes. In both cases, the vesicles were loaded with PGSK. In asolectin vesicles, the addition of 5 μm Fe2+ had little effect on PGSK fluorescence (Fig. 1A). Asolectin vesicles pre-incubated with 20 μm pyrithione, a metal ionophore (Jasim and Tjalve, 1986; Kim et al., 1999), showed a rapid decrease in PGSK fluorescence when 5 μm Fe2+ was added (Fig. 1B). When Fe2+ was added to chloroplast inner envelope membrane vesicles, the fluorescence also decreased (Fig. 1C). The fluorescence at t = 0 was shifted about 0.5 fluorescence units lower in chloroplast inner envelope membranes compared with asolectin membranes with pyrithione; however, the extent of the fluorescence change was similar in the two preparations. The quenching of fluorescence by iron showed a rapid fluorescence decrease, coming to completion within 3s (Fig. 2). As the Fe2+ concentration increased, the extent of fluorescence quenching also increased.
Figure 1.
Ferrous iron quenching of PGSK fluorescence in asolectin and chloroplast inner envelope membrane vesicles. Asolectin and chloroplast inner envelope membrane vesicles were loaded with PGSK using the extrusion method described in “Materials and Methods” (pH = 8.0). Vesicles were rapidly mixed with 5 μm Fe2+ in external buffer (pH 7.0) in a stopped-flow apparatus and fluorescence emission was monitored at 520 nm with excitation at 506 nm. A, Asolectin vesicles. B, Asolectin vesicles pre-incubated 10 min with 20 mm pyrithione. C, Chloroplast inner envelope membrane vesicles.
Figure 2.
Ferrous iron quenching of PGSK fluorescence in chloroplast inner envelope membrane vesicles. Chloroplast inner envelope membrane vesicles were loaded with PGSK using the extrusion method described in “Materials and Methods” (pH = 8.0). Vesicles were mixed with varying amounts of Fe2+ in external buffer (pH 7.0) as indicated. Fluorescence emission was monitored at 520 nm after excitation at 506 nm.
Calibration of PGSK Fluorescence
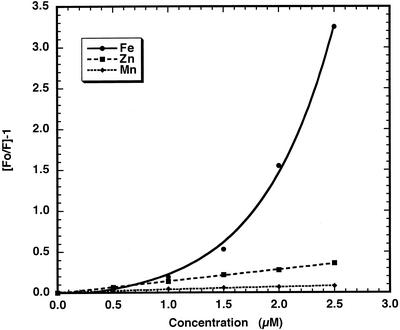
Additions of small aliquots of Fe2+ were made to a PGSK solution in a cuvette and the resulting fluorescence measured. These data were used to construct a Stern-Volmer plot relating fluorescence changes to Fe2+ concentration (Fig. 3). Similar plots were also constructed for quenching of PGSK fluorescence by Zn2+ and Mn2+. The concentration dependence of quenching of PGSK fluorescence by Fe2+ is curvilinear. Approximation of the relation of PGSK fluorescence quenching to a quadratic equation allows for the calibration of fluorescence changes to the concentration of Fe2+.
Figure 3.
Stern-Volmer plot of PGSK fluorescence quenching by cations. The fluorescence emission, monitored at 520 nm with excitation at 506 nm of a solution of 50 μm PGSK in buffer A, was measured in the presence of varying concentrations of Fe2+, Zn2+, or Mn2+.
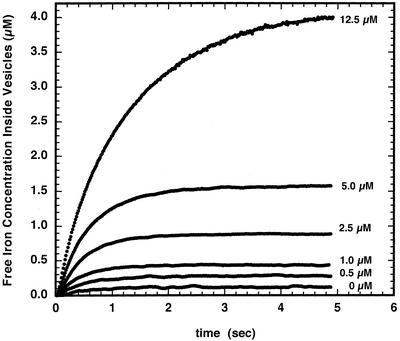
Calibration of the Fe2+ transport data for chloroplast inner envelope membrane vesicles presented in Figure 2 are shown in Figure 4. In general, the uptake of Fe2+ equilibrates at levels lower than the concentration of iron added. For instance, at 5 μm added Fe2+ the concentration of Fe2+ determined inside the membrane vesicles was 1.6 μm.
Figure 4.
Intravesicular concentration of ferrous iron in chloroplast inner envelope membrane vesicles loaded with PGSK. Data from Figure 2 were used to determine the intravesicular Fe2+ concentration using the calibration procedure outlined in “Materials in Methods.”
Sidedness of Fe2+ Transport
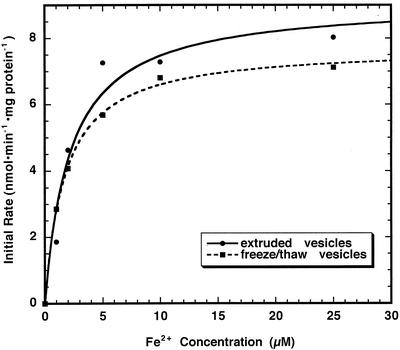
Chloroplast inner envelope membranes can be prepared by a freeze/thaw technique, to produce vesicles largely inside-out in orientation, or by an extrusion method, to produce vesicles of largely right-side-out orientation (Shingles and McCarty, 1995). The initial rates of Fe2+ transport over the first 3 s are determined as the product of the rate constant and the extent of change from the curve fit to a single exponential rise from data like those shown in Figure 4. Conversion of micromolar Fe to nanomoles of Fe transported across the vesicles requires an estimation of the total volume of vesicles used in each experiment. Our membrane preparations are standardized on a milligram per inner envelope protein basis. In addition, measurements of vesicle diameters by a quasi-elastic light scattering analysis show that the vesicles are fairly consistent in size; 87 ± 25 nm for extruded vesicles, and 254 ± 58 nm for freeze/thaw vesicles (see also Shingles and McCarty, 1995). Membrane vesicles can be loaded with pyranine and fluorescence can be measured before and after the addition of p-xylene bispyridinium dibromide (DPX) to quench external pyranine fluorescence (Shingles and McCarty, 1995). From this method, chloroplast inner envelope membranes prepared by the freeze/thaw and extrusion methods produce vesicles with volumes of approximately 3.9 μL mg−1 protein and 2.0 μL mg−1 protein, respectively. The calculated initial rates are plotted against concentration to produce the Michaelis-Menten curve shown in Figure 5. At low concentrations of Fe2+, the rates of transport were equivalent in both freeze/thaw and extruded membrane vesicles. The calculated Vmax for extruded vesicles was 9.1 nmol min−1 mg protein−1 and for freeze-/thaw-prepared vesicles the Vmax was 8.7 nmol min−1 mg protein−1. The Km values were also similar in magnitude in both extruded and freeze-/thaw-prepared membranes (2.1 and 1.8 μm, respectively).
Figure 5.
Initial rate of Fe2+ transport in extruded and freeze-/thaw-prepared chloroplast inner envelope membrane vesicles. Inner envelope membranes were prepared by extrusion to produce vesicles largely right side out in orientation. Inner envelope membranes were also prepared by a freeze/thaw technique to produce membranes of largely inside-out orientation. Internal vesicle pH was 8.0, whereas external pH was 7.0. Intravesicular Fe2+ concentration was determined as described in “Materials and Methods” at different concentrations of added Fe2+. Initial rates were determined from the equation describing a single exponential increase.
Proton Gradient or Potential Gradient?
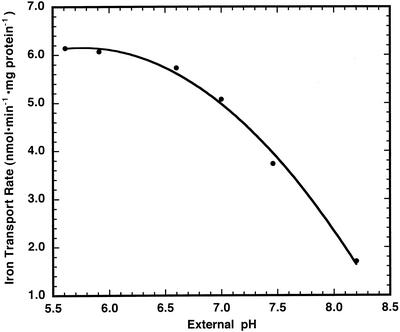
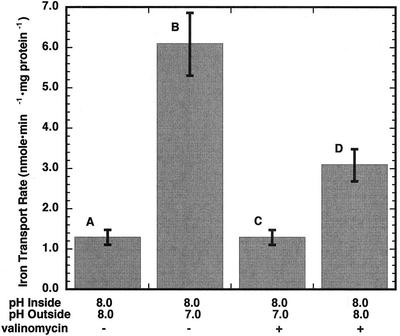
To investigate the possibility that an electrochemical proton gradient may stimulate Fe2+ uptake, Fe2+ influx into inner envelope vesicles was monitored in the stopped-flow apparatus under several conditions. In these assays, the added free external [Fe2+] was equal to 5.0 μm. When the external and internal pH were equivalent, the initial rate of Fe2+ transport was determined to be 1.7 nmol min−1 mg protein−1 (Fig. 6). However, when the vesicles in pH 8.2 buffer (containing 100 mm KCl) were mixed with the same buffer giving a final external pH of 7.0 in the presence of Fe2+, the initial rate increased approximately 200% to 5.1 nmol min−1 mg protein−1. The activity of Fe2+ transport appeared to be dependent upon the external pH down to approximately pH 6.0, where no further stimulation of Fe2+ transport occurred. This observation may be consistent with a Fe2+/H+ symport mechanism for Fe2+ movement across inner envelope vesicles or may reflect a dependence of Fe2+ uptake on pH. Because the proton electrochemical gradient has a ΔΨ component, the results are also consistent with a potential-stimulated uniport mechanism as described for calcium transport across the chloroplast envelope (Kreimer et al., 1985; Roh et al., 1998). We have used the potential dye oxonol to confirm that there is a membrane potential (lumen negative) present under these experimental conditions. In the absence of a pH gradient, a low rate of ferrous iron uptake is measured (Fig. 7A). An inwardly directed pH gradient of one unit stimulates ferrous iron transport over 4-fold (Fig. 7B). In the presence of 2 nm valinomycin, which dissipates the potential gradient, the stimulation of Fe2+ movement by the pH jump disappeared (Fig. 7C). Finally, when the vesicles were mixed with pH 8.0 buffer (no pH gradient present) containing 100 mm choline chloride, in the presence of valinomycin, resulting in the formation of a membrane potential (lumen negative), the initial rate of Fe2+ uptake was again stimulated (Fig. 7D). Thus, it appears that membrane potential, rather than either external pH or ΔpH, is the cause of the stimulation of Fe2+ uptake by a pH jump.
Figure 6.
Effect of external pH on the initial rate of Fe2+ transport across chloroplast inner envelope membrane vesicles. PGSK-loaded inner envelope vesicles (pH = 8.0 inside) were mixed with external buffer at different pH values plus 5 μm Fe2+. PGSK fluorescence quenching was determined over 3 s after mixing and, using the calibration procedure described in “Materials and Methods,” the initial rates of transport were determined.
Figure 7.
pH and potential gradient effects on Fe2+ transport across chloroplast inner envelope membrane vesicles. A, Extruded inner envelope vesicles at pH 8.0 were mixed with external buffer at pH 8.0 containing 5 μm Fe2+. B, Extruded inner envelope vesicles at pH 8.0 were mixed with external buffer at pH 7.0 containing 5 μm Fe2+. C, Conditions were the same as B with vesicles pre-incubated with 2 nm valinomycin on ice for 30 min. D, Membrane potential was imposed across the vesicle membranes by mixing vesicles prepared in 100 mm KCl, 10 mm K-HEPES, and 100 mm Suc with an equal volume of the same buffer in which the 100 mm KCl was replaced with 100 mm choline chloride. The instantaneous equilibration of K+ in the presence of valinomycin resulted in a negatively charged vesicle interior. Data shown are the mean ± sd (n = 9).
Inhibition of Fe2+ Transport across Chloroplast Inner Envelope Vesicles
Chloroplast inner envelope vesicles transport calcium. To see if iron transport may also use the calcium transport mechanism, two known inhibitors of calcium transport were utilized, lanthanum chloride and diltiazem (Roh et al., 1998). Neither of the calcium transport inhibitors affected Fe2+ transport across inner envelope membranes (data not shown). The sulfhydryl modifier, N-ethylmaleimide, also had no effect on iron transport.
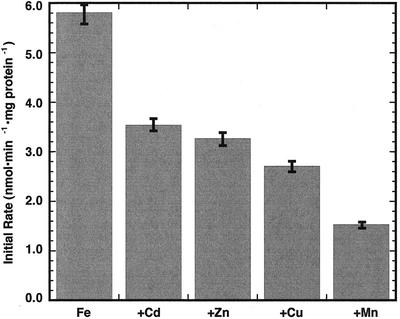
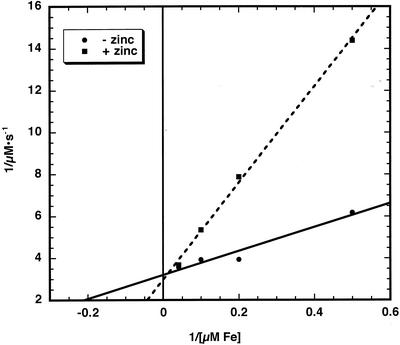
Some members of the ZIP family of genes are involved in zinc transport (Guerinot, 2000). The rapid mixing of 5 μm concentrations of Fe2+ and Zn2+ to PGSK-loaded inner envelope vesicles (so as to have minimal impact on the membrane potential) resulted in the inhibition of the initial rate of Fe2+ transport by 42% (Fig. 8). In fact, under these conditions Zn2+ acted as a competitive inhibitor of Fe2+ transport (Fig. 9). Fe2+ transport was also inhibited 40%, 52%, and 74% by equivalent concentrations of Cd2+, Cu2+, and Mn2+, respectively (Fig. 8).
Figure 8.
Effect of added cations on Fe2+ transport across chloroplast inner envelope membrane vesicles. Vesicles contained buffer at pH 8.0 inside and were mixed with external buffer at pH 7.0. Control rate of Fe2+ transport into PGSK-loaded vesicles was established using 5 μm Fe2+. Addition of all other cations was also at 5 μm. Intravesicular Fe2+ concentration was determined as described in “Materials and Methods” at different concentrations of added Fe2+. Initial rates were determined from the equation describing a single exponential increase. Data shown are the mean ±sd (n = 3).
Figure 9.
Lineweaver-Burk plot of Zn2+ inhibition of Fe2+ transport. Inner envelope membranes were prepared by extrusion. Intravesicular Fe2+ concentration was determined as described in “Materials and Methods” at different concentrations of Fe2+ in the absence (●) and presence (▪) of 5 μm Zn2+.
Because Fe2+ transport occurs bidirectionally across the chloroplast inner envelope, the effects of Zn2+ on Fe2+ transport were measured with inside-out and right-side-out vesicles (Table I). The addition of Zn2+ to largely inside-out vesicles resulted in a similar Vmax compared with iron alone. However, the apparent Km increased from 1.8 to 4.1 μm. With largely right-side-out vesicles, the Vmax of iron transport was again similar whether zinc was added or not. However, the apparent Km in these membrane preparations increased from 2.1 to 10.8 μm.
Table I.
Kinetic constants for iron transport across chloroplast inner envelope membrane vesicles and zinc inhibition
| Condition | Metal | Vmax | Km |
|---|---|---|---|
| (nmol min−1 mg protein−1) | μm | ||
| Inside-out vesicles | Iron | 9.9 ± 0.1 | 1.8 ± 0.2 |
| Iron + zinc | 10.7 ± 0.3 | 4.1 ± 0.1 | |
| Right-side-out vesicles | Iron | 9.7 ± 0.6 | 2.1 ± 0.1 |
| Iron + zinc | 11.6 ± 0.4 | 10.8 ± 0.3 |
Initial rates of Fe2+ transport were determined in extruded and freeze-/thaw-prepared vesicles. Kinetic constants were determined from Michaelis-Menten plots of the data. Zn2+, where used, was added at a concentration of 5 μm. Data are shown as the mean ± sd (n = 9).
DISCUSSION
Phen Green consists of a metal binding phenanthroline covalently attached to fluorescein. The membrane-impermeant form of this molecule, PGSK, can be easily loaded into membrane vesicles. The chloroplast inner envelope is rich in carotenoids, which absorb in the 450 to 480 nm range. The wavelengths at which PGSK fluorescence is excited (506 nm) and emission measured (520 nm) avoid the problem of carotenoid absorbance, making PGSK a suitable fluorophore to measure metal ion transport across this membrane.
The rate of Fe2+ transport in asolectin vesicles was negligible (Fig. 1). Pyrithione, an ionophore for Zn2+ (Kim et al., 1999), Ni2+, and Cd2+ (Jasim and Tjalve, 1986), promotes the rapid entry of Fe2+ into asolectin vesicles.
Fe2+ addition to chloroplast inner envelope vesicles caused a rapid quenching of the fluorescence of entrapped PGSK indicating transport of Fe2+ into the vesicle lumen. The rate of quenching of PGSK was dependent upon the concentration of added Fe2+ and typically saturated at about 10 μm Fe2+ (Fig. 4). The reported ratio of PGSK:iron interaction is typically 3:1 (Petrat et al., 1999); hence, with 50 μm PGSK loaded inside the membrane vesicles, saturation of iron transport occurs before the probe is completely complexed.
The interaction of PGSK with iron has a curvilinear response at low concentrations of iron (Fig. 3). The fluorescence of PGSK is much more sensitive to quenching by Fe2+ than Zn2+ and Mn2+. The fluorescence signal of PGSK as it interacts with iron can be calibrated using a modified Stern-Volmer plot as described in “Materials and Methods.” The free Fe2+ concentration within the membrane vesicles then can be calculated. It is interesting to note that the final concentration of iron inside membrane vesicles, after equilibration, is less than the concentration of added iron (Fig. 4). This may be because of sequestration of iron by the membrane lipids and/or proteins. We know that our inner envelope preparations have at least two isozymes of ferritin, an iron-complexing protein, associated with the membranes (R. Shingles, unpublished data). However, because of the low amount of membranes added in these experiments, this is unlikely to account for all of the difference. It is more likely that external PGSK may still bind ferrous iron through its phenanthroline component even though the fluorescent component of the molecule is quenched by DPX. Although extensive efforts were utilized to remove external PGSK, even if only 1% remained in our preparations we could still have an external PGSK concentration of 0.5 μm.
Fe2+ transport kinetics was similar in both right-side-out and inside-out membrane vesicles (Fig. 5), indicating bidirectional transport of iron. The Km for Fe2+ transport was about 2 μm, which is comparable in magnitude to the Km measured for several of the ZIP family metal ion transporters (Grotz et al., 1998). The Vmax for iron transport was approximately 9.8 nmol min−1 mg protein−1.
The rate of Fe2+ movement across asolectin membrane vesicles indicates that Fe2+ diffusion across membranes is, as expected, very limited (Fig. 1). The extent of Fe2+ movement across chloroplast inner envelope membrane vesicles is somewhat similar to pyrithione-assisted Fe2+ movement (Fig. 1). Fe2+ movement could occur across the chloroplast envelope by association with naturally produced metal carrier molecules, like pyrithione. However, the isolated inner envelope membranes are extensively washed, making the possibility of these metal carrier molecules being present low.
The facts that Fe2+ transport has saturation kinetics (Fig. 5), and that Zn2+ is a competitive inhibitor of Fe2+ transport (Fig. 9), suggest that Fe2+ transport is mediated by a transport protein. Ca2+ is moved across chloroplast inner envelope membranes by a transporter with channel-like activity that is sensitive to diltiazem (Roh et al., 1998). Because diltiazem had no effect, Fe2+ transport is very likely mediated by a transport protein distinct from the Ca2+ transporter.
The first iron transporter found in plants was IRT1, an Arabidopsis root plasma membrane protein with a structure having eight putative transmembrane domains and a His-rich metal-binding motif. A pea IRT1 ortholog has also been discovered called RIT (root iron transporter; Cohen et al., 1998). Other related metal-binding transport proteins have been identified as part of the ZIP family. One of these members, ZIP4, has an N-terminal sequence that, by the program PSORT (Nakai and Kanehisa, 1992), shows a high degree of probability of being targeted to the chloroplast. Another related protein called IRT3 also is predicted to have a chloroplast-targeting sequence. Neither of these genes has been expressed in a functional fashion to identify the ion specificity of the protein. However, the genomic data suggest that there are integral metal transport proteins associated with the chloroplast membranes.
The driving force for iron movement into chloroplasts is not yet clear. It is possible that chloroplasts could use a mechanism such as that described for strategy I plants (Bughio et al., 1997). For this to occur, the chloroplast may require a H+-ATPase, an Fe3+ reductase, and an Fe2+ transporter. In pea, the activity of an H+-ATPase has been measured in isolated chloroplast inner envelopes (Berkowitz and Peters, 1993; Shingles and McCarty, 1994; Peters and Berkowitz, 1998). However, we could not detect any Fe3+ reductase activity in pea chloroplast inner envelope membrane preparations (R. Shingles, unpublished data). The activity of a possible Fe3+ reductase may not be necessary if the iron taken up by the plant is transported as an Fe2+ chelate to the chloroplast. Chloroplast-targeted metal ion transporters, like those found in the Arabidopsis genome, would indicate that the Fe2+ transporters are likely present in chloroplast membranes. The link between an active H+-ATPase and Fe2+ transport may be indirect. The addition of 1.0 μm ATP alone did not stimulate Fe2+ uptake in chloroplast inner envelope vesicles (data not shown), indicating that a metal-pumping ATPase is likely not involved in Fe2+ transport. However, the activity of an H+-ATPase may affect Fe2+ uptake via the iron transporter.
Translocation studies of an iron chelate in intact barley plants revealed that iron transport from leaf veins to mesophyll cells was light regulated (Bughio et al., 1997). In addition, these authors showed that iron influx in isolated chloroplasts was also light dependent. Chloroplasts in the light have a pH gradient across their inner envelopes, which may be maintained by an envelope H+-ATPase (Shingles and McCarty, 1994). Fe2+ transport across inner envelope membrane vesicles was stimulated by an electrochemical proton gradient (Fig. 6). This raises the possibility of an Fe2+/H+ symport transport mechanism. However, subsequent experiments with added valinomycin to negate the potential gradient across the membranes also greatly reduced Fe2+ transport (Fig. 7). This would suggest that Fe2+ transport occurs as a result of the potential gradient across chloroplast inner envelope membranes, similar to what was discovered with calcium transport across the same envelope (Roh et al., 1998).
Experiments with isolated barley chloroplasts also indicated that iron efflux occurs in the dark (Bughio et al., 1997). Because functional ferritin, the major storage protein for iron, exists in plastids, it is not surprising that iron could also be transported out of the chloroplast as well as into the chloroplast. The experiments performed here on isolated pea chloroplast inner envelopes indicate that Fe2+ transport can occur at similar rates in right-side-out and inside-out vesicles and is therefore bidirectional (Fig. 5). It is possible that the uptake of Fe2+ by chloroplasts in the light and its subsequent release in the dark may occur on the same transporter. In the light, the driving force for Fe2+ uptake may be the membrane potential gradient across the chloroplast inner envelope. The driving force for Fe2+ efflux in the dark may simply be the concentration difference between the chloroplast stroma and the cytosol. However, the efflux of Fe2+ may also be regulated by zinc levels as evidenced by the change in apparent Km for Fe2+ transport in the presence of Zn2+ (Table I).
The ZIP family of metal ion transporters largely encompasses iron and zinc transporters (Guerinot, 2000). Some transporters, such as IRT1, transport both iron and zinc, whereas some family members appear to transport zinc alone. The metal ion transported in these experiments was determined through complementation experiments with the gene expressed in yeast (Saccharomyces cerevisiae) strains deficient in either zinc or iron uptake (Eide et al., 1996; Grotz et al., 1998; Guerinot, 2000). This system is not conducive to detailed kinetic studies of metal ion transport across membranes because of the difficulty measuring initial rates of ion transport. Isolated inner envelope membrane vesicles loaded with the iron-sensitive fluorophore PGSK allowed for the accurate and direct determination of iron transport kinetics on a millisecond time scale. Fe2+ transport across pea chloroplast inner envelopes was sensitive to the addition of Zn2+, Cu2+, and Mn2+ (Fig. 8). Addition of Zn2+ and Fe2+ simultaneously to PGSK-loaded vesicles caused an increase in Km without affecting the Vmax for ferrous iron transport (Table I). It could be argued that Zn2+ may be transported on a distinct protein from the ferrous transporter, and thus may be dissipating the membrane potential, the driving force for ferrous iron uptake. However, initial rates of Fe2+ transport were measured and if the driving force were quickly dissipated, the Vmax would also be lower and be suggestive of noncompetitive inhibition. The kinetic data, shown in Figure 9, are consistent with competitive inhibition of ferrous iron transport. All of these divalent ions are required for biochemical processes within the chloroplast and hence must cross the chloroplast inner envelope. It is possible that the Fe2+ transporter in pea chloroplast inner envelope membranes may be a general divalent cation transporter and that Zn2+, Cu2+, and Mn2+ may be alternative substrates. All of the inhibitory ions tested had little effect on PGSK fluorescence (Fig. 3; Shingles et al., 2001), so if they were transported across the membrane their effect would not be measurable against the high degree of Fe2+ quenching of the fluorophore. The transport of other ions across the chloroplast inner envelope could be measured, in similar fashion to the measurement of Fe2+ transport, using fluorophores that are sensitive to the particular ion of interest.
MATERIALS AND METHODS
Reagents
PGSK and DPX were purchased from Molecular Probes (Eugene, OR). Ferrous sulfate heptahydrate, cupric chloride dihydrate, cadmium chloride anhydrous, manganese chloride tetrahydrate, and zinc chloride heptahydrate were purchased from Sigma (St. Louis). Pyrithione was purchased from Aldrich (Milwaukee, WI). Stock solutions of buffer components were made with distilled and deionized water passed through a column containing Chelex-100 to reduce metal ion content. Ferrous sulfate stock solutions were made up in 0.1 m acetic acid with 10 mm ascorbate.
Plant Material
Pea (Pisum sativum L. cv Laxton's Progress No. 9) plants were grown from seed for 16 to 18 d in vermiculite in a controlled environment growth cabinet (Revco, Asheville, NC) set for 16-h day (24°C)/8-h night (20°C) periods.
Membrane Isolation
Intact chloroplasts were isolated according to the method of Joy and Mills (1987). Inner envelopes were prepared as described by Keegstra and Yousif (1986). Frozen intact chloroplasts, equivalent to between 80 and 120 mg chlorophyll, were thawed at 4°C, refrozen at −20°C, and thawed again at 4°C. Chloroplast rupture was facilitated by gentle homogenization using a pestle tissue grinder. The homogenate was centrifuged at 3,150g for 15 min. The resulting supernatants were collected and centrifuged at 27,000g for 90 min. Pellets were resuspended in 0.2 m suc and placed on top of a 0.45/0.80/1.0 m Suc step gradient and centrifuged at 105,000g for 18 h. Inner envelope membrane vesicles were recovered from the 0.80/ 1.0 m suc interface. All of the above operations were performed at 4°C. Inner envelopes were stored under liquid nitrogen.
Vesicle Preparations
Asolectin (crude lipids from soybean [Glycine max]) was prepared from concentrate (Associated Concentrates, Woodside, NY) by suspending 20 mg in 2.0 mL of buffer A (0.1 mm K-HEPES [pH 8.0], 5 mm MgCl2, and 50 mm KCl), followed by sonication for 5 min. Suspensions of purified inner envelopes or asolectin (20 mg) were diluted 4-fold in buffer A. The membranes were pelleted by centrifugation at 144,000g for 1 h at 4°C and then resuspended in buffer A before vesicle preparation. Membrane vesicles were prepared (except where indicated) using the extrusion technique (Shingles and McCarty, 1995) in a buffer containing 50 μm PGSK, 0.1 mm K-HEPES (pH 8.0), 5 mm MgCl2, 50 mm KCl, and 5 mm 2–2′-dipyridyl. Membrane vesicles were also prepared by the freeze/thaw method described by Shingles and McCarty (1994) for certain experiments. The vesicle preparation was then passed through a 1.6- × 10-cm Sephadex G-50 column equilibrated with 10 mm K-HEPES (pH 8.0), 5 mm MgCl2, and 50 mm KCl at 4°C to remove external PGSK, and the eluant diluted to 15 mL with the same buffer. The vesicle suspension was allowed to equilibrate for 1 h at 4°C before use.
Stopped-Flow Spectrofluorometric Assay of Iron Transport in Membrane Vesicles
Fluorescence measurements were collected with an OLIS- modified SLM-SPF-500C spectrofluorometer equipped with an OLIS USA-SF stopped-flow apparatus (Bogart, GA). For vesicle preparations, chamber A contained 2.0 mL of vesicle suspension in buffer A at pH 8.0 plus 5 mm DPX to quench the fluorescence of residual external PGSK outside of the vesicles. Chamber B contained various concentrations of FeSO4 in 2.0 mL of buffer B (0.1 mm K-HEPES, 5 mm MgCl2, and 50 mm KCl) at pH 6.1. Mixing of samples was achieved by a nitrogen-driven piston at 80 psi. Fluorescence was followed at an emission wavelength of 520 nm after excitation at 506 nm. All slits were set at 10 nm with a cutoff filter (LP510, Oriel Co. Stamford, CT) placed over the entrance to the emission monochromator. All measurements were taken at 25°C.
Standard Curve for Quenching of Phen Green
PGSK to a final concentration of 50 μm was added to a cuvette in buffer A. A calibration curve was generated by adding small aliquots of FeSO4 to the cuvette while stirring and measuring the fluorescence emission between 500 and 540 nm with excitation at 506 nm. Fluorescence at peak emission (520 nm) was used to determine the (Fo/F) − 1 ratio and plotted against iron concentration.
Data Reduction and Handling
Curve fitting was carried out using the graphing program Kaleidagraph (Synergy Software, Reading, PA). The rates of Fe2+ flux were calculated from the initial rate of change of PGSK fluorescence over the first 3 s of data collected. Calibration of PGSK fluorescence change with added Fe2+ was calculated as described by Shingles et al. (2001).
Assays
The modified TCA-Lowry procedure of Bensadoun and Weinstein (1976) was used to determine the amount of protein in the membrane preparations.
ACKNOWLEDGMENT
We would like to thank Lynn Scott for the preparations of pea chloroplasts and inner envelope membranes.
Footnotes
This work was supported by the U.S. Department of Energy (grant no. DE–FG02–92ER 200 280).
Article, publication date, and citation information can be found at www.plantphysiol.org/cgi/doi/10.1104/pp.010858.
LITERATURE CITED
- Bensadoun A, Weinstein D. Assay of proteins in the presence of interfering materials. Anal Biochem. 1976;70:241–250. doi: 10.1016/s0003-2697(76)80064-4. [DOI] [PubMed] [Google Scholar]
- Berkowitz GA, Peters JS. Chloroplast inner-envelope ATPase acts as a primary H+ pump. Plant Physiol. 1993;102:261–267. doi: 10.1104/pp.102.1.261. [DOI] [PMC free article] [PubMed] [Google Scholar]
- Brüggeman W, Maas-Kantel K, Moog P. Iron uptake by leaf mesophyll cells: the role of the plasma membrane-bound ferric-chelate reductase. Planta. 1993;190:151–155. [Google Scholar]
- Bughio N, Takahashi M, Yoshimura E, Nishizawa NK, Mori S. Light-dependent iron transport into isolated barley chloroplasts. Plant Cell Physiol. 1997;38:101–105. [Google Scholar]
- Cohen CK, Fox TC, Garvin DF, Kochian LV. The role of iron-deficiency stress responses in stimulating heavy-metal transport in plants. Plant Physiol. 1998;116:1063–1072. doi: 10.1104/pp.116.3.1063. [DOI] [PMC free article] [PubMed] [Google Scholar]
- Eide D, Broderius M, Fett J, Guerinot ML. A novel iron-regulated metal transporter from plants identified by functional expression in yeast. Proc Natl Acad Sci USA. 1996;93:5624–5628. doi: 10.1073/pnas.93.11.5624. [DOI] [PMC free article] [PubMed] [Google Scholar]
- Grotz N, Fox T, Connolly E, Park W, Guerinot M, Eide D. Identification of a family of zinc transporter genes from Arabidopsis that respond to zinc deficiency. Proc Natl Acad Sci USA. 1998;95:7220–7224. doi: 10.1073/pnas.95.12.7220. [DOI] [PMC free article] [PubMed] [Google Scholar]
- Guerinot ML. The ZIP family of metal transporters. Biochim Biophys Acta-Biomembr. 2000;1465:190–198. doi: 10.1016/s0005-2736(00)00138-3. [DOI] [PubMed] [Google Scholar]
- Jasim S, Tjalve H. Effect of zinc pyridinethione on the tissue disposition of nickel and cadmium in mice. Acta Pharmacol Toxicol (Copenh) 1986;59:204–208. doi: 10.1111/j.1600-0773.1986.tb00155.x. [DOI] [PubMed] [Google Scholar]
- Joy KW, Mills WR. Purification of chloroplasts using silica sols. Methods Enzymol. 1987;148:179–188. [Google Scholar]
- Keegstra K, Yousif AE. Isolation and characterization of chloroplast envelope membranes. Methods Enzymol. 1986;118:316–325. [Google Scholar]
- Kim CH, Kim JH, Moon SJ, Chung KC, Hsu CH, Seo JT, Ahn YS. Pyrithione, a zinc ionophore, inhibits NF-κB activation. Biochem Biophys Res Commun. 1999;259:505–509. doi: 10.1006/bbrc.1999.0814. [DOI] [PubMed] [Google Scholar]
- Kreimer G, Melkonian M, Holtum JAM, Latzko E. Characterization of calcium fluxes across the envelope of intact spinach chloroplasts. Planta. 1985;166:515–523. doi: 10.1007/BF00391276. [DOI] [PubMed] [Google Scholar]
- Nakai K, Kanehisa M. A knowledge base for predicting protein localization sites in eucaryotic cells. Genomics. 1992;14:897–911. doi: 10.1016/S0888-7543(05)80111-9. [DOI] [PMC free article] [PubMed] [Google Scholar]
- Peters JS, Berkowitz GA. Characterization of a chloroplast inner envelope P-ATPase proton pump. Photosynthesis Res. 1998;57:323–333. [Google Scholar]
- Petrat F, de Groot H, Rauen U. Determination of the chelatable iron pool of single intact cells by laser scanning microscopy. Arch Biochem Biophys. 2000;376:74–81. doi: 10.1006/abbi.2000.1711. [DOI] [PubMed] [Google Scholar]
- Petrat F, Rauen U, de Groot H. Determination of the chelatable iron pool of isolated rat hepatocytes by digital fluorescence microscopy using the fluorescent probe, phen green SK. Hepatology. 1999;29:1171–1179. doi: 10.1002/hep.510290435. [DOI] [PubMed] [Google Scholar]
- Roh MH, Shingles R, Cleveland MJ, McCarty RE. Direct measurement of calcium transport across chloroplast inner-envelope vesicles. Plant Physiol. 1998;118:1447–1454. doi: 10.1104/pp.118.4.1447. [DOI] [PMC free article] [PubMed] [Google Scholar]
- Römheld V, Marschner H. Mobilization of iron in the rhizosphere of different plant species. Adv Plant Nutr. 1986a;2:155–204. [Google Scholar]
- Römheld V, Marschner H. Evidence for a specific uptake system for iron phytosiderophores in roots of grasses. Plant Physiol. 1986b;80:175–180. doi: 10.1104/pp.80.1.175. [DOI] [PMC free article] [PubMed] [Google Scholar]
- Shingles R, McCarty RE. Direct measurement of ATP-dependent proton concentration changes and characterization of a K+-stimulated ATPase in pea chloroplast inner envelope vesicles. Plant Physiol. 1994;106:731–737. doi: 10.1104/pp.106.2.731. [DOI] [PMC free article] [PubMed] [Google Scholar]
- Shingles R, McCarty RE. Production of membrane vesicles by extrusion: size distribution, enzyme activity, and orientation of plasma membrane and chloroplast inner-envelope membrane vesicles. Anal Biochem. 1995;229:92–98. doi: 10.1006/abio.1995.1383. [DOI] [PubMed] [Google Scholar]
- Shingles R, North M, McCarty RE. Direct measurement of ferrous ion transport across membranes using a sensitive fluorometric assay. Anal Biochem. 2001;296:106–113. doi: 10.1006/abio.2001.5209. [DOI] [PubMed] [Google Scholar]
- Shingles R, Roh MH, McCarty RE. Nitrite transport in chloroplast inner envelope vesicles: I. Direct measurement of proton-linked transport. Plant Physiol. 1996;112:1375–1381. doi: 10.1104/pp.112.3.1375. [DOI] [PMC free article] [PubMed] [Google Scholar]
- Sze H. H+-translocating ATPases: advances using membrane vesicles. Annu Rev Plant Physiol Plant Mol Biol. 1985;36:175–208. [Google Scholar]
- Terry N, Abadia J. Function of iron in chloroplasts. J Plant Nutr. 1986;9:609–646. [Google Scholar]


