Abstract
The properties of compressed liquid hydrogen, the most abundant fluid in the universe, have been investigated by means of first-principles molecular dynamics at pressures between 75 and 175 GPa and temperatures closer to the freezing line than so far reported in shock-wave experiments. Evidence for a liquid–liquid transition between a molecular and a dissociated phase is provided. The transition is accompanied by a 6% increase in density and by metallization. This finding has important implications for our understanding of the interiors of giant planets and supports predictions of a quantum fluid state at low temperatures.
The search for a metallic state and the abundance of hydrogen in stars and giant planets have stimulated widespread interest in the states of hydrogen at extreme conditions of pressure and temperature. Multimegabar pressures (1 Mbar = 100 GPa ≃ 106 atm) can be simulated in the laboratory by means of shock-wave or static methods. Shock experiments have focused on the fluid at very high temperatures (1–3), whereas static experiments on the solid molecular phases (4–6) were mainly at low temperatures. Temperatures in shock experiments increase fast with pressure, up to several thousand K, whereas temperatures in static diamond-anvil cell experiments typically are restricted to ambient or below, because of difficulties in sample confinement. As a consequence, the properties of compressed liquid hydrogen at intermediate temperatures, close to the freezing line, are unknown. An extrapolation of the freezing line, obtained from measurements up to 20 GPa, suggests that the freezing temperature could cease to increase after reaching 1,100 K at a critical pressure of ≈120 GPa (7). More recent experiments confirm this picture (E. Gregoryanz, A. F. Goncharov, K. Matsuishi, H.-k. Mao, and R. J. Hemley, personal communication). A sign reversal of the freezing slope implies, through the Clausius–Clapeyron relation, that the liquid becomes denser than the solid above 120 GPa. This finding raises fundamental questions about the structure of the compressed liquid and in particular about the extent of its structural differences with respect to the molecular solid.
Computational Methods
First-principles molecular dynamics has been extensively used as a theoretical tool to explore the behavior of hydrogen at extreme conditions, for example along the shock compression curves (9–12) and in the search for new low-temperature structures (13). Evidence of a crossover from a molecular to an atomic liquid in the region of the putative freezing maximum was provided on the basis of first-principles molecular dynamics (14), but no attempt was made to map out the location of the transition line in the pressure-temperature diagram. Identifying with first-principles simulations the occurrence of finite-temperature phase transitions in compressed hydrogen requires extreme care. First, the use of a constant-pressure (isobaric) thermodynamic sampling is strongly suggested. In fact, direct constant-volume simulations of phase transitions are affected by larger hysteresis effects than constant-pressure simulations if the volume jump at the transition is not negligible and the simulation cell is small (as in first-principles simulations). On the other hand, indirect constant-volume methods based on the evaluation of the Gibbs free energy through thermodynamic integration (15) are computationally expensive and become a viable option to direct simulations only when the latter are affected by large hysteresis, which is not the case of compressed liquid hydrogen, as seen below. A second important technical issue concerns the sampling of the Brillouin zone (in unit-cell crystal calculations), or equivalently the size of the simulation cell (in supercell calculations with single-point Brillouin zone sampling). Relative phase stabilities were shown to be unusually sensitive to these approximations (13, 16). Here both requirements are met. The first requirement is met by making use of the Parrinello–Rahman algorithm (17), whereby the simulation cell is allowed to adjust in size and shape to properly sample the isobaric ensemble. The second requirement is met by working with simulation cells containing 448 atoms, a number that was found sufficient to guarantee convergence both for electronic and structural properties, as detailed below.
Simulations were performed with the Car–Parrinello method (18) and a variable-cell algorithm (19). The fictitious mass of the electronic wave functions was 50 a.u. (20), which requires a time step of 4 a.u. for the integration of the equations of motion. Molecular dynamics runs were started by equilibrating the system for an amount of time varying between 0.5 and 1 ps, and statistical averages were collected in the subsequent 1 ps of the dynamics, corresponding to ≈10,000 time steps, respectively. Protons were assumed to behave as classical particles. This is a good approximation at 1,500 K, because quantum effects on the ground-state structure are roughly equivalent to classical thermal effects at 500 K in the classical system (21). The electron-ion interaction was modeled with a pseudopotential (13) and electronic states were expanded in plane waves up to a cutoff of 60 Ry with Γ-point sampling of the Brillouin zone. Γ-point sampling with a 448-atom supercell is roughly equivalent to the eight-point sampling in a 64-atom supercell used in ref. 22. We estimate that errors in the energy differences introduced by such k-point sampling are of the order of 5 meV per atom. Electron–electron interactions were treated by using the local density approximation supplemented with gradient corrections (13).
Results
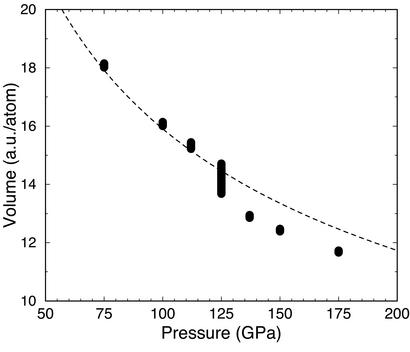
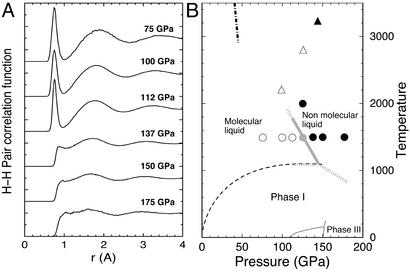
A molecular liquid was initially equilibrated at 75 GPa and 1,500 K by melting a molecular solid from phase I. We did not observe any sign of molecular dissociation at these conditions. Pressure was then increased isothermally at a rate of ≈6 GPa/ps, up to 175 GPa. A clear transformation took place at 125 GPa, as signaled by a significant reduction of the volume of the simulation cell (Fig. 1). The reverse transition was observed when pressure was released from 137 to 112 GPa, indicating that the simulated transition is not affected by hysteresis. Inspection of the local structure of the liquid and in particular of the H-H pair correlation function, a measure of the probability of finding a pair of H atoms at a distance r from one another, shows a clear change from a molecular liquid <125 GPa, with a well defined first peak at ≈0.7 Å, the intramolecular bond length, to a nonmolecular broader shape characteristic of a quasi-monoatomic liquid, >125 GPa (Fig. 2A). At 125 GPa the pair correlation function displayed an oscillatory molecular-to-atomic behavior with time, indicating that thermal equilibration could not be achieved at this pressure because of the limited size and time scale of the simulation. This is also responsible for the large error bar in the volume determination at 125 GPa (Fig. 1). Such finite size effects are well known in simulations of phase transitions and are consistent with a first-order character for the transition, although the possibility that the transition is a rapid, but continuous, crossover cannot be excluded a priori. The volume jump and the latent heat at the transition pressure, which we locate at 125 (±10) GPa, were calculated by extrapolating averages obtained at lower and higher pressures. The volume reduction is 6 (±2)%, whereas the latent heat is 70 (±20) meV per atom (the transformation being endothermic from molecular to nonmolecular). According to the Clausius–Clapeyron relation these values yield a dT/dP slope for the phase boundary of −17 (±7) K/GPa. In fact, we found a very similar transition when temperature was increased isobarically, at 125 GPa, to 2,000 K, which provides an independent support to the negative dT/dP slope.
Figure 1.
Calculated volumes for liquid hydrogen at 1,500 K (bars; their size gives the error). The anomalous error bar at 125 GPa is discussed in the text. The dashed line indicates the experimental volume at 300 K (23).
Figure 2.
(A) Pair correlation functions of hydrogen at 1,500 K and the pressures indicated. (B) Sketch of the hydrogen phase diagram. Circles indicate points where simulations were performed; ○ correspond to points where the system was found to be molecular (nonmolecular points are indicated by ●). Triangles indicate shock-wave points from ref. 2. A continuous transition from insulating (▵) to metal (▴) behavior was observed. The dashed line is an extrapolation of the melting line (7). The dash-dotted line is an extrapolation of the first-order transition line predicted by quantum Monte Carlo simulations with free-particle nodes for the electronic wave function (24). Gray lines indicate suggested phase boundaries.
Discussion
A number of important implications for the interiors of giant planets and, more generally, for our understanding of the hydrogen phase diagram (see Fig. 2B) can be immediately inferred from the present results.
I first remark that the existence of a first-order liquid–liquid transition line, the so-called plasma phase transition, has been proposed (25), although on the basis of considerably simpler models than the one used here. Quantum Monte Carlo (QMC) simulations initially confirmed the existence of a first-order transition line extending up to 10,000 K (24), but more recent work suggests that QMC predictions may depend crucially on how the location of the nodal planes of the electronic wave function is approximated (26). All theoretical models propose that the transition extends to temperatures up to at least 10,000 K, which appears to be inconsistent with recent experiments along the reverberating-shock Hugoniot of H2, where a seemingly continuous crossover from a molecular to a dissociated liquid is observed (2). Our simulations indicate that a sharp transition does indeed take place at lower temperatures (1,500–2,000 K), which is not inconsistent with the experimental and QMC results. The transition might end at a critical point located below the temperatures reached in shock experiments. If so, the nature of the liquid in the “supercritical” region above the critical point, that is along the shock Hugoniots and along the pressure-temperature isentrope of giant planets, could be more complex than previously thought. A number of thermodynamic and dynamical anomalies are known to occur above the critical point (27). These include a maximum in the temperature dependence of the pressure along the isentrope (1) and a minimum in the pressure dependence of the sound velocity. All of these anomalies are known to have important implications for our understanding of the interiors of giant planets (28, 29).
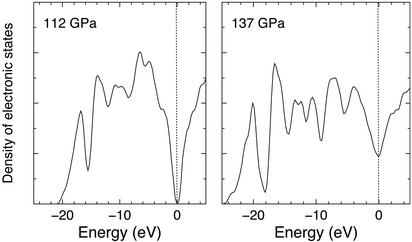
Because a continuous insulator-to-metal transition has been observed at similar pressures but slightly higher temperatures (2), we checked whether the transition observed here is also associated with metallization. We calculated the electronic density of states for the two phases (Fig. 3) and found that whereas the molecular phase is insulating, the nonmolecular phase displays a finite density of electronic states at the Fermi level, consistent with a metallic character. However, we caution that an accurate estimate of the electrical conductivity would require larger simulation cells (11) and would be likely affected by the systematic underestimation of excitation energies typical of gradient-corrected approximations to density functional theory (30).
Figure 3.
Electronic density of states of hydrogen at 1,500 K in the molecular state at 112 GPa (Left) and the nonmolecular state at 137 GPa (Right). The zero of the energy corresponds to the Fermi level.
The presence of a liquid–liquid transition line in the T-P plane (Fig. 2B) implies a downward change, or re-entrance, of the melting slope, which is consistent with experimental extrapolations (7). If the transition is first order then the change of the melting slope is discontinuous as a result of the appearance of a liquid–liquid–solid triple point. The re-entrance could then be steeper than anticipated, in agreement with very recent experimental evidence (E. Gregoryanz, A. F. Goncharov, K. Matsuishi, H.-k. Mao, and R. J. Hemley, personal communication).
The domain of stability of the nonmolecular liquid could extend to low temperatures and be further stabilized by quantum effects, neglected in the present work. This picture is consistent with the suggestion that the ground state of hydrogen at elevated pressures and low temperatures may be a quantum fluid (8).
The transition should be easily detectable in experiments. In static experiments, it would be signaled by the complete spectroscopic disappearance of the vibron excitation, whereas in shock experiments it would manifest as a discontinuity in the pressure–density relation.
Acknowledgments
I thank C. Cavazzoni for technical assistance and J. Kohanoff, B. Hetenyi, and R. Car for useful discussions. Calculations were performed at the W. M. Keck Materials Science Computing Center (Princeton University). This research was supported in part by the National Science Foundation.
References
- 1.Nellis W J, Ross M, Holmes N C. Science. 1995;269:1249–1252. doi: 10.1126/science.7652570. [DOI] [PubMed] [Google Scholar]
- 2.Weir S T, Mitchell A C, Nellis W J. Phys Rev Lett. 1996;76:1860–1863. doi: 10.1103/PhysRevLett.76.1860. [DOI] [PubMed] [Google Scholar]
- 3.Collins G W, Da Silva L B, Celliers P, Gold D M, Foord M E, Wallace R J, Ng A, Weber S V, Budil K S, Cauble R. Science. 1998;281:1178–1181. doi: 10.1126/science.281.5380.1178. [DOI] [PubMed] [Google Scholar]
- 4.Narayana C, Luo H, Oroloff J, Ruoff A L. Nature. 1998;393:46–49. [Google Scholar]
- 5.Goncharov A F, Gregoryanz E, Hemley R J, Mao H-k. Proc Natl Acad Sci USA. 2001;98:14234–14237. doi: 10.1073/pnas.201528198. [DOI] [PMC free article] [PubMed] [Google Scholar]
- 6.Loubeyre P, Occelli F, LeToullec R. Nature. 2002;414:613–617. doi: 10.1038/416613a. [DOI] [PubMed] [Google Scholar]
- 7.Datchi F, Loubeyre P, LeToullec R. Phys Rev B. 2000;61:6535–6546. [Google Scholar]
- 8.Ashcroft N W. J Phys Condens Matter. 2000;12:A129–A137. [Google Scholar]
- 9.Hohl D, Natoli V, Ceperley D M, Martin R M. Phys Rev Lett. 1993;71:541–544. doi: 10.1103/PhysRevLett.71.541. [DOI] [PubMed] [Google Scholar]
- 10.Alavi A, Parrinello M, Frenkel D. Science. 1995;269:1252–1254. doi: 10.1126/science.7652571. [DOI] [PubMed] [Google Scholar]
- 11.Galli G, Hood R Q, Hazi A U, Gygi F. Phys Rev B. 2000;61:909–912. [Google Scholar]
- 12.Lenosky T, Bickham S R, Kress J D, Collins L A. Phys Rev B. 2000;61:1–4. doi: 10.1103/PhysRevLett.84.4512. [DOI] [PubMed] [Google Scholar]
- 13.Kohanoff J, Scandolo S, Chiarotti G L, Tosatti E. Phys Rev Lett. 1997;78:2783–2786. [Google Scholar]
- 14.Pfaffenzeller O, Hohl D. J Phys Condens Matter. 1997;9:11023–11034. [Google Scholar]
- 15.Alfe D, Gillan M J, Price G D. J Chem Phys. 2002;116:6170–6177. [Google Scholar]
- 16.Mazin I I, Cohen R E. Phys Rev B. 1995;52:R8597–R8600. doi: 10.1103/physrevb.52.r8597. [DOI] [PubMed] [Google Scholar]
- 17.Parrinello M, Rahman A. J Appl Phys. 1981;52:7182–7190. [Google Scholar]
- 18.Car R, Parrinello M. Phys Rev Lett. 1985;55:2471–2474. doi: 10.1103/PhysRevLett.55.2471. [DOI] [PubMed] [Google Scholar]
- 19.Scandolo S. In: Proceedings of the International School of Physics “E. Fermi” on High-Pressure Phenomena. Hemley R J, Chiarotti G L, Bernasconi M, Ulivi L, editors. Amsterdam: IOS Press; 2002. pp. 195–214. [Google Scholar]
- 20.Tangney P, Scandolo S. J Chem Phys. 2002;116:14–24. [Google Scholar]
- 21.Biermann S, Hohl D, Marx D. Solid State Commun. 1998;108:337–341. [Google Scholar]
- 22.Kitamura H, Tsuneyuki S, Ogitsu T, Miyake T. Nature. 2000;404:259–262. doi: 10.1038/35005027. [DOI] [PubMed] [Google Scholar]
- 23.Loubeyre P, LeToullec R, Hausermann D, Hanfland M, Hemley R J, Mao H-k, Finger L W. Nature. 1996;383:702–704. [Google Scholar]
- 24.Militzer B, Magro W, Ceperley D. Contrib Plasma Physics. 1999;39:151–154. [Google Scholar]
- 25.Saumon D, Chabrier G. Phys Rev A. 1992;46:2084–2100. doi: 10.1103/physreva.46.2084. [DOI] [PubMed] [Google Scholar]
- 26.Militzer B. Ph.D. thesis. Urbana: University of Illinois; 2000. [Google Scholar]
- 27.Poole P H, Grande T, Angell C A, McMillan P F. Science. 1997;275:322–323. [Google Scholar]
- 28.Stevenson D J. J Phys Condens Matter. 1998;10:11227–11234. [Google Scholar]
- 29.Duffy T S, Vos W L, Zha C S, Hemley R J, Mao H-k. Science. 1994;263:1590–1593. doi: 10.1126/science.263.5153.1590. [DOI] [PubMed] [Google Scholar]
- 30.Johnson K A, Ashcroft N W. Nature. 2000;403:632–635. doi: 10.1038/35001024. [DOI] [PubMed] [Google Scholar]


