Abstract
Insig-1 and -2 are closely related proteins of the endoplasmic reticulum (ER) that block proteolytic activation of sterol regulatory element-binding proteins (SREBPs), transcription factors that activate the synthesis of cholesterol and fatty acids in liver and other organs. When cellular cholesterol levels are high, Insig proteins bind and trap SREBP cleavage-activating protein (SCAP), retaining it in the ER and preventing it from escorting SREBPs from ER to the site of proteolytic activation in the Golgi complex. Here, we report the discovery of a liver-specific transcript of Insig-2, designated Insig-2a. This transcript and the ubiquitous transcript, designated Insig-2b, differ through the use of different promoters that produce different noncoding first exons that splice into a common second exon. Although the Insig-2a and -2b mRNAs encode identical proteins, they differ in patterns of regulation. Insig-2a is the predominant transcript in livers of fed animals, and it is selectively down-regulated by insulin. Insig-2a mRNA increases when mice are fasted, and it declines when they are refed. The transcript also increases in livers of rats whose insulin-secreting pancreatic beta cells have been destroyed by streptozotocin, and it is reduced when insulin is injected. The insulin-mediated fall in Insig-2a may allow SREBP-1c to be processed, thereby allowing insulin to stimulate fatty acid synthesis, even under conditions in which hepatic cholesterol levels are elevated.
Synthesis of lipids in liver and other organs is controlled by a family of three membrane-bound transcription factors designated sterol regulatory element-binding proteins (SREBPs). Synthesized on membranes of the endoplasmic reticulum (ER), the SREBPs move in vesicles to the Golgi complex, where they are processed sequentially by two proteases (1, 2). These cleavages release a cytosolic transcription factor domain that enters the nucleus and activates genes that produce more than a score of enzymes required for the synthesis of cholesterol and unsaturated fatty acids as well as phospholipids and triglycerides (3).
The three isoforms of SREBP have separable but overlapping gene targets (3). SREBP-1a is a potent activator of both the cholesterol and fatty acid biosynthetic pathways. SREBP-1c, derived from the same gene as SREBP-1a through use of an alternative promoter, is relatively specific for fatty acid biosynthesis. SREBP-2, derived from a separate gene, is relatively specific for cholesterol biosynthesis. In liver, SREBP-1c and -2 are the predominant isoforms. SREBP-1a is present in much lesser amounts (4).
The activities of the SREBPs in liver are controlled at two levels: transcriptional and posttranscriptional. Transcription of the SREBP-1c gene is enhanced markedly by insulin and suppressed by glucagon (5–7). The insulin-mediated enhancement of SREBP-1c gene transcription provides a mechanism by which insulin increases the synthesis of fatty acids in the liver. SREBP-1c transcription is also activated by liver X receptors (LXRs), whose endogenous ligands include sterol intermediates in the cholesterol biosynthetic pathway (8–10). Inhibition of LXR by polyunsaturated fatty acids down-regulates SREBP-1c mRNA levels (11). The SREBP-2 gene, which controls cholesterol synthesis, is activated by nuclear SREBPs in a feed-forward fashion.
Posttranscriptionally, SREBP activity is regulated primarily by sterols, which inhibit the proteolytic processing of the membrane-bound SREBP precursors (1). This control is mediated by two proteins, designated SCAP (12) and Insig (13–15). Newly synthesized SREBPs form tight complexes with SCAP, a polytopic membrane protein of the ER. Under conditions of high sterol demand, the SCAP/SREBP complex is incorporated into vesicles that bud from the ER and travel to the Golgi, where SREBP processing occurs (16). Under conditions of sterol excess, the SCAP/SREBP complex binds to Insig, an intrinsic membrane protein of the ER (13, 14). This binding prevents the SCAP/SREBP complex from being incorporated into transport vesicles. As a result, SREBPs remain trapped in the ER, and proteolytic processing cannot occur. The nuclear content of SREBPs declines rapidly as a result of proteasomal degradation. As a result, the synthesis of cholesterol and fatty acids declines.
Two Insig isoforms are known, designated Insig-1 (13) and Insig-2 (14). The two human Insig proteins are 59% identical, and both bind SCAP in a sterol-dependent fashion. The two proteins differ, however, in their mode of regulation. In cultured cells, such as Chinese hamster ovary (CHO) cells, transcription of the Insig-1 gene requires nuclear SREBPs. This transcription declines markedly when SREBP activity is down-regulated. In contrast, Insig-2 activity in cultured CHO cells is constitutive and does not require nuclear SREBPs. This divergent regulation amplifies feedback control. When nuclear SREBP activity is low, Insig-2 is the only form of Insig present in the cell. If intracellular levels of cholesterol fall, SREBP cleavage can be activated rapidly. When SREBPs enter the nucleus, they increase the amount of Insig-1 mRNA, and this sensitizes the system to inhibition when sterol levels rise (13, 14).
The current experiments were designed to explore the regulation of Insig levels in liver. The results reveal a previously undetected liver-specific transcript from the Insig-2 gene, which we call Insig-2a. The Insig-2a transcript is down-regulated by insulin. When insulin levels are high, SREBP-1c mRNA rises, and the Insig-2a transcript declines. The fall in Insig-2a may allow SREBP-1c to be processed even when hepatic cholesterol levels are relatively high.
Materials and Methods
Reagents.
We obtained medium 199 with Earle's salts from Invitrogen; Rat Insulin RIA Kit from Linco Research (St. Charles, MO); Dulbecco's modified Eagle's medium from Mediatech (Herndon, VA); bovine insulin, dexamethasone, triiodothyronine, and Glucose (Trinder) 100 Kit from Sigma; and Teklad mouse/rat diets from Harlan Teklad Premier Laboratory Diets (Madison, WI).
Animals and Treatments.
Male C57BL/6J mice were purchased from The Jackson Laboratory and maintained on Teklad Mouse/Rat Diet no. 7002. Male Sprague–Dawley rats were obtained from Harlan Breeders (Indianapolis) and maintained on Teklad Mouse/Rat Diet no. 7001. Mice and rats were housed in colony cages in 12-h light/12-h dark cycle. All animal experiments were performed with the approval of the Institutional Animal Care and Research Advisory Committee at the University of Texas Southwestern Medical Center. For the fasting and refeeding experiments in mice, the nonfasted group was fed ad libitum, the fasted group was fasted for 12 h, and the refed group was fasted for 12 h and then refed a high-carbohydrate/low-fat diet (catalog no. TD 88122; Harlan Teklad Premier Laboratory Diets) for 12 h before study. Experiments were started in a staggered fashion such that all mice were killed at the same time, which was at the end of the dark cycle.
For the streptozotocin (STZ) experiments, rats were treated with STZ (Sigma) and insulin (Lilly) as described (5) with the following minor modifications. After fasting for 24 h, diabetes was induced by a single i.p. injection of 0.2–0.3 ml of 50 mM sodium citrate solution (pH 4.5) containing STZ (65 mg/kg body weight). Control rats were injected with 50 mM sodium citrate solution (pH 4.5). After injection, animals were further fasted for 24 h, after which plasma glucose levels were checked and diabetes was confirmed (glucose level >250 mg/dl). The animals were then fed a chow diet for 12 h, after which insulin was administered to the STZ + insulin group. The animals received a combination of human regular insulin (3 units) i.p. and human NPH insulin (4 units) s.c., each given in 0.2 ml of PBS. The rats in the control and STZ groups received 0.2 ml of PBS injected both i.p. and s.c. After injection of insulin or PBS, the animals were fed a chow diet for 6 h and then killed by halothane anesthesia.
Primary Rat Hepatocytes.
Primary hepatocytes were prepared from nonfasted male rats (200–220 g) as described (5, 17) with the following minor modifications. After perfusion and collagenase digestion, the dissociated cells were dispersed by shaking and subjected to filtration at 4°C through gauze into an equal volume of ice-cold medium A [Dulbecco's modified Eagle's medium containing 10 mM Hepes (pH 7.4), 5% (vol/vol) FCS, 100 units/ml penicillin, and 100 μg/ml streptomycin]. The cells were pelleted by centrifugation and washed twice at 4°C with ice-cold medium A. Aliquots of cells were plated at 6 × 10⁶ cells per 100-mm rat collagen I-coated dish (Becton Dickinson Labware) in medium B (medium 199 with Earle's salts containing 100 nM triiodothyronine, 100 units/ml penicillin, and 100 μg/ml streptomycin) supplemented with 5% FCS. After incubation at 37°C in 9% CO2 for 4 h, the cells were washed twice with PBS and switched to medium C (medium B containing 100 nM dexamethasone) supplemented with 1 nM insulin. After incubation for 16 h (pretreatment period), the cells were washed twice with PBS and switched to medium C in the absence or presence of insulin as indicated in the legends.
Cloning of cDNAs for Mouse and Rat Insig-2a and -2b.
The 5′ sequences of mouse Insig-2a and -2b were obtained by 5′ rapid amplification of cDNA ends (RACE) using the SMART RACE cDNA Amplification Kit and the Advantage-GC 2 PCR Kit (CLONTECH) with the following pair of outer and inner nested primers: 5′-CCACGTTCACACTCTGGCTGGTGACAGAGG-3′ and 5′-GGCCGAGGTGACTCCGTCTCTCCTTCCGCC-3′. The PCRs were conducted with poly(A)+ RNA from mouse liver and kidney to obtain the Insig-2a and -2b sequences, respectively. To obtain Insig-2 sequences from the rat, we took advantage of previously reported expression sequence tags. The cDNA encoding rat Insig-2 (GenBank accession no. AY152392) was amplified by PCR using total RNA from rat H4-II-E-C3 hepatoma cells (ATCC no. CRL-1600), RNA LA PCR Kit Version 1.1 (Takara), and the following pair of forward and reverse primers: 5′-CCACTGGGAGCCTCATTTCATTTCTCGGC-3′ and 5′-GCTTTCCCATGGCTTCCACACAACAGC-3′. The 5′ sequences of rat Insig-2a and -2b were obtained by 5′-RACE using the following pair of outer and inner nested primers: 5′-CCACGTTCACGCTCTGGCTGGTGACAGAGG-3′ and 5′-GGCCGAGGTGACTCCGTCTCTCCTTCCGCC-3′. Poly(A)+ RNA from rat liver and kidney was used to obtain Insig-2a and -2b cDNAs, respectively. All PCR products were subcloned into the pCRII vector (Invitrogen) and sequenced.
RNase Protection Assay.
A cDNA fragment for mouse Insig-2b was amplified by PCR using a first-strand cDNA from mouse kidney poly(A)+ RNA as a template and the following pair of forward and reverse primers: 5′-AGGTCGGGGGCCGGTCCCTGAAGATGGCGG-3′ and 5′-GGCCGAGGTGACTCCGTCTCTCCTTCCGCC-3′. The amplified fragment, which corresponds to exon-1b (specific to Insig-2b) and part of exon-2 (common to Insig-2a and -2b), was subcloned into the pCRII vector (Invitrogen) and sequenced. After linearization of plasmid DNA with XhoI, antisense RNA was transcribed with [α-32P]CTP (20 mCi/ml; 1 mCi = 37 MBq) and bacteriophage SP6 RNA polymerase (Ambion, Austin, TX) as described (4). Aliquots of total RNA (10 μg) from various mouse tissues were hybridized with the above Insig-2 cRNA probe (4 × 10³ cpm/μl) plus a cRNA probe against 18S RNA (1 × 10³ cpm/μl) by using the HybSpeed RPA Kit (Ambion). After digestion with RNase A/T1, protected fragments were separated on 8 M urea/4.8% polyacrylamide gels, and the gels were dried and exposed to Kodak X-Omat Blue XB-1 films with intensifying screens. Intensities of the protected fragments corresponding to Insig-2a (164 bp) and Insig-2b (237 bp) were quantified by using a Fuji phosphorimager as described (4). For comparison of Insig-2a and -2b mRNA levels in liver, the results were corrected for the difference in number of 32P-labeled CTP residues in each protected fragment (38 and 72, respectively).
Quantitative Real-Time PCR.
The protocol used in this study was identical to that in Liang et al. (18). Briefly, total RNA was prepared from livers of mice and rats and from primary rat hepatocytes by using an RNA STAT-60 Kit (Tel-Test, Friendswood, TX), and treated with DNase I (DNA-free; Ambion). First-strand cDNA was synthesized from DNase I-treated total RNA with random hexamer primers by using the ABI cDNA Synthesis Kit (Applied Biosystems). Synthesized cDNA was subsequently mixed with 2× SYBR Green PCR Master Mix (Applied Biosystems) and various sets of gene-specific forward and reverse primers (Table 1) and subjected to real-time PCR quantification using the ABI PRISM 7900HT Sequence Detection System (Applied Biosystems). All reactions were performed in triplicate. The relative amounts of mRNAs were calculated by using the comparative CT method. As the invariant control, we used mouse 36B4 mRNA, rat 36B4 mRNA, and rat cyclophilin mRNA for the fasting/refeeding experiments, STZ experiments, and the primary rat hepatocyte experiments, respectively.
Table 1.
Nucleotide sequences of gene-specific primers used for quantitative real-time PCR
| Species | mRNA | Sequences of forward and reverse primers (5′ to 3′) | GenBank accession no. |
|---|---|---|---|
| Mus musculus | 36B4 | CACTGGTCTAGGACCCGAGAAG | NM_007475 |
| GGTGCCTCTGGAGATTTTCG | |||
| Insig-1 | TCACAGTGACTGAGCTTCAGCA | AF527630 | |
| TCATCTTCATCACACCCAGGAC | |||
| Insig-2a | CCCTCAATGAATGTACTGAAGGATT | AY156084 | |
| TGTGAAGTGAAGCAGACCAATGT | |||
| Insig-2b | CCGGGCAGAGCTCAGGAT | AY156085 | |
| GAAGCAGACCAATGTTTCAATGG | |||
| Rattus norvegicus | 36B4 | TTCCCACTGGCTGAAAAGGT | NM_007475 |
| CGCAGCCGCAAATGC | |||
| Cyclophilin | CGTGGGCTCCGTTGTCTT | NM_017101 | |
| TGACTTTAGGTCCCTTCTTCTTATCG | |||
| Insig-1 | TGCAGATCCAGCGGAATGT | NM_022392 | |
| CCAGGCGGAGGAGAAGATG | |||
| Insig-2a | GACGGATGTGTTGAAGGATTTCT | AY156086 | |
| TGGACTGAAGCAGACCAATGTC | |||
| Insig-2b | CCGGCAGAGCTCAGGATTT | AY156087 | |
| AACTGTGGACTGAAGCAGACCAA | |||
| Insulin receptor | CTGGAGAACTGCTCGGTCATT | NM_017071 | |
| GGCCATAGACACGGAAAAGAAG | |||
| IRS-2 | CCACACGCCTTTCGCTAGA | Unpublished | |
| GTACCCCCTTCACCAAAGTCAA | |||
| PEPCK | GTCACCATCACTTCCTGGAAGA | AH007109 | |
| GGTGCAGAATCGCGAGTTG | |||
| IGFBP-1 | GATCACTGACCTCAAGAAATGGAA | M89791 | |
| GCGGCACGTAATCTCTCTAACA | |||
| Glucose-6-phosphatase | GACCTCAGGAACGCCTTCTATG | U07993 | |
| ATTGATGCCCACAGTCTCTTGA |
Results
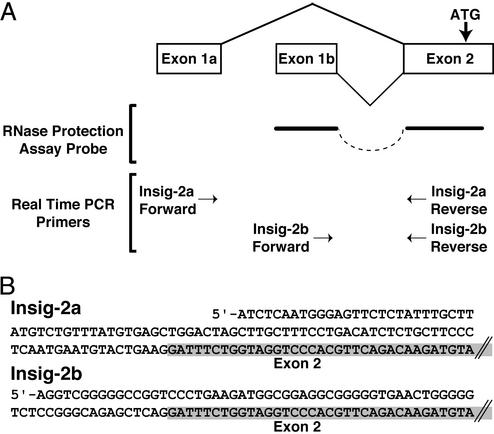
Fig. 1 shows a diagram of the two transcripts from the Insig-2 gene in mouse liver. We discovered these transcripts by using the 5′-RACE technique (see Materials and Methods). These studies revealed two different first exons, both of which splice into a common exon-2, which contains the initiator methionine codon. Exon-1a and exon-1b of Insig-2 do not contain long ORFs. Exon-2 contains an in-frame terminator codon upstream of the initiator methionine codon. Thus, both exon-1a and exon-1b are noncoding exons. Exon-1b corresponds to the previously reported transcript of Insig-2 that was described in cultured Chinese hamster ovary cells (14). Exon-1a lies 5′ to exon-1b in the mouse genome. Hereafter, we designate Insig-2a as the isoform that contains exon-1a. Insig-2b is the isoform that contains exon-1b.
Figure 1.
Alternative sequences at the 5′ end of Insig-2 mRNA from mouse liver. (A) Alternative promoter usage produces two transcripts, Insig-2a and -2b, in which two different first exons (1a and 1b) are spliced to a common exon-2 containing the initiation codon (ATG) for the Insig-2 protein. The positions of the probe used for the RNase protection assay and the primers used for real-time PCR are shown. (B) The nucleotide sequences of the first exons of mouse Insig-2a and -2b are shown together with the partial sequence of the common exon-2, which is shaded.
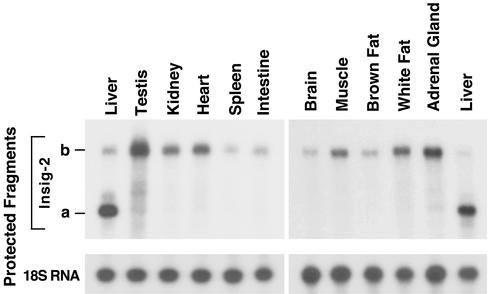
To determine the relative amounts of the Insig-2a and -2b transcripts in various tissues, we used an RNase protection assay (Fig. 2). These studies revealed that Insig-2a is the predominant form of Insig-2 in livers from mice fed ad libitum. No trace of the Insig-2a transcript was found in any of the other 10 organs that were analyzed.
Figure 2.
Expression of Insig-2a and -2b mRNAs in various mouse tissues. Total RNA from the indicated tissues of four C57BL/6J male mice (12 weeks of age) maintained on ad libitum diet was pooled. Aliquots of total RNA (10 μg) were hybridized for 10 min at 68°C to 32P-labeled complementary RNA probes for mouse Insig-2 as described in Materials and Methods. After digestion with RNase A/T1, protected fragments were separated by gel electrophoresis and exposed to film at −80°C for 24 h (Insig-2a and -2b). The Insig-2a in the liver was 11-fold more abundant than Insig-2b.
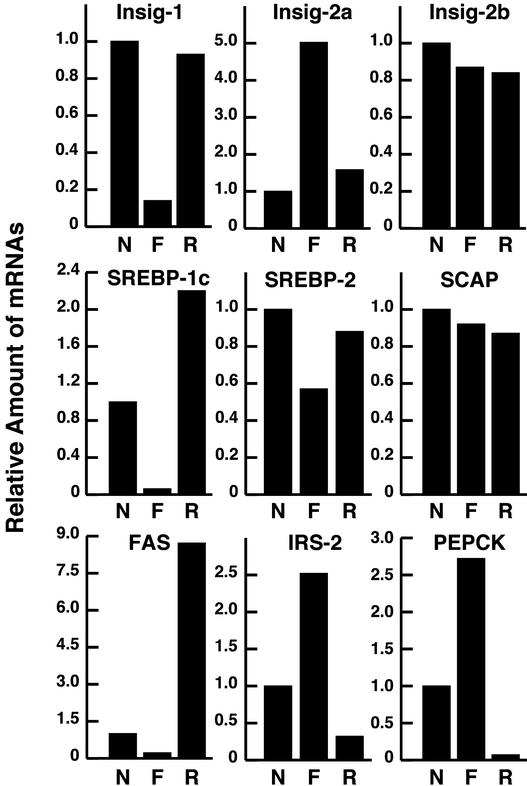
To study the regulation of the two Insig transcripts by insulin, we performed a fasting/refeeding experiment (Fig. 3). Hepatic mRNA levels were measured by quantitative real-time PCR, a technique that allows only relative mRNA measurements. For comparative purposes, the level of each mRNA in the animals fed ad libitum was designated as 1. The Insig-1 mRNA fell dramatically upon fasting and was restored by refeeding. We believe that the decline was caused by the marked decline in SREBP-1c and the similar decline in SREBP-2 that also occurred upon fasting. The levels of Insig-2a were regulated reciprocally with those of Insig-1. Thus, the amount of Insig-2a mRNA rose 5-fold upon fasting and declined to basal values upon refeeding. Insig-2b, which is much less abundant than Insig-2a in the animal fed ad libitum, did not change after fasting or refeeding. SCAP mRNA levels did not change with these manipulations. The amount of fatty acid synthase (FAS) mRNA was regulated in parallel with SREBP-1c mRNA. The FAS mRNA fell during fasting and showed a marked overshoot during refeeding. For comparative purposes, we show the levels of mRNA for two genes that are known to be repressed by insulin. These are IRS-2 (7) and PEPCK (19). Both of these mRNAs rose when insulin levels were suppressed by fasting, and both of them were suppressed when insulin rose after refeeding.
Figure 3.
Reciprocal changes of Insig-2a and Insig-1 in livers of mice subjected to fasting and refeeding. Wild-type mice were subjected to a fasting and refeeding protocol, and total RNA from livers of four C57BL/6J male mice (12 weeks of age) was pooled and subjected to real-time PCR quantification as described in Materials and Methods. The nonfasted group (N) was maintained on ad libitum diet, the fasted group (F) was fasted 12 h, and the refed group (R) was fasted for 12 h and then refed a high-carbohydrate/low-fat diet for 12 h before study. Each value for the fasted and refed groups represents the amount of mRNA relative to that of the nonfasted group, which is arbitrarily defined as 1. FAS, fatty acid synthase. Values for plasma glucose and plasma insulin (mean ± SE) in the three groups of mice were as follows: nonfasted, 174 ± 14 mg/dl and 1.3 ± 0.7 ng/ml; fasted, 98 ± 13 mg/dl and 0.15 ± 0.01 ng/ml; and refed, 188 ± 10 mg/dl and 11 ± 1.2 ng/ml.
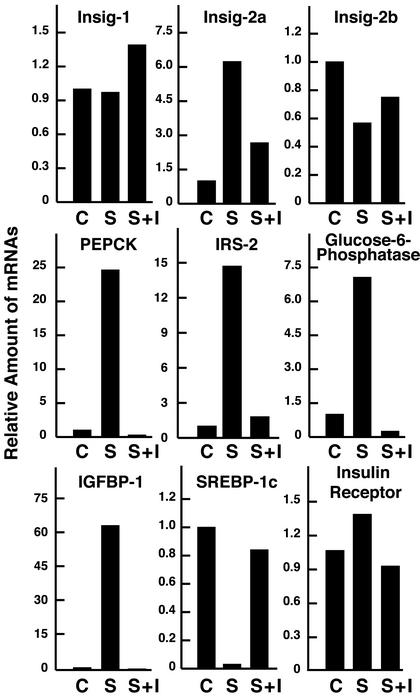
The results of Fig. 3 suggested strongly that Insig-2a belongs to the family of genes whose mRNAs are suppressed by insulin. To test this hypothesis in another way, we rendered rats insulin deficient by treating them with STZ, a toxin that destroys the insulin-secreting beta cells of the pancreas (20). Some of the STZ-treated animals were injected with insulin. As shown in Fig. 4, the level of mRNAs for Insig-1 and -2b changed only slightly during these manipulations. In marked contrast, the Insig-2a mRNA rose 6-fold upon STZ treatment and was repressed with insulin. This change was in the same direction, although not as profound, as the changes in four classic insulin-repressed genes, namely, PEPCK, glucose-6-phosphatase, IGFBP-1, and IRS-2 (7, 19, 21). In contrast, SREBP-1c mRNA levels fell dramatically upon STZ treatment and rose when insulin was injected. As a control, we measured the mRNA for the insulin receptor, which is not affected by insulin deprivation or restoration.
Figure 4.
Changes in Insig-2a mRNA in livers of control rats and rats treated with STZ without or with insulin. Male Sprague–Dawley rats were treated with STZ for 36 h and then injected with insulin or vehicle for 6 h as described in Materials and Methods. Total RNAs isolated from livers of three male rats were pooled and subjected to real-time PCR quantification as described in Materials and Methods. Each value for the STZ-treated diabetic group (S) and STZ-treated diabetic group supplemented with insulin (S+I) represents the amount of mRNA relative to that of the control group (C). Values for plasma glucose (mean ± SE) in the three groups of rats were as follows: control group, 154 ± 2.5 mg/dl; STZ-treated group, 631 ± 26 mg/dl; STZ-treated group supplemented with insulin, 206 ± 47 mg/dl.
To demonstrate direct control of Insig-2a mRNA levels by insulin, we turned to primary rat hepatocytes. These cells were isolated from rat livers by collagenase digestion and incubated in Petri dishes for 16 h in the presence of a low basal level of insulin (1 nM). Thereafter, the cells were incubated for 12 h with high insulin (100 nM) or no insulin. The levels of various mRNAs were measured by quantitative real-time PCR, and the results are shown in Table 2. In the insulin-treated cells, the level of Insig-2a mRNA was reduced by >90%. Insulin did not repress the mRNA for Insig-1 or -2b. As expected, insulin repressed IRS-2, PEPCK, IGFBP-1, and glucose-6-phosphatase. It did not affect the mRNA for the insulin receptor.
Table 2.
Relative amounts of mRNAs in primary rat hepatocytes
| mRNA | Relative expression
|
|
|---|---|---|
| −Insulin | +Insulin | |
| Cyclophilin | 1 | 1 |
| Insulin receptor | 1 | 1.1 |
| Insig-1 | 1 | 2.3 |
| Insig-2a | 1 | 0.08 |
| Insig-2b | 1 | 1.1 |
| IRS-2 | 1 | 0.23 |
| PEPCK | 1 | 0.01 |
| IGFBP-1 | 1 | 0.11 |
| Glucose-6-phosphatase | 1 | 0.01 |
After pretreatment for 16 h with 1 nM insulin as described in Materials and Methods, hepatocytes were switched to medium C supplemented with or without 100 nM insulin as indicated. After incubation for 12 h, total RNA was prepared from duplicate dishes, pooled, and subjected to real-time PCR quantification. Values shown represent the amount of mRNA relative to that in the absence of 100 nM insulin, which is arbitrarily defined as 1.
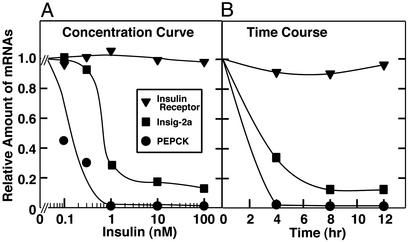
Fig. 5 shows the suppression of Insig-2a mRNA in rat hepatocytes as a function of the concentration of insulin (Fig. 5A) or time of incubation with insulin (Fig. 5B). For comparative purposes, we show the insulin-mediated suppression of PEPCK. Suppression of Insig-2a was maximal at insulin concentrations between 1 and 10 nM, which are similar to the concentrations required to suppress PEPCK. Insulin-mediated suppression of Insig-2a mRNA was significant at 4 h and maximal at 8 h. The effect of insulin on Insig-2a, although marked, was not as great as the near-total suppression of PEPCK mRNA.
Figure 5.
Insulin-mediated suppression of Insig-2a mRNA in primary rat hepatocytes. After pretreatment for 16 h with 1 nM insulin as described in Materials and Methods, cells were incubated for 12 h in the absence or presence of the indicated concentration of insulin (A) or for the indicated time in the presence of 100 nM insulin (B). Additions of insulin were made in a staggered fashion such that all samples were harvested at the same time. Total RNA was prepared from duplicate dishes, pooled, and subjected to real-time PCR quantification as described in Materials and Methods.
Discussion
The current results reveal a previously unsuspected liver-specific transcript of the Insig-2 gene that is specifically down-regulated by insulin. Inasmuch as Insig-2 participates in the sterol-mediated feedback inhibition of SREBP processing (14), these experiments provide a potential mechanism by which insulin can increase the nuclear content of SREBPs, thereby stimulating fatty acid biosynthesis.
The current findings may explain a paradox that was inherent in previous studies of SREBP activity in liver. Insulin stimulates SREBP-1c gene transcription (5–7), and this leads directly to an increase in the SREBP-1c precursor. To stimulate fatty acid synthesis, this precursor must be processed to the nuclear form, even under conditions in which hepatic cholesterol levels are high. Why doesn't the excess cholesterol block the processing of the insulin-induced SREBP-1c? It is possible that SREBP-1c continues to be processed because insulin has repressed the Insig-2a mRNA, leading to a decrease in Insig-2 protein. The residual Insig-1 protein may be insufficient to block the processing of SREBP-1c. To test this hypothesis, we are preparing transgenic mice that overexpress Insig-2 in liver under control of a constitutive promoter. If the above hypothesis is correct, then these animals should fail to show an increase in nuclear SREBP-1c and in the fatty acid biosynthetic mRNAs under conditions in which hepatic cholesterol levels are high.
The mechanism by which insulin selectively down-regulates the Insig-2a mRNA is likely to be transcriptional. The Insig-2a and -2b transcripts differ only in the first exon. These exons are ≈4.8 kb apart in the mouse genome, and they likely use separate promoter/enhancers. It is likely that the Insig-2a promoter is selectively sensitive to insulin. For technical reasons, we have been unable to test directly the hypothesis that insulin represses transcription from the Insig-2a promoter. For this purpose, we prepared reporter gene constructs driven by the 5′-flanking region of the Insig-2a gene and tested them in liver cell lines and primary rat hepatocytes. To date, we have not yet found a hepatic cell line that can be transfected efficiently and also responds to insulin.
The importance of the insulin-regulated Insig-2a transcript is emphasized by the finding of alternative exons-1a and -1b in the Insig-2 gene in the genomes of rats, mice, and humans. Even though exons-1a and -1b are noncoding, their nucleotide sequences are conserved between humans and mice (55% and 50% identical, respectively).
Acknowledgments
We thank Richard Gibson and Samantha Galloway for invaluable help with animal care; Jeff Cormier and Melody Kerr for DNA sequencing and real-time PCR; and Debra Morgan and Tammy Dinh for excellent technical assistance. We also thank our colleagues Jiafu Ou and Yuriy Bashmakov for helpful comments on the STZ experiments, and Jay Horton for critical review of the manuscript. This work was supported by research grants from the National Institutes of Health (HL20948), the Perot Family Foundation, the Moss Heart Fund, and the W. M. Keck Foundation.
Abbreviations
- ER
endoplasmic reticulum
- FAS
fatty acid synthase
- IGFBP-1
insulin-like growth factor-binding protein 1
- IRS-2
insulin receptor substrate 2
- PEPCK
phosphoenolpyruvate carboxykinase
- SCAP
SREBP, cleavage-activating protein
- SREBP
sterol regulatory element-binding protein
- STZ
streptozotocin
Footnotes
References
- 1.Brown M S, Goldstein J L. Proc Natl Acad Sci USA. 1999;96:11041–11048. doi: 10.1073/pnas.96.20.11041. [DOI] [PMC free article] [PubMed] [Google Scholar]
- 2.Goldstein J L, Rawson R B, Brown M S. Arch Biochem Biophys. 2002;397:139–148. doi: 10.1006/abbi.2001.2615. [DOI] [PubMed] [Google Scholar]
- 3.Horton J D, Goldstein J L, Brown M S. J Clin Invest. 2002;109:1125–1131. doi: 10.1172/JCI15593. [DOI] [PMC free article] [PubMed] [Google Scholar]
- 4.Shimomura I, Shimano H, Horton J D, Goldstein J L, Brown M S. J Clin Invest. 1997;99:838–845. doi: 10.1172/JCI119247. [DOI] [PMC free article] [PubMed] [Google Scholar]
- 5.Shimomura I, Bashmakov Y, Ikemoto S, Horton J D, Brown M S, Goldstein J L. Proc Natl Acad Sci USA. 1999;96:13656–13661. doi: 10.1073/pnas.96.24.13656. [DOI] [PMC free article] [PubMed] [Google Scholar]
- 6.Shimomura I, Matsuda M, Hammer R E, Bashmakov Y, Brown M S, Goldstein J L. Mol Cell. 2000;6:77–86. [PubMed] [Google Scholar]
- 7.Zhang J, Ou J, Bashmakov Y, Horton J D, Brown M S, Goldstein J L. Proc Natl Acad Sci USA. 2001;98:3756–3761. doi: 10.1073/pnas.071054598. [DOI] [PMC free article] [PubMed] [Google Scholar]
- 8.Repa J J, Liang G, Ou J, Bashmakov Y, Lobaccaro J-M A, Shimomura I, Shan B, Brown M S, Goldstein J L, Mangelsdorf D J. Genes Dev. 2000;14:2819–2830. doi: 10.1101/gad.844900. [DOI] [PMC free article] [PubMed] [Google Scholar]
- 9.Schultz J R, Tu H, Luk A, Repa J J, Medina J C, Li L, Schwendner S, Wang S, Thoolen M, Mangelsdorf D J, et al. Genes Dev. 2000;14:2831–2838. doi: 10.1101/gad.850400. [DOI] [PMC free article] [PubMed] [Google Scholar]
- 10.DeBose-Boyd R A, Ou J, Goldstein J L, Brown M S. Proc Natl Acad Sci USA. 2001;98:1477–1482. doi: 10.1073/pnas.98.4.1477. [DOI] [PMC free article] [PubMed] [Google Scholar]
- 11.Ou J, Tu H, Shan B, Luk A, DeBose-Boyd R A, Bashmakov Y, Goldstein J L, Brown M S. Proc Natl Acad Sci USA. 2001;98:6027–6032. doi: 10.1073/pnas.111138698. [DOI] [PMC free article] [PubMed] [Google Scholar]
- 12.Hua X, Nohturfft A, Goldstein J L, Brown M S. Cell. 1996;87:415–426. doi: 10.1016/s0092-8674(00)81362-8. [DOI] [PubMed] [Google Scholar]
- 13.Yang T, Espenshade P J, Wright M E, Yabe D, Gong Y, Aebersold R, Goldstein J L, Brown M S. Cell. 2002;110:489–500. doi: 10.1016/s0092-8674(02)00872-3. [DOI] [PubMed] [Google Scholar]
- 14.Yabe D, Brown M S, Goldstein J L. Proc Natl Acad Sci USA. 2002;99:12753–12758. doi: 10.1073/pnas.162488899. [DOI] [PMC free article] [PubMed] [Google Scholar]
- 15.Janowski B A. Proc Natl Acad Sci USA. 2002;99:12675–12680. doi: 10.1073/pnas.202471599. [DOI] [PMC free article] [PubMed] [Google Scholar]
- 16.Nohturfft A, Yabe D, Goldstein J L, Brown M S, Espenshade P J. Cell. 2000;102:315–323. doi: 10.1016/s0092-8674(00)00037-4. [DOI] [PubMed] [Google Scholar]
- 17.Berry M N, Friend D S. J Cell Biol. 1969;43:506–520. doi: 10.1083/jcb.43.3.506. [DOI] [PMC free article] [PubMed] [Google Scholar]
- 18.Liang G, Yang J, Horton J D, Hammer R E, Goldstein J L, Brown M S. J Biol Chem. 2002;277:9520–9528. doi: 10.1074/jbc.M111421200. [DOI] [PubMed] [Google Scholar]
- 19.Hall R K, Yamasaki T, Kucera T, Waltner-Law M, O'Brien R, Granner D K. J Biol Chem. 2000;275:30169–30175. doi: 10.1074/jbc.M004898200. [DOI] [PubMed] [Google Scholar]
- 20.Lakshmanan M R, Nepokroeff C M, Porter J W. Proc Natl Acad Sci USA. 1972;69:3516–3519. doi: 10.1073/pnas.69.12.3516. [DOI] [PMC free article] [PubMed] [Google Scholar]
- 21.O'Brien R M, Streeper R S, Ayala J E, Stadelmaier B T, Hornbuckle L A. Biochem Soc Trans. 2001;29:552–558. doi: 10.1042/bst0290552. [DOI] [PubMed] [Google Scholar]
- 22.Yang J, Goldstein J L, Hammer R E, Moon Y-A, Brown M S, Horton J D. Proc Natl Acad Sci USA. 2001;98:13607–13612. doi: 10.1073/pnas.201524598. [DOI] [PMC free article] [PubMed] [Google Scholar]


