Abstract
Atomic detailed structural study of a transiently existing folding intermediate is severely limited because of its short life. In ubiquitin, we found that a pressure-stabilized equilibrium conformer shares a common structural feature with the proline-trapped kinetic intermediate found in a pulse-labeling 1H/2H exchange NMR study [Briggs, M. S. & Roder, H. (1992) Proc. Natl. Acad. Sci. USA 89, 2017–2021]. The conformer is locally unfolded in the entire segment from residues 33 to 42 and in C-terminal residues 70–76. The close structural identity of an equilibrium intermediate stabilized under pressure with a transiently observed folding intermediate is likely to be general in terms of a folding funnel common to both experiments.
Ubiquitin, consisting of only 76 amino acid residues (8.6 kDa) with no disulfide bonds, is a signaling protein for an ATP-dependent protein degradation but also for other cellular processes (1). The basic folded structure of ubiquitin has been determined by X-ray crystallography (2) and NMR analysis (3–5). The ubiquitin fold, consisting of a four-stranded, anti-parallel β-sheet and two short helices, is widely found in many proteins (6). Our previous NMR investigation, carried out on uniformly 15N-labeled ubiquitin in the pressure range between 1 and 3,500 bar (1 bar = 100 kPa) at pH 4.5 at 20°C, indicated that folded ubiquitin consists of two major conformers mutually interconverting with lifetimes of much less than ms (7): first, the well known conformer N1 has a rigid C-terminal backbone up to residue 72, and second, the conformer N2 has an increased freedom of motion for C-terminal residues 70–76 (7).
In the present work, we extend our high pressure 15N/1H heteronuclear single-quantum coherence (HSQC) NMR experiments under equilibrium conditions to 0°C at pH 4.5 in the pressure range between 30 and 3,700 bar. Lowering the temperature substantially increased the pressure effect on ubiquitin and allowed conformational search of ubiquitin from the native to the totally unfolded conformer. We detected a series of higher energy conformers of ubiquitin, whose partial molar volumes decrease in parallel with the loss of its conformational order, in accordance with the postulated volume theorem of a globular protein (8). In particular, a unique, locally unfolded conformer was detected, whose structure is nearly identical with that of the kinetically trapped folding intermediate found earlier in a guadinium chloride concentration-jump experiment (9). Generality of close structural identity of a pressure-trapped intermediate with a kinetic folding intermediate is discussed.
Materials and Methods
NMR Sample.
Uniformly 15N-labeled ubiquitin (VLI, Malvern, PA) was dissolved in 30 mM acetate buffer (pH 4.5 at 20°C) containing 5% 2H2O, resulting in a protein concentration of 2.0 mM.
High-Pressure NMR Measurements.
High-pressure NMR experiments were performed on a DMX-750 spectrometer (Bruker) by using the on-line cell high-pressure NMR technique (10) equipped with a pressure-resistive quartz cell (11). 15N/1H HSQC spectra were measured with a standard HSQC sequence (12) combined with a WATERGATE technique with a 3-9-19 pulsed field gradient (13) at a 1H-frequency of 750.13 MHz and a 15N-frequency of 76.01 MHz. The 15N dimension was acquired with 256 increments, and for the 1H dimension, 2,048 complex points were collected with an offset at the residual water signal. Data were processed with the XWIN-NMR package (Bruker) and NMRPIPE running on a Silicon Graphics O2 workstation. Spectra were zero-filled to give a final matrix of 4,096 × 512 real data points and apodized with a 90° shifted sine-bell window function in both dimensions.
Thermodynamic Analysis.
The Gibbs free-energy difference (ΔG) between any two conformers is given by Eq. 1 as a function of pressure p at constant temperature
 |
1 |
Here R is the gas constant, T is the absolute temperature, K is the observed equilibrium constant, ΔG and ΔG0 are the Gibbs free-energy difference at pressure p and p0 (= 1 bar), respectively, and Δκ is the compressibility difference. The equilibrium constant K is determined directly from the ratio of the integral volumes of crosspeaks between different conformational species giving the 15N/1H HSQC spectrum.
Results and Discussion
Reversible Spectral Changes Between 30 and 3,700 Bar at 0°C and the Conformational Equilibrium.
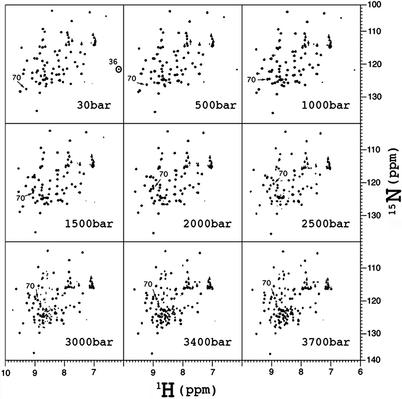
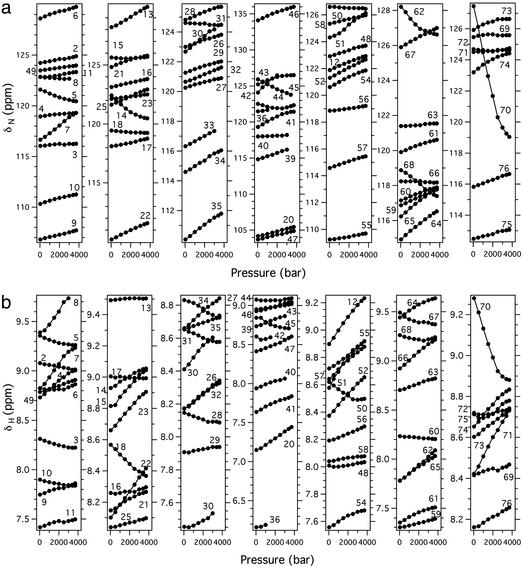
15N/1H two-dimensional HSQC spectra were measured at various pressures between 30 and 3,700 bar at 0°C and pH 4.5 (Fig. 1). All of the observed 70 crosspeaks from this 76-residue protein showed reversible changes in their chemical shifts. Most 15N and 1H signals exhibit large pressure shifts, many of which are distinctly nonlinear with pressure. In particular, a sigmoidal 15N shift by 7.98 ppm at 3,700 bar is noted for Val-70 (Fig. 2). The pressure responses of chemical shifts at 0°C are almost identical with those at 20°C reported in our recent work (7), showing that the same conformational equilibrium between the primary folded conformer (N1) and the secondary folded conformer (N2) as that at 20°C exists at 0°C.
Figure 1.
15N/1H HSQC spectra of 15N uniformly labeled ubiquitin at various pressures from 30 to 3,700 bar at 0°C. The protein is dissolved to a concentration of 2.0 mM in 30 mM acetate buffer (95% 1H2O/5% 2H2O, pH 4.5). Chemical shifts of individual crosspeaks from the folded part of the protein at 30 bar were identical with those at 1 bar, which had been assigned to specific amino acid residues by Wang et al. (30). Crosspeak of Ile-36 showing preferential broadening below 1,500 bar is encircled. The crosspeak of Val-70 is marked with an arrow.
Figure 2.
Plots of 15N (a) and 1H (b) chemical shifts of individual main-chain amide groups of ubiquitin as a function of pressure between 30 and 3,700 bar at 0°C. Numbers denote residue numbers.
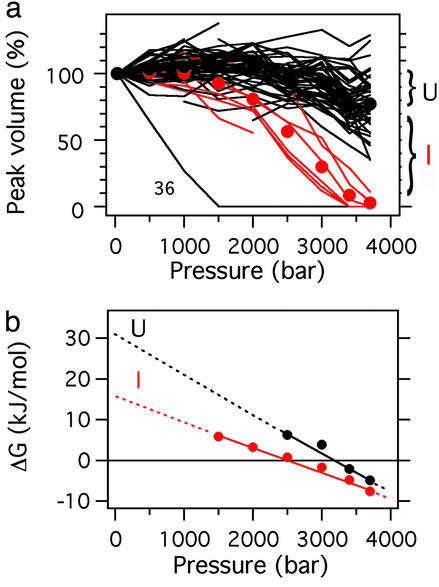
In addition, reversible changes in crosspeak intensities were observed with further increase in pressure. Interestingly, crosspeak intensities of residues 8, 33, 35, 36, and 39–42 of the folded conformers were preferentially reduced above ≈2,000 bar and became almost null at 3,700 bar (red lines in Fig. 3a), whereas the intensities of the rest of the crosspeaks were only slightly reduced (an average of ≈80% of the original value; black lines in Fig. 3a), even at 3,700 bar. Concomitantly with the decrease of these “folded” crosspeaks, new crosspeaks appeared at 2,000 bar in the narrow spectral region (1H: 8.3–9.0 ppm, 15N: 110–130 ppm), which is typical for a disordered and mobile polypeptide chain, thus increasing their number to >50 at 3,700 bar. During the process, the total volume of all of the crosspeaks in the spectrum remained nearly constant, indicating that the new crosspeaks arise at the expense of the original crosspeaks of the folded conformers. These results indicate that at 0°C, a local unfolding takes place preferentially for the residues from 33 to 42 above 2,000 bar (designated by conformer I), and finally at 3,700 bar, a cooperative unfolding of the entire polypeptide chain (designated by conformer U) begins to occur. The intensity of the high-field shifted side-chain methyl proton signals (e.g., Leu-50 CδH3 peak at −0.2 ppm spectra not shown) also decreased above ≈3,000 bar, indicating the collapse of the hydrophobic core in the final stage of unfolding, as expected. A pressure effect higher at 0°C than at 20°C is considered to arise from a lower stability at lower temperature (an increased tendency for cold denaturation), as well as from the decrease in partial molar volume of the unfolded state at lower temperature (14).
Figure 3.
(a) Plots of the peak volumes (normalized to that at 30 bar) of all observable “native” signals in 15N/1H HSQC spectra against pressure (data were obtained at 30, 500, 1,000, 1,500, 2,000, 1,500, 3,000, 3,400, and 3,700 bar). At each pressure, corrections were made for the crosspeak intensities for the increase in the effective protein concentration by the pressure-induced compaction of the solvent water (for example, ≈12% by 3,700 bar at 0°C; ref. 31). The unfolding transition curves are classified into two groups: one is a rapidly decaying minor group (red, residues 8, 33, 35, and 39–42), and the other is a slowly decaying major group (black, the rest), excluding the transition curve of Ile-36. The fractional decrease in the intensity of the slowly decaying group, averaged over all relevant crosspeaks (black spheres), represents the fraction of U, the difference between this and the rapidly decaying fraction, averaged over all relevant crosspeaks (red spheres), represents the fraction of I, and the rest represents the fraction of the folded conformers (N = N1 + N2). (b) Plots of ΔGI−N and ΔGU−N against pressure. The thermodynamic parameters, ΔG0 and ΔV0 are obtained by least-squares fit of K to Eq. 1 under the assumption Δκ = 0 (by neglecting the quadratic term on p). Extrapolation to 1 bar yields the standard Gibbs free-energy differences (ΔG0 at 1 bar and 0°C) of 15.2 kJ/mol between N and I and 31.3 kJ/mol between N and U. The slopes give ΔV0I−N = −58 ml/mol and ΔV0U−N = −85 ml/mol.
By combining the result of the previous investigation at 20°C and the present result at 0°C, we conclude that ubiquitin exists at 0°C and pH 4.5 not only as a rapid (τ < ms) equilibrium between the two major folded conformers N1 and N2, as reported (7), but also as a slow (τ > ms) equilibrium involving locally unfolded conformer I and a fully unfolded conformer U: N1, N2, I, and U coexist at all pressures. The slowly exchanging conformers such as I and U that are present in minor fractions under physiological conditions are normally neglected in conventional NMR spectroscopy. However, they could be decisively important in function, as will be discussed later.
Thermodynamic Stability and Partial Molar Volume of I and U.
At each pressure, one can estimate fractions of conformers I and U based on measurements of HSQC crosspeak intensities (volume integrals) of the folded conformer, from which one can calculate equilibrium constants and Gibbs energy changes from N to I and from N to U as a function of pressure (Fig. 3b). Linear extrapolation of ΔG to 1 bar at 0°C by assuming zero compressibility change Δκ in Eq. 1 in Materials and Methods gives 15.2 ± 1.0 kJ/mol for ΔG0I−N (red) and 31.3 ± 4.7 kJ/mol for ΔG0U−N (black; Fig. 3b), with −58 ± 4 ml/mol and −27 ± 10 ml/mol for the partial molar volume changes for the transitions from N to I and from I to U, respectively. Gibbs energy changes upon thermal and guanidium chloride-induced unfolding reported in the literature (15) are 20–30 kJ/mol for bovine ubiquitin (having the same amino acid sequence with human ubiquitin), measured at 25°C and in a wide pH range from 1.8 to 4.3. These values are comparable to our ΔG0U−N (31.3 ± 4.7 kJ/mol) at pH 4.5 and 0°C. From the ΔG0I−N and ΔG0U−N values (15.2 ± 1.0 kJ/mol and 31.3 ± 4.7 kJ/mol, respectively), conformers I and U are predicted to be present at populations on the order of ≈0.1% and ≈10−4%, respectively, at 1 bar at pH 4.5 and 0°C. These estimates are to be taken only as measures of population, in view of the relatively long extrapolations involved (Fig. 3b). The populations of folded conformers N1 and N2 were previously estimated to be ≈85% and ≈15%, respectively (ref. 7; determined at pH 4.5 and 20°C), and would remain nearly the same at 0°C.
The volume decrease from N to I (ΔV0I−N = −58 ml/mol) accounts for as much as 70% of the total volume change from N to U (ΔV0U−N = −85 ± 7 ml/mol), even though the former involves melting of less than a quarter of the polypeptide chain. The estimated volume change (−58 ml/mol) may partly include the volume change from N1 to N2 (−24 ml/mol, determined at 20°C; ref. 7). It is intriguing to find that the total volume change from N to U (ΔV0U−N = −85 ml/mol) is comparable to the total volume of the internal cavities calculated with the program GRASP (80 ml/mol with a probe of 1.0 Å; ref. 16). Furthermore, we note that the experimentally determined partial molar volume of ubiquitin decreases in the order of the decreasing conformational order, namely N1 > N2 > I > U. Along with the similar trend in other globular proteins (17–20), the result clearly supports the volume theorem of protein, which can be stated as “partial molar volume of a protein decreases in parallel with the decrease of its conformational order” (8).
Structure of the Locally Unfolded Conformer I and Its Functional Importance.
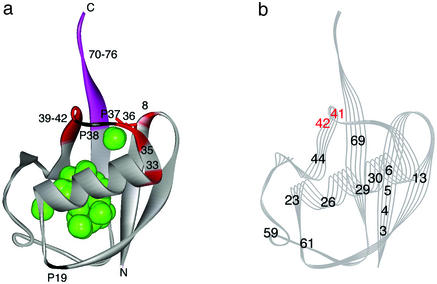
The intermediate conformer I shows a preferential unfolding of the segment between residues 33 and 42, including Pro-37 and Pro-38, accompanied by a large volume decrease (ΔVI–N = −58 ± 4 ml/mol). Furthermore, the anomalous change in 15N chemical shift of Val-70, 7.98 ppm at 3,700 bar, reflects considerable changes in the backbone torsion angles (ψ and φ), as discussed (7), and suggests that the entire segment for residues 70–76 is unfolded in addition to residues 33–42 in conformer I. The local unfolding of the polypeptide chain must accompany disruptions of hydrogen bonds formed in the region, namely that the hydrogen bonds between Arg-42 C = O and Val-70 NH, between Arg-42 NH and Val-70 C = O and between Gln-40 C = O and Arg-72 NH must be broken in I. This means the collapse of a part of the β-sheet between β3-strand (Gln-40-Phe-45) and β5-strand (Glu-64-Arg-72). The structure of I is drawn qualitatively on the basic folded structure (N1) by coloring the preferentially unfolded segment (residues 8, 33, 35, 36, and 39–42) in red (Fig. 4a). The green spheres depict locations of cavities with a probe radius of 1.0 Å found in N1. Several cavities are clustered in the core part of the protein, and, in addition, one isolated cavity is found at the C-terminal side of the protein.
Figure 4.
(a) A qualitative presentation of the structure of the pressure-stabilized equilibrium intermediate I, based on 15N/1H HSQC crosspeak intensities of individual amide groups. The intensities of residues 8, 33, 35, 36, and 39–42 (red) are preferentially decreased above 2,000 bar at pH 4.5 at 0°C, showing local unfolding, whereas the rest of the molecule (gray) remains folded. The particularly labile residue Ile-36 is represented by a red stick. The C-terminal residues (70–76; purple-colored) are intrinsically disordered. The positions of all Pro residues (19, 37, and 38) are marked. Green spheres show cavities calculated with the program grasp (16) with a probe radius of 1.0 Å. (b) A qualitative presentation of the structure of the slow folding intermediate of ubiquitin, based on the results of a pulse-labeling 1H/2H exchange NMR experiment at pH 5.0 at 25°C by Briggs and Roder (9). The only residues for which 1H/2H exchange rates could be evaluated are numbered. The black-numbered residues are folded very quickly (within ≈10 ms), whereas the red-numbered residues (Gln-41 and Arg-42) remain unfolded for as long as ≈10 s, because of the slow transformation of a cis conformer of Pro-37 and/or Pro-38 peptide bond into trans (9). The figures are drawn with WebLab VIEWERLITE 3.2, based on the three-dimensional crystal structure of human ubiquitin (PDB ID code 1UBQ; ref. 2).
The freeing of the C-terminal β5-strand from residue 70 up with the local unfolding in the region between residues 33 and 42 in conformer I indicates that the entire region of the protein close to the reactive-site C-terminal region is disordered. The NMR chemical-shift perturbation experiment (21) upon binding of ubiquitin with human ubiquitin-conjugating-enzyme (HsUbc2b) showed that many residues located at the C-terminal side of the protein, namely, residues 7–9, 36, 40–46, 48, 49, and 70–76, are affected. Also, the docking simulation of ubiquitin onto the ubiquitin-conjugating enzyme (Mms2/Ubc13) suggested the importance of the residues at the C-terminal side of ubiquitin for the binding (22). The coincidence of the estimated enzyme-binding regions with the disordered regions of conformer I suggests that conformer I is a functional form of ubiquitin with its disordered segments designed to facilitate its binding with enzymes. The free energy change ΔG0I−N = 15.2 ± 1.0 kJ/mol could easily be balanced by the free-energy change associated with binding to an enzyme.
Close Identity of the Kinetic Intermediate with an Equilibrium Intermediate Stabilized by Pressure.
Earlier, Briggs and Roder (9) studied the folding reaction of ubiquitin by using a pulse-labeling 1H/2H exchange NMR technique upon dilution of guadinium chloride solution from 6 M to 1 M at pH 5.0 at 25°C. They found parallel folding pathways, a rapid folding (≈10 ms) major pathway, and a slow folding (≈10 s) minor pathway. In the latter process, monitored at Gln-41 and Arg-42, an intermediately folded species (Fig. 4b) is trapped with a cis conformer of Pro-37 and/or Pro-38 peptide bond(s) that slowly (≈10 s) turns into a trans conformer (9). We note that conformer I found in the present study shares a similar structural character with the cis-trapped kinetic intermediate, which is disordered in the segment involving residues 41 and 42 and Pro-37 and Pro-38. Although the hydrogen exchange experiment gives no direct information on the rest of the segment (residues 33–40), the structural feature of the kinetic intermediate with a cis conformer of Pro-37 and/or Pro-38 peptide bond(s) requires that a fairly extended region of the polypeptide chain be disordered, which is consistent with a close identity of this kinetic intermediate with the equilibrium conformer I trapped under pressure.
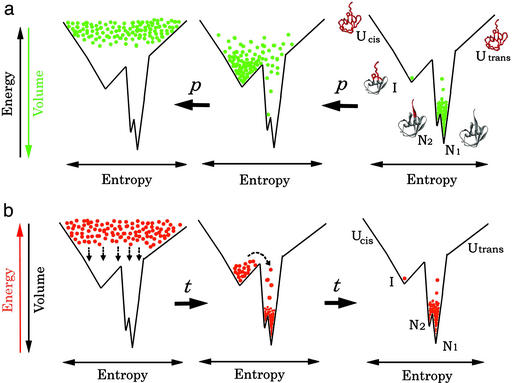
Fig. 5 shows schematically a folding funnel representing the entire conformational space of ubiquitin at pH 4.5 and 20°C. The vertical axis of the funnel represents the solvent-averaged energy of a ubiquitin molecule (increasing upwards), which is considered parallel with the conformational order of the polypeptide chain (increasing downwards), and the horizontal scale represents the conformational entropy (23). Conformers N1, N2, I, and U are placed on the funnel according to their conformational order (or native-like contacts; ref. 23), which turns out to be parallel with their thermodynamic stability (ΔG0) relative to the basic native state N1. An important observation is that the partial molar volume (V0) is also parallel with the vertical axis, decreasing in the order N1 > N2 > I > U, as expected from the volume theorem (8). Thus, by increasing pressure, one can increasingly populate higher energy conformers N2, I, and then U by decreasing ΔG through the ΔV0(p − p0) term in Eq. 1.
Figure 5.
The concept of the equilibrium pressure experiment (a) vs. the concept of the kinetic folding experiment (b), carried out under closely identical solution conditions. The vertical axis of the funnel represents the internal energy of a hydrated protein molecule (increasing upwards), i.e., a free energy of a single protein molecule, parallel to the conformational order of a polypeptide chain (increasing downwards). The horizontal scale represents conformational entropy. The density of dots at each position in the funnel represents either the equilibrium population of the protein molecule under pressure or a transiently occupying population at a certain time after commencement of the folding experiment. Protein structures are drawn with WebLab VIEWERLITE 3.2, with the red color representing highly disordered segments.
A kinetic folding experiment is initiated by suddenly placing the entire ensemble of protein molecules on the top of the folding funnel determined under the condition for folding (Fig. 5b Left; ref. 24). Then, the folding process is essentially a process of redistributing the ensembles over the entire funnel until a thermal equilibrium, determined by a Boltzmann factor exp (−ΔG0/RT), is reached. Here, ΔG0 is the free-energy difference between the bottom of the funnel and any state above. During this process, a good population of a kinetic intermediate may be trapped transiently in a local free-energy minimum and may be detected by a method such as pulse-labeling 1H/2H exchange. In the case of ubiquitin, a proline-cis-trapped intermediate was found to be transiently populated (Fig. 5b Center) before it is thermally equilibrated (Fig. 5b Right).
The equilibrium study with pressure as perturbation, performed under the same solution condition as in the kinetic experiment, generally starts with the equilibrium distribution at 1 bar (Fig. 5a Right). As a protein in solution generally exists in a mixture of conformers differing in partial molar volume, application of pressure redistributes their population in favor of lower volume conformers mainly through the ΔV0(p − p0) term in Eq. 1 (25). Within a range of a relative low pressure (< a few kbar), increasing pressure populates fewer and fewer ordered conformers according to the volume theorem, reaching a population distribution far beyond the original Boltzmann distribution. For ubiquitin, at 2,000–3,000 bar, conformer I must be most populated (Fig. 5a Center) and at 3,700 bar, conformer U begins to be populated (Fig. 5a Left).
An important observation is that the compression of each conformer is relatively small (average = 1% in hydrogen bond at 2 kbar; ref. 26) and occurs practically linearly with pressure unless a conformational transition between different conformers is involved (27). Basically, pressure is a chemically neutral perturbation and is expected to cause few changes of the folding funnel itself, determined by interatomic potentials. Unlike temperature, pressure does not substantially increase the internal energy of each conformational species, either. It is a mild perturbation whose work to the protein system, given by ΔV0(p − p0), is on the order of several kcal/mol at most, and this work is effectively used to redistribute populations among conformational sublevels. As long as the equilibrium experiments under pressure and kinetic experiments are done under exactly the same solution condition, the funnel remains practically the same, and the conformers detected in the equilibrium experiment at high pressure must have essentially the same structures with the conformers detected transiently in the kinetic experiment (Fig. 5). However, if the volume change between any two transient conformers is too small, distinction between these two may become difficult in the equilibrium pressure experiment even if they are distinguishable in time sequence of events.
The coincidence of the kinetically trapped intermediate with the pressure-stabilized intermediate conformer I in ubiquitin should represent just one such example of the general consequence. Another example of the coincidence of a pressure-jump kinetic unfolding intermediate and an equilibrium pressure unfolding intermediate was reported recently (20). Experimental evidence for the close identity of the kinetic folding core and the stable core at equilibrium of both native and partially folded proteins has been shown by Woodward and coworkers by monitoring 1H/2H exchange and NMR (28, 29). In conclusion, close structural identity of an equilibrium intermediate stabilized under pressure with a transiently observed folding intermediate is expected to be general in globular proteins. Thus, the combination of modern NMR spectroscopy with pressure provides a new effective means for studying structures of kinetic intermediates in protein folding with atom-based resolution.
Acknowledgments
We thank Dr. Hiroyuki Yamada for continuous technical advice. This work was supported in part by a Grant-in-Aid for Scientific Research from the Ministry of Education, Culture, Sports, Science and Technology of Japan.
Abbreviations
- HSQC
heteronuclear single-quantum coherence
- ΔV0
partial molar volume difference at 1 bar
- N1
the primary folded conformer
- N2
the secondary folded conformer
- I
the locally unfolded conformer
- U
the totally unfolded conformer
References
- 1.Vijay-Kumar S, Bugg C E, Cook W J. In: The Ubiquitin System. Schlesinger M, Hershko A, editors. Plainview, NY: Cold Spring Harbor Lab. Press; 1998. [Google Scholar]
- 2.Vijay-Kumar S, Bugg C E, Cook W J. J Mol Biol. 1987;194:531–544. doi: 10.1016/0022-2836(87)90679-6. [DOI] [PubMed] [Google Scholar]
- 3.Weber P L, Brown S C, Mueller L. Biochemistry. 1987;26:7282–7290. doi: 10.1021/bi00397a013. [DOI] [PubMed] [Google Scholar]
- 4.Schneider D M, Dellwo M J, Wand A J. Biochemistry. 1992;31:3645–3652. doi: 10.1021/bi00129a013. [DOI] [PubMed] [Google Scholar]
- 5.Cornilescu G, Marquardt J L, Ottiger M, Bax A. J Am Chem Soc. 1998;120:6836–6837. [Google Scholar]
- 6.Hochstrasser M. Science. 2000;289:563–564. doi: 10.1126/science.289.5479.563. [DOI] [PubMed] [Google Scholar]
- 7.Kitahara R, Yamada H, Akasaka K. Biochemistry. 2001;40:13556–13563. doi: 10.1021/bi010922u. [DOI] [PubMed] [Google Scholar]
- 8.Kitahara R, Yamada H, Akasaka K, Wright P E. J Mol Biol. 2002;320:311–319. doi: 10.1016/S0022-2836(02)00449-7. [DOI] [PubMed] [Google Scholar]
- 9.Briggs M S, Roder H. Proc Natl Acad Sci USA. 1992;89:2017–2021. doi: 10.1073/pnas.89.6.2017. [DOI] [PMC free article] [PubMed] [Google Scholar]
- 10.Akasaka K, Yamada H. Methods Enzymol. 2001;338:134–158. doi: 10.1016/s0076-6879(02)38218-1. [DOI] [PubMed] [Google Scholar]
- 11.Yamada H, Nishikawa K, Honda M, Shimura T, Akasaka K, Tabayashi K. Rev Sci Instrum. 2001;72:1463–1471. [Google Scholar]
- 12.Bodenhausen G, Ruben D J. Chem Phys Lett. 1980;69:185–189. [Google Scholar]
- 13.Sklenar V, Piotto M, Leppick R, Saudek V. J Magn Reson. 1993;102:A241–A245. [Google Scholar]
- 14.Chalikian T V, Breslauer K J. Biopolymers. 1996;39:619–626. doi: 10.1002/(sici)1097-0282(199611)39:5<619::aid-bip1>3.0.co;2-z. [DOI] [PubMed] [Google Scholar]
- 15.Ibarra-Molero B, Loladze V V, Makhatadze G I, Sanchez-Ruiz J M. Biochemistry. 1999;38:8138–8149. doi: 10.1021/bi9905819. [DOI] [PubMed] [Google Scholar]
- 16.Nicholls A, Sharp K A, Honig B. Proteins. 1991;11:281–296. doi: 10.1002/prot.340110407. [DOI] [PubMed] [Google Scholar]
- 17.Inoue K, Yamada H, Akasaka K, Herrmann C, Kremer W, Maurer T, Döker R, Kalbitzer H R. Nat Struct Biol. 2000;7:547–550. doi: 10.1038/76764. [DOI] [PubMed] [Google Scholar]
- 18.Kuwata K, Li H, Yamada H, Batt C A, Goto Y, Akasaka K. J Mol Biol. 2001;305:1073–1083. doi: 10.1006/jmbi.2000.4350. [DOI] [PubMed] [Google Scholar]
- 19.Kuwata K, Li H, Yamada H, Legname G, Prusiner S B, Akasaka K, James T L. Biochemistry. 2002;41:12277–12283. doi: 10.1021/bi026129y. [DOI] [PubMed] [Google Scholar]
- 20.Kitahara R, Royer C, Yamada H, Boyer M, Saldana J L, Akasaka K, Roumestand C. J Mol Biol. 2002;329:609–628. doi: 10.1016/s0022-2836(02)00516-8. [DOI] [PubMed] [Google Scholar]
- 21.Miura T, Klaus W, Gsell B, Miyamoto C, Senn H. J Mol Biol. 1999;290:213–228. doi: 10.1006/jmbi.1999.2859. [DOI] [PubMed] [Google Scholar]
- 22.VanDemark A P, Hofmann R M, Tsui C, Pickart C M, Wolberger C. Cell. 2001;105:711–720. doi: 10.1016/s0092-8674(01)00387-7. [DOI] [PubMed] [Google Scholar]
- 23.Onuchic J N, Luthey-Schulten Z, Wolynes P G. Annu Rev Phys Chem. 1997;48:545–600. doi: 10.1146/annurev.physchem.48.1.545. [DOI] [PubMed] [Google Scholar]
- 24.Nakamura H K, Sasai M. Proteins. 2001;43:280–291. doi: 10.1002/prot.1039. [DOI] [PubMed] [Google Scholar]
- 25.Frauenfelder H, Alberding N A, Ansari A, Braunstein D, Cowen B R, Hong M K, Iben I E T, Johnson J B, Luck S, Marden M C, et al. J Phys Chem. 1990;94:1024–1037. [Google Scholar]
- 26.Li H, Yamada H, Akasaka K. Biochemistry. 1998;37:1167–1173. doi: 10.1021/bi972288j. [DOI] [PubMed] [Google Scholar]
- 27.Akasaka K, Li H. Biochemisty. 2001;40:8665–8671. doi: 10.1021/bi010312u. [DOI] [PubMed] [Google Scholar]
- 28.Li R, Woodward C. Protein Sci. 1999;8:1571–1590. doi: 10.1110/ps.8.8.1571. [DOI] [PMC free article] [PubMed] [Google Scholar]
- 29.Barbar E, Hare M, Makokha M, Barany G, Woodward C. Biochemistry. 2001;40:9734–9742. doi: 10.1021/bi010483z. [DOI] [PubMed] [Google Scholar]
- 30.Wang A C, Grzesiek S, Tschudin R, Lodi P J, Bax A. J Biomol NMR. 1995;5:376–382. doi: 10.1007/BF00182281. [DOI] [PubMed] [Google Scholar]
- 31.Bridgman P W. Proc Am Acad Arts Sci. 1912;47:441–558. [Google Scholar]


