Abstract
The emission properties of ocular lipofuscin granules isolated from human retinal pigment epithelial cells are examined by using steady-state fluorescence spectroscopy and spectrally resolved confocal microscopy. The shape of the emission spectrum of a thick sample of lipofuscin granules dried on glass varies with excitation energy. The polarization of this emission is wavelength-dependent, exhibiting significant polarization near the excitation wavelength and becoming mostly depolarized over the majority of the emission spectrum. These results show that the yellow-emitting fluorophores [e.g., A2E (2-[2,6-dimethyl-8-(2,6,6-trimethyl-1-cyclohexen-1-yl)-1E,3E,5E,7E-octatetraenyl]-1-(2-hydroxyethyl)-4-[4-methyl-6-(2,6,6-trimethyl-1-cyclohexen-1-yl)-1E,3E,5E-hexatrienyl]-pyridinium)] are excited as a result of energy transfer within the granules and therefore are not the dominant blue-absorbing chromophores within lipofuscin granules. Atomic force microscopy images show lipofuscin granules to be an aggregated structure. Bulk and in vivo emission measurements must therefore take into account the effect of Raleigh scattering. When corrected for scattering, the emission spectrum of a thick lipofuscin deposit or intracellular lipofuscin resembles that for A2E. The sum of the emission spectra of a collection of individual granules also resembles the emission spectrum of A2E, but the spectrum of individual granules varies significantly. This result suggests that the agreement between the emission spectra of lipofuscin and A2E is fortuitous, and the collective data indicate the presence of several blue-absorbing chromophores in lipofuscin and show A2E is not the dominant yellow-emitting fluorophore in many of the granules studied.
Lipofuscin (LF) is a common morphological result of the aging process and is manifested as a heterogeneous complex of fluorescent, lipid-protein aggregates found in the cytoplasm of postmitotic cells (1–5). In the retinal pigment epithelium (RPE) of the human eye, the formation of LF is attributed to the accumulation of indigestible end-products from the phagocytosis of photoreceptor outer segments (1, 6–8). LF accumulates in RPE cells as clusters of granules and can occupy ≈20% of the cytoplasmic space by 80 yr of age (9). LF exhibits a yellow fluorescence (λmax ≈ 600 nm) upon blue-light excitation (10). In vitro experiments also show that blue-light excitation of cultured RPE cells‖ fed LF generates a variety of reactive oxygen intermediates (including hydrogen peroxide, singlet oxygen, and superoxide radical anion), which renders LF phototoxic to cultured RPE cells (11–13).
Determining the molecule(s) responsible for the aerobic photoreactivity and emissive properties of LF is the focus of current research. In a groundbreaking paper in 1988, Eldred and Katz (14) analyzed chloroform:methanol (2:1, vol/vol) extracts of RPE cells and separated several emissive bands by using TLC. A variety of yellow-emitting fluorophores were found. To date, only two isomers of a pyridinium bis-retinoid, A2E (2-[2,6-dimethyl-8-(2,6,6-trimethyl-1-cyclohexen-1-yl)-1E,3E,5E,7E-octatetraenyl]-1-(2-hydroxyethyl)-4-[4-methyl-6-(2,6,6-trimethyl-1-cyclohexen-1-yl)-1E,3E,5E-hexatrienyl]-pyridinium) and iso-A2E, have been positively identified (15–17).
Since the identification of A2E and iso-A2E, studies have focused on the toxic role these molecules play in RPE cells (18–39). The roles of A2E with RPE cells are varied, with multiple modes of toxic action possible. The structure of A2E suggests that it naturally acts as a detergent and is capable of disrupting membranes (15, 16, 18, 22). Recent studies by Rodriguez-Boulan and coworkers (35) show that A2E selectively inhibits phagolysosomal degradation, consistent with the prior work of Holz (21). Early studies indicated that A2E contributed to, if not dominated, the blue light-induced photoreactivity of LF. However, studies by Boulton and coworkers (29) show that the native concentration of A2E in LF granules is insufficient to account for the blue light-induced phototoxicity observed when LF granules are fed to RPE cells. Recently, we reported a detailed comparison of the action spectra for oxygen photoconsumption by LF and A2E and therein clearly demonstrated that A2E is not responsible for the photouptake of oxygen by LF (36). This conclusion is also supported by recent detailed studies quantifying A2E's inefficient photoproduction of various reactive oxygen intermediates (28, 30, 31, 40). Collectively, these results establish that A2E is not the dominant photoreactive component of LF.
Because the emission spectrum of A2E resembles that of LF, it has been widely postulated that A2E is both the dominant blue-absorbing chromophore and yellow-emitting fluorophore in LF. However, evidence supporting or refuting this assumption has not been reported. Recently the emission quantum yield and excited state lifetime of A2E in organic solvents were determined to be ≈0.01 and 12 ps, respectively (30). Related studies indicate similar photophysical parameters for A2E in micelles and liposomes, which are more appropriate model systems for the environment A2E encounters in LF granules (31). Given the low fluorescence quantum yield and short excited state lifetime, it is reasonable to question whether A2E is the dominant yellow-emitting fluorophore in LF. In this paper, the emission spectroscopy of LF is examined in detail. The data presented show that the emission spectrum of LF granules involves contributions from multiple fluorophores, and that the emission from A2E results mainly from energy transfer, not direct absorption. A comparison of the spectroscopic properties of individual LF granules to bulk LF further indicates that A2E is one of several emissive chromophores in LF.
Materials and Methods
Sample Preparation.
RPE cells from 47 pairs of eyes (Wisconsin Lions Eye Bank, Madison, WI) between the ages of 61 and 80 were isolated and pooled. RPE cells were burst by using gentle sonication (<10 s; Sonic-3, Polsmic, Poland), and the pigment granules were pelleted by using centrifugation. The pigment granules were then purified by separation on a discontinuous sucrose gradient (3). Intact LF granules were collected, suspended in aqueous solution, and stored at 4°C in the dark. Dispersed samples of LF granules were prepared by drying aliquots of a diluted stock solution onto appropriate substrates. A bulk, or optically thick sample, of LF granules was prepared by drying an aliquot of the stock solution onto a microscope slide. Transmission electron microscopy micrographs of the LF granules exhibit uniform electron density and a size range consistent with previous results of LF granules in RPE sections (41). RPE cells from a single donor (age 43) were isolated, fixed in paraformaldehyde, and then air dried on No. 1½ cover slips. A chloroform:methanol (2:1, vol/vol) extract of LF granules was prepared by using a modified Folch procedure (42) as described (36). A2E was synthesized from all-trans-retinal and ethanolamine (Sigma) and purified as described (30, 43, 44). ACS grade chloroform and methanol (Fisher Scientific) were used without further purification.
Instrumentation.
A Bioscope atomic force microscope with a Nanoscope IIIa controller operated in tapping mode was used to collect height and phase images (Digital Instruments, Santa Barbara, CA). Emission and polarization spectra were collected on a Spex Fluorolog-3 using front face detection (Jobin Yvon, Edison, NJ). Confocal fluorescence microscopy was performed on a home-built, spectrally resolved confocal microscope described in detail elsewhere (45, 46).
Results and Discussion
Lipofuscin Granule Morphology.
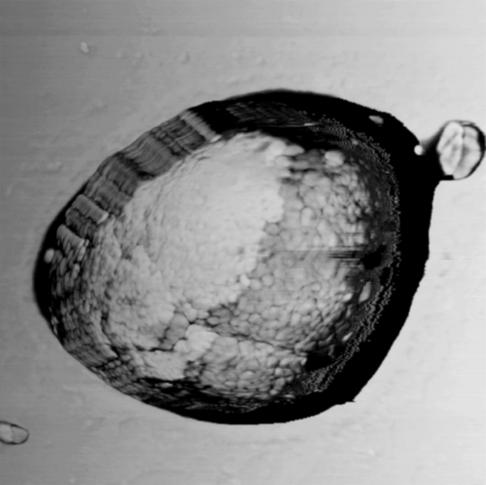
Transmission electron microscopy (TEM) micrographs of LF granules show granules to be uniformly dense and roughly spherical, consistent with previous TEM studies (3, 41). To examine structural morphology, individual LF granules were studied by using atomic force microscopy (AFM). Cross-sectional analysis of height images reveals the surface of granules to be smooth within the resolution of the image (4 nm per pixel). The phase images, however, show structure. As shown in Fig. 1, the phase image of an LF granule reveals that the surface is comprised of small distinct regions of material separated by thin boundary layers. LF granules are therefore an aggregated material. Based on such images, the granule is comprised of substructures that are ≈50 nm in diameter.
Figure 1.
AFM phase image (1.5 μm × 1.5 μm) of an LF granule reveals the presence of smaller components that comprise the granule. The height of the granule is 700 nm. Cross-sectional examination shows that the surface of the LF granule is smooth.
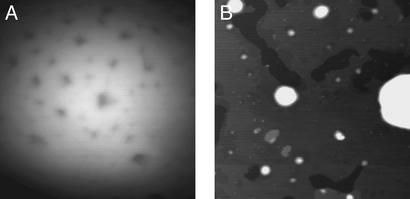
Changes in the surface morphology of LF granules after exposure to chloroform and chloroform:methanol mixtures were also examined. These solvents have previously been used to extract fluorophores and lipids from the granules (14, 36). An AFM height image of an LF granule deposited on mica after rinsing with a drop of chloroform and air drying is shown in Fig. 2A. The most noticeable features in this image are the circular indentations, ≈50 nm in diameter and 20 nm and 40 nm in depth. After exposure to one drop of chloroform, the center-to-center distances between neighboring indentations range from 50 nm to 250 nm, with an average of ≈100 nm. Multiple rinses with chloroform increase the number of indentations on the surface. Quantification of the distances between neighboring indentations becomes difficult to determine because of the substantial changes to the surface morphology.
Figure 2.
(A) AFM height image (750 nm × 750 nm) of an LF granule deposited on mica and then washed with chloroform. (B) AFM height image (4.0 μm × 4.0 μm) of LF granules extracted for 2 h in chloroform:methanol (2:1, vol/vol) and then dried on mica.
Complementary information is provided in a separate experiment, shown in Fig. 2B, where LF granules were suspended in chloroform:methanol solution and then, at varying times, an aliquot of that solution was dried on mica and imaged with AFM. The structures observed in the image shown in Fig. 2B are the materials present after solvent exposure for 2 h. Various size structures are observed, with diameters ranging from 50 nm to 1.0 μm. The distribution of particle size depends on the length of solvent exposure. The number of large structures (>500 nm) decreases and the number of small structures increases (≈50 nm) with increasing solvent exposure. Whereas numerous small particles (≈50 nm in diameter) can be seen, the surface is clearly coated by ≈5-nm-thick layer(s). This surface coating develops over time. For example, at 20 min, discrete ≈5-nm-high islands are observed whereas at 2 h the mica is mostly covered.
The data in Fig. 2 clearly show that exposure to solvent disassembles LF granules into small structures of diameter ≈50 nm, and a material that can coat the surface of the mica in ≈5-nm-thick layers. Our study identifies stable substructures, which comprise the LF granules. To understand the events occurring on the molecular level, the material being dissolved by the solvents must be identified. Past work demonstrates that this solvent mixture dissolves the various fluorophores of LF (14). However, these fluorophores constitute a negligible amount of the material dissolved. To aid in the identification of molecular species dissolved, the chloroform:methanol solution was analyzed by using fast-atom bombardment MS. The mass spectrum of the LF extracts reveals that the presence of several glycophospholipids and sphingolipids in the m/z region from 685 to 825. Through comparison with the MS/MS fragmentation patterns of standard references (Sigma), the dominant glycophospholipids in the LF extract were identified as phosphatidylcholines (16:0/16:0, 16:0/18:1, 18:1/18:1, 16:0/20:4, and 18:0/20:4) and phosphatidylethanolamines (16:0/18:1 and 18:1/18:1). The presence of these lipids is consistent with a previous study by Bazan et al. (47), which analyzed the total phospholipid and free fatty acid content in LF granules. Additional imaging studies and experiments performed in our laboratory show that the lipids identified in the LF extract form layered deposits when dried on mica substrates, similar to what is observed in Fig. 2B for the LF extracts. Thus, the material that coats the mica surface after solvent extraction of LF is concluded to be predominantly lipid in nature.
As stated above, AFM images revealed that these lipid deposits increase in dimension with increased length of solvent exposure. This removal of lipid material is consistent with the surface etching revealed upon exposure of LF granules to chloroform. Etching of the LF granules removes regions of material simulating the initial disassembly of the granule. The evolution of the etching of the LF granule after multiple chloroform rinses also supports the smaller entities having a lipid coating associated with them. It is reasonable to conclude that the insoluble structures were originally coated by lipid and that such structures aggregated to form the LF granule. The composition of the material, which resists extraction, remains unclear, but likely contains damaged material that is resistant to lysosomal degradation. Chemical analysis indicates that LF granules are 30–70% protein. Thus, the insoluble material is believed to be mostly cross-linked proteins, damaged by interactions with reactive oxygen intermediates (48). Recently, Schütt et al. (49) showed that LF granules contain 70 different proteins, as identified by 2D gel electrophoresis and MS. Thus, future work should be able to confirm this model.
Emission Behavior of Bulk Lipofuscin.
Previously, Delori et al. (10) examined the emission properties of LF under various conditions. Paraffin sections of RPE cells containing LF granules showed an emission spectrum that peaked at ≈570 nm. For isolated RPE cells, the spectrum peaked at ≈600 nm. Boulton and coworkers (3, 50) reported age-dependent emission properties of LF. Using pooled samples of LF granules from the RPE of donor eyes within specific age brackets, the emission properties of LF were found to depend on age. The emission peaked at ≈600 nm, but, depending on the age bracket examined, the spectrum showed shoulders at 470, 550, and 680 nm.
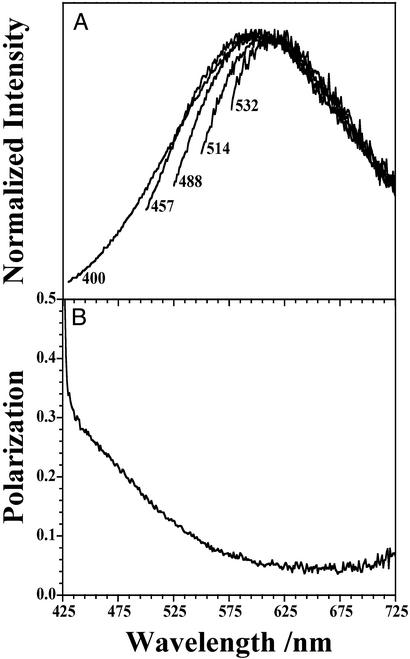
The emission spectrum of bulk LF as a function of excitation wavelength is shown in Fig. 3A. Varying the excitation from 400 nm to 532 nm has no effect on the red edge of the spectrum and only a slight effect on the emission maximum. However, the spectrum broadens with decreasing excitation wavelength. The evolution of the blue edge as a function of excitation is straightforward to interpret. With decreased excitation wavelength, additional fluorophores are excited, which contribute to the total emission and broaden the blue edge of the spectrum. The origin of the invariance of the red edge of the emission spectrum with excitation can be explained in two ways. First, the entire set of excitation wavelengths could directly excite the molecule(s), which emits in this region. Second, the electronically excited molecule(s) transfer electronic energy to a single fluorophore, which dominates the red edge of the spectrum.
Figure 3.
Emission spectra of bulk LF deposited on glass at varying excitation wavelengths. Changing the excitation wavelength has no apparent effect on the red edge of the spectrum and only a slight effect on the emission maximum. However, the spectrum broadens to higher energy with increasing excitation energy. The polarization data for spectrum that were obtained by using an excitation wavelength of 400 nm is also shown.
The red-edge emission is generally ascribed to A2E. From 400 to 532 nm, the absorption cross-section of A2E changes by more than two orders of magnitude. The emission intensity of LF does not track the absorption spectrum of A2E over this spectral range. Thus, if this region is dominated by the emission of A2E, then A2E must become excited predominantly by energy transfer. This conclusion can be verified by examining the wavelength dependence of the emission polarization. Fig. 3 also shows the emission polarization of bulk LF for an excitation wavelength of 400 nm. The polarization [P(λ)] is defined by P(λ) = [IVV(λ) − G(λ)⋅IVH(λ)]/[IVV(λ) + G(λ)⋅IVH(λ)], where vertically polarized light is used to excite the sample, and IVV(λ) and IVH(λ) are the emission intensities measured for vertical and horizontal polarizations, respectively. An instrument correction factor [G(λ)] adjusts for different detection efficiencies of the two polarizations (51). When the absorption and emission dipoles are parallel to one another, then P = 0.5. The data in Fig. 3B show significant polarization for emission wavelengths near the excitation wavelength (P = 0.34 at 430 nm). The polarization decreases with increasing emission wavelength, achieving a constant value over the red edge of the emission spectrum (P = 0.05 for 600 nm ≤ λ ≤ 700 nm).
The LF sample used to measure P(λ) was a solid deposit, hence it is reasonable to conclude depolarization cannot arise from rotational motion of fluorophores. The data must reflect energy transfer processes, which occur within the sample. For all excitation wavelengths examined, the shape of the emission spectrum for λ > 580 is the same; the polarization in this region is also constant, but not zero. This constant value of P(λ) suggests that the polarization spectrum in this wavelength region originates from a single fluorophore, and the line shape of this part of the emission spectrum is consistent with that of A2E. The extensive depolarization reveals that emission in this region results from energy transfer, not direct excitation. Therefore, if emission in this region emanates from A2E, the polarization data establish that A2E is not the dominant blue-light absorbing molecule in LF.
Emission Behavior of Individual Lipofuscin Granules.
A fluorescence intensity image of individual LF granules from the pooled 61- to 80-yr-old sample were examined by using a spectrally resolved confocal microscope exciting at 457.9 nm. The emission spectra of 91 granules were collected and analyzed. As previously reported, significant variations in the emission maxima were observed (52, 53). Prior studies have shown that the emission across a single LF granule is invariant with respect to the ≈150-nm resolution limit of near-field scanning optical microscopy (NSOM). Significant variation in the emission maxima and spectral shape from different individual LF granules was observed by using both NSOM and spectrally resolved confocal microscopy (52, 53). The variation in the emission maxima observed in the present study is shown in Table 1. The emission maxima range from 16,350 to 19,500 cm−1 (612–513 nm) with an average of 17,818 cm−1 (561 nm).
Table 1.
Distribution of emission maxima for individual lipofuscin granules
| Bin region, cm−1 | Pooled | Single |
|---|---|---|
| 16,350–16,500 | 4 | 0 |
| 16,500–16,650 | 4 | 0 |
| 16,650–16,800 | 4 | 0 |
| 16,800–16,950 | 6 | 0 |
| 16,950–17,100 | 6 | 0 |
| 17,100–17,250 | 3 | 0 |
| 17,250–17,400 | 3 | 0 |
| 17,400–17,550 | 7 | 1 |
| 17,550–17,700 | 5 | 0 |
| 17,700–17,850 | 9 | 1 |
| 17,850–18,000 | 3 | 0 |
| 18,000–18,150 | 4 | 3 |
| 18,150–18,300 | 4 | 7 |
| 18,300–18,450 | 2 | 7 |
| 18,450–18,600 | 4 | 10 |
| 18,600–18,750 | 4 | 5 |
| 18,750–18,900 | 5 | 2 |
| 18,900–19,050 | 3 | 0 |
| 19,050–19,200 | 5 | 1 |
| 19,200–19,350 | 3 | 0 |
| 19,350–19,500 | 2 | 0 |
| 19,500–19,650 | 1 | 0 |
Variability in the emission wavelength maximum for the individual LF granules analyzed is observed. Results from both a pooled sample of 60- to 80-yr-old donor eyes and a single 43-yr-old donor eye are listed. The individual emission spectra were collected from LF granules dried on a glass excited with the 457.9-nm line of an argon ion laser (Sabre R Series, Coherent Radiation). The incident power of 0.5 mW and an exposure time of 2.0 s were used, corresponding to excitation of the sample by 2.30 × 10¹⁵ photons.
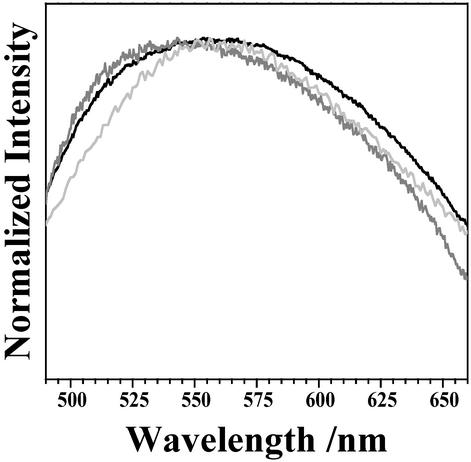
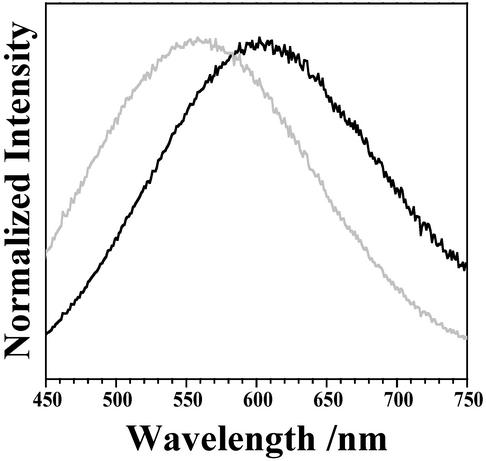
The emission spectrum corresponding to the sum of the 91 individual granules was determined. This spectrum exhibits a maximum at 553 nm, (see Fig. 7 below). The corresponding spectrum of a bulk deposit (Fig. 3) peaks at 595 nm. Thus, for the same excitation wavelength, the maximum of the emission spectrum for bulk LF is red-shifted from the sum of spectra from individual granules by 42 nm.
Figure 7.
A comparison of the summed emission of the 91 imaged granules (black), bulk LF emission corrected for Rayleigh scattering (gray), and synthetic A2E (dark gray). All spectra were collected under 457.9-nm excitation.
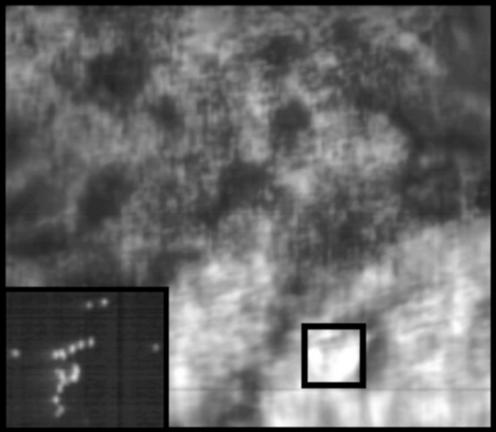
Similar effects are observed in fixed RPE cells from an individual 43-yr-old donor. A spectrally resolved confocal microscopy image of fixed RPE cells is shown in Fig. 4. In preparing this sample, some cells burst, distributing individual granules on the glass slide (see Inset in Fig. 4). The variation in the emission maxima observed for such granules is also given in Table 1. For the granules observed, the emission maxima range from 17,400 to 19,250 cm−1 (575–519 nm) with a mean of 18,536 cm−1 (540 nm). We note that the distribution of emission maxima for granules from the 43-yr-old donor is narrower than that of the pooled sample of 60- to 80-yr-old specimens. This observation could indicate an age-dependent broadening in the spectral properties of LF granules, consistent with the studies of age-dependent emission properties of LF by Boulton and coworkers (3, 50). The emission spectra of the individual LF granules are summed and compared with the emission from a cluster of granules (the boxed region in Fig. 4) within a fixed RPE cell in Fig. 5. Similar to the results presented above, the maximum of the emission spectrum for cellular LF is red-shifted from the sum of spectra from individual granules. In this case, both samples are from the same donor eye.
Figure 4.
Confocal image of RPE cells from a 43-yr-old donor fixed and dried on a glass coverslip excited with the 407-nm light (Blue/Violet Diode Laser System, Coherent Radiation, Palo Alto, CA). The incident power of 0.5 mW and an exposure time of 2.0 s were used corresponding to excitation of the sample by 2.30 × 10¹⁵ photons. (Inset) Several individual LF granules present at the edges of the samples.
Figure 5.
The emission spectra from the 37 LF granules from a single donor were summed (black) and compared with the emission from a densely packed region (see box in Fig. 4) within an RPE cell (gray). The emission from within the cells is red-shifted when compared with that of the individual granules.
Reconciliation of Individual and Bulk Emission Behaviors.
It is important to determine whether the spectroscopic differences between individual LF granules and bulk LF have a molecular origin or if they are due to the physical difference between the environments and preparations of the samples. The data presented in Fig. 3 were collected in a front-face geometry on a substrate that was coated with several layers of densely packed granules. Excitation light passed through this sample, indicating that emission originated from varying depths within the thick LF deposit. Thus, light scattering contributes to the shape of the measured emission spectrum under these conditions. The data on individual granules (Table 1) were collected in an epi-illuminated geometry on a substrate coated with dispersed individual granules. Emission collected in this manner mostly originates near the surface of an individual granule, and the spectrum should not be significantly affected by scattering. Scattering must then be taken into consideration before comparing the spectroscopic properties of individual LF granules and bulk LF.
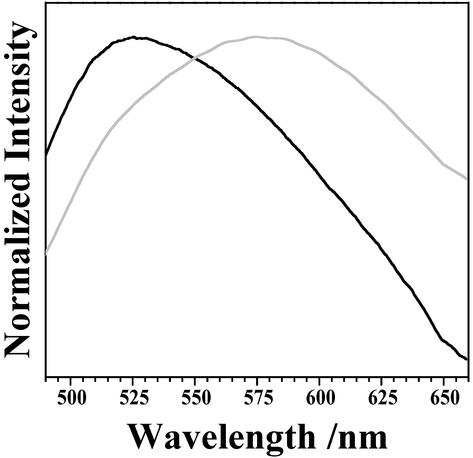
Two common scattering processes must be considered when studying particles: Mie and Rayleigh scattering. Mie scattering dominates when the diameter of the particle is large compared with the wavelength of light and Rayleigh scattering dominates when the diameter of the particle is small compared with the wavelength of light. Mie scattering is weakly dependent on the wavelength of light, but Rayleigh scattering scales as λ−4 (54). Recall AFM data presented herein show an LF granule to be an aggregate of ≈50-nm structures. Thus, for bulk LF, the constituent particle size is small compared with the wavelength of light, and Rayleigh scattering will dominate. Fig. 6 compares the measured bulk LF emission spectrum excited at 400 nm with that taking Rayleigh scattering into account. Scattering causes a red-shift in the emission maximum of 50 nm and a small change in the width of 7 nm.
Figure 6.
The emission spectrum of bulk LF deposited on glass excited at 400 nm (black) was corrected to account for Rayleigh scattering of the emission by individual granules or granule components (gray).
The emission spectra of all 91 individual granules (60–80 yr of age) studied is summed and compared with a scattered-corrected bulk emission spectrum in Fig. 7. The plot clearly shows that, when scattering effects are taken into account, the bulk spectrum agrees with the sum spectrum of individual granules.
Implications of the Importance of A2E in the Spectroscopy of LF.
As mentioned above, A2E is often considered as the dominant blue-absorbing chromophore in LF and the dominant yellow-emitting fluorophore responsible for the emission spectrum of LF. This similarity between the emission spectra of A2E and bulk LF has served as the foundation of this conclusion. The emission spectrum of A2E collected under the same experimental conditions used to measure spectra of individual granules is also shown in Fig. 7. The A2E spectrum is similar in shape to the LF spectra displayed. However, this agreement does not mean that A2E is the dominant fluorophore. The results presented herein challenge the conclusion that A2E is either the dominant chromophore or fluorophore in LF. As shown in Fig. 3, the wavelength-dependent polarization shows that A2E becomes electronically excited largely by energy transfer. Thus, A2E cannot be the dominant blue-absorption chromophore. The emission spectra of the individual granules exhibit great variability and often differ significantly from the spectrum of A2E. Clearly, when the spectrum of an individual granule is significantly blue-shifted from that of A2E, it must be concluded that molecules other than A2E dominate the emission from these granules. The study of individual granule emission clearly shows that many fluorophores contribute to LF's emission, including A2E, but that A2E is not the dominant yellow-emitting fluorophore.
Conclusions
In summary, the work presented herein has shown LF granules to be comprised of an aggregated structure of subunits that are insoluble in chloroform, and lipid membrane material. As a result, bulk and in vivo emission measurements must take into account the effect of Raleigh scattering. Whereas the emission spectrum of LF is similar to the emission of A2E, the variations in emission observed among individual granules indicate that multiple species contribute to LF absorption and emission. In addition, the polarization data presented demonstrate that the yellow-emitting chromophores (e.g., A2E) are predominately excited by energy transfer within the granule. The primary blue-absorbing species remains unidentified. It can be concluded from this and other work that A2E is not the dominant chromophore, fluorophore, and photoactive species in LF. However, as previously mentioned, A2E may still have significant nonphotoinitiated functions with RPE cells.
Acknowledgments
We thank Marius Zareba for isolating and purifying the LF granules. This work is supported by Duke University (J.D.S.), the State Committee for Scientific Research (T.S.), the Wellcome Trust (T.S.), and National Eye Institute Grant EY13722 (to J.M.B.).
Abbreviations
- A2E
2-[2,6-dimethyl-8-(2,6,6-trimethyl-1-cyclohexen-1-yl)-1E,3E,5E,7E-octatetraenyl]-1-(2-hydroxyethyl)-4-[4-methyl-6-(2,6,6-trimethyl-1-cyclohexen-1-yl)-1E,3E,5E-hexatrienyl]-pyridinium
- AFM
atomic force microscopy
- LF
lipofuscin
- RPE
retinal pigment epithelium
Footnotes
RPE cells typically lose their native pigments after a few passages in culture. Thus, there is negligible LF and melanin in cultured cells used for in vitro phototoxicity measurements.
References
- 1.Feeney L. Invest Ophthalmol Visual Sci. 1978;17:583–600. [PubMed] [Google Scholar]
- 2.Sohol R S. Age Pigments. Amsterdam: Elsevier/North-Holland Biomedical Press; 1981. [Google Scholar]
- 3.Boulton M, Docchio F, Dayhaw-Barker P, Ramponi R, Cubeddu R. Vision Res. 1990;30:1291–1303. doi: 10.1016/0042-6989(90)90003-4. [DOI] [PubMed] [Google Scholar]
- 4.Kennedy C J, Rakoczy P E, Constable I J. Eye. 1995;9:763–771. doi: 10.1038/eye.1995.192. [DOI] [PubMed] [Google Scholar]
- 5.Yin D. Free Radical Biol Med. 1996;21:871–888. doi: 10.1016/0891-5849(96)00175-x. [DOI] [PubMed] [Google Scholar]
- 6.Feeney-Burns L, Eldred G E. Trans Ophthalmol Soc UK. 1983;103:416–421. [PubMed] [Google Scholar]
- 7.Katz M L, Drea C M, Eldred G E, Hess H H, Robison W G. Exp Eye Res. 1986;43:561–573. doi: 10.1016/s0014-4835(86)80023-9. [DOI] [PubMed] [Google Scholar]
- 8.Boulton M, McKechnie N M, Breda J, Bayly M, Marshall J. Invest Ophthalmol Visual Sci. 1989;30:82–89. [PubMed] [Google Scholar]
- 9.Feeney-Burns L, Hilderbrand E S, Eldridge S. Invest Ophthalmol Visual Sci. 1984;25:195–200. [PubMed] [Google Scholar]
- 10.Delori F C, Dorey C K, Staurenghi G, Arend O, Goger D G, Weiter J J. Invest Ophthalmol Visual Sci. 1995;36:718–729. [PubMed] [Google Scholar]
- 11.Boulton M, Dontsov A, Jarvisevans J, Ostrovsky M, Svistunenko D. J Photochem Photobiol B. 1993;19:201–204. doi: 10.1016/1011-1344(93)87085-2. [DOI] [PubMed] [Google Scholar]
- 12.Rózanowska M, Jarvis-Evans J, Korytowski W, Boulton M E. J Biol Chem. 1995;270:18825–18830. doi: 10.1074/jbc.270.32.18825. [DOI] [PubMed] [Google Scholar]
- 13.Rózanowska M, Wessels J, Boulton M, Burke J M, Rodgers M A J, Truscott T G, Sarna T. Free Radical Biol Med. 1998;24:1107–1112. doi: 10.1016/s0891-5849(97)00395-x. [DOI] [PubMed] [Google Scholar]
- 14.Eldred G E, Katz M L. Exp Eye Res. 1988;47:71–86. doi: 10.1016/0014-4835(88)90025-5. [DOI] [PubMed] [Google Scholar]
- 15.Eldred G E, Lasky M R. Nature. 1993;361:724–726. doi: 10.1038/361724a0. [DOI] [PubMed] [Google Scholar]
- 16.Eldred G E. Nature. 1993;364:396. doi: 10.1038/364396a0. [DOI] [PubMed] [Google Scholar]
- 17.Sakai N, Decatur J, Nakanishi K. J Am Chem Soc. 1996;118:1559–1560. [Google Scholar]
- 18.Eldred G E. Gerontology. 1995;41:15–26. doi: 10.1159/000213722. [DOI] [PubMed] [Google Scholar]
- 19.Reinboth J J, Gautschi K, Munz K, Eldred G E, Reme C E. Exp Eye Res. 1997;65:639–643. doi: 10.1006/exer.1997.0367. [DOI] [PubMed] [Google Scholar]
- 20.Cubeddu R, Taroni P, Hu D-N, Sakai N, Nakanishi K, Roberts J E. Photochem Photobiol. 1999;70:172–175. [PubMed] [Google Scholar]
- 21.Holz F G, Schütt F, Kopitz J, Eldred G E, Kruse F E, Volcker H E, Cantz M. Invest Ophthalmol Visual Sci. 1999;40:737–743. [PubMed] [Google Scholar]
- 22.Sparrow J R, Parish C A, Hasimoto M, Nakanishi K. Invest Ophthalmol Visual Sci. 1999;40:2988–2995. [PubMed] [Google Scholar]
- 23.Schütt F, Davies S, Kopitz J, Holz F G, Boulton M E. Invest Ophthalmol Visual Sci. 2000;41:2303–2308. [PubMed] [Google Scholar]
- 24.Schütt F, Davies S, Kopitz J, Boulton M, Holz F G. Ophthalmologe. 2000;97:682–687. doi: 10.1007/s003470070037. [DOI] [PubMed] [Google Scholar]
- 25.Sparrow J R, Nakanishi K, Parish C A. Invest Ophthalmol Visual Sci. 2000;41:1981–1989. [PubMed] [Google Scholar]
- 26.Suter M, Reme C, Grimm C, Wenzel A, Jaattela M, Esser P, Kociok N, Leist M, Richter C. J Biol Chem. 2000;275:39625–39630. doi: 10.1074/jbc.M007049200. [DOI] [PubMed] [Google Scholar]
- 27.Bermann M, Schütt F, Holz F G, Kopitz J. Exp Eye Res. 2001;72:191–195. doi: 10.1006/exer.2000.0949. [DOI] [PubMed] [Google Scholar]
- 28.Cantrell A, McGarvey D J, Roberts J, Sarna T, Truscott T G. J Photochem Photobiol B Biol. 2001;64:162–165. doi: 10.1016/s1011-1344(01)00224-x. [DOI] [PubMed] [Google Scholar]
- 29.Davies S, Elliott M H, Floor E, Truscott T G, Zareba M, Sarna T, Shamsi F A, Boulton M. Free Radical Biol Med. 2001;31:256–265. doi: 10.1016/s0891-5849(01)00582-2. [DOI] [PubMed] [Google Scholar]
- 30.Lamb L E, Ye T, Haralampus-Grynaviski N, Williams T R, Pawlak A, Sarna T, Simon J D. J Phys Chem B. 2001;105:11507–11512. [Google Scholar]
- 31.Ragauskaite L, Heckathorn R C, Gaillard E R. Photochem Photobiol. 2001;74:483–488. doi: 10.1562/0031-8655(2001)074<0483:eeotpo>2.0.co;2. [DOI] [PubMed] [Google Scholar]
- 32.Schütt F, Bergmann M, Kopitz J, Holz F G. Ophthalmologe. 2001;98:721–724. doi: 10.1007/s003470170078. [DOI] [PubMed] [Google Scholar]
- 33.Sparrow J R, Cai B L. Invest Ophthalmol Visual Sci. 2001;42:1356–1362. [PubMed] [Google Scholar]
- 34.Ben-Shabat S, Itagaki Y, Jockusch S, Sparrow J R, Turro N J, Nakanishi K. Angew Chem Int Ed Engl. 2002;41:814–817. doi: 10.1002/1521-3773(20020301)41:5<814::aid-anie814>3.0.co;2-2. [DOI] [PubMed] [Google Scholar]
- 35.Finnemann S C, Leung L W, Rodriguez-Boulan E. Proc Natl Acad Sci USA. 2002;99:3842–3847. doi: 10.1073/pnas.052025899. [DOI] [PMC free article] [PubMed] [Google Scholar]
- 36.Pawlak A, Rozanowska M, Zareba M, Lamb L E, Simon J D, Sarna T. Arch Biochem Biophys. 2002;403:59–62. doi: 10.1016/S0003-9861(02)00260-6. [DOI] [PubMed] [Google Scholar]
- 37.Roberts J, Kukielczak B, Hu D, Miller D, Bilski P, Sik R, Motten A, Chignell C. Photochem Photobiol. 2002;75:184–190. doi: 10.1562/0031-8655(2002)075<0184:troaip>2.0.co;2. [DOI] [PubMed] [Google Scholar]
- 38.Shaban H, Richter C. Biol Chem. 2002;383:537–545. doi: 10.1515/BC.2002.054. [DOI] [PubMed] [Google Scholar]
- 39.Sparrow J R, Zhou J, Ben-Shabat S, Vollmer H, Itagaki Y, Nakanishi K. Invest Ophthalmol Visual Sci. 2002;43:1222–1227. [PubMed] [Google Scholar]
- 40. Pawlak, A., Wrona, M., Rózanowska, M., Zareba, M., Lamb, L. E., Roberts, J., Simon, J. D. & Sarna, T. (2003) Photochem. Photobiol. 77, in press. [DOI] [PubMed]
- 41.Schraermeyer U, Heimann K. Pigm Cell Res. 1999;12:219–236. doi: 10.1111/j.1600-0749.1999.tb00755.x. [DOI] [PubMed] [Google Scholar]
- 42.Folch J, Lees M, Sloane-Stanley G H. J Biol Chem. 1957;226:497–509. [PubMed] [Google Scholar]
- 43.Parish C A, Hashimoto M, Nakanishi K, Dillon J, Sparrow J. Proc Natl Acad Sci USA. 1998;95:14609–14613. doi: 10.1073/pnas.95.25.14609. [DOI] [PMC free article] [PubMed] [Google Scholar]
- 44.Mata N L, Weng J, Travis G H. Proc Natl Acad Sci USA. 2000;97:7154–7159. doi: 10.1073/pnas.130110497. [DOI] [PMC free article] [PubMed] [Google Scholar]
- 45.Stimson M J, Haralampus-Grynaviski N, Simon J D. Rev Sci Instrum. 1999;70:3351–3354. [Google Scholar]
- 46.Haralampus-Grynaviski N M, Stimson M J, Simon J D. Appl Spectrosc. 2000;54:1727–1733. [Google Scholar]
- 47.Bazan H E P, Bazan N G, Feeney-Burns L, Berman E R. Invest Ophthalmol Visual Sci. 1990;31:1433–1443. [PubMed] [Google Scholar]
- 48.Brunk U T, Terman A. Free Radical Biol Med. 2002;33:611–619. doi: 10.1016/s0891-5849(02)00959-0. [DOI] [PubMed] [Google Scholar]
- 49.Schütt F, Ueberle B, Schnölzer M, Holz F G, Kopitz J. FEBS Lett. 2002;528:217–221. doi: 10.1016/s0014-5793(02)03312-4. [DOI] [PubMed] [Google Scholar]
- 50.Docchio F, Boulton M, Cubeddu R, Ramponi R, Barker P D. Photochem Photobiol. 1991;54:247–253. doi: 10.1111/j.1751-1097.1991.tb02013.x. [DOI] [PubMed] [Google Scholar]
- 51.Lakowicz J R. Principles of Fluorescence Spectroscopy. New York: Kluwer; 1999. [Google Scholar]
- 52.Clancy C M R, Krogmeier J R, Pawlak A, Rozanowska M, Sarna T, Dunn R C, Simon J D. J Phys Chem B. 2000;104:12098–12101. [Google Scholar]
- 53.Haralampus-Grynaviski N M, Lamb L E, Simon J D, Krogmeier J R, Dunn R C, Pawlak A, Rozanowska M, Sarna T, Burke J M. Photochem Photobiol. 2001;74:364–368. doi: 10.1562/0031-8655(2001)074<0364:ptsdot>2.0.co;2. [DOI] [PubMed] [Google Scholar]
- 54.Ingle J D, Jr, Crouch S R. Spectrochemical Analysis. Englewood Cliffs, NJ: Prentice-Hall; 1988. pp. 494–499. [Google Scholar]


