

Abstract
We introduce a method for discriminating correctly folded proteins from well designed decoy structures using atom–atom and atom–solvent contact surfaces. The measure used to quantify contact surfaces integrates the solvent accessible surface and interatomic contacts into one quantity, allowing solvent to be treated as an atom contact. A scoring function was derived from statistical contact preferences within known protein structures and validated by using established protein decoy sets, including the “Rosetta” decoys and data from the CASP4 structure predictions. The scoring function effectively distinguished native structures from all corresponding decoys in >90% of the cases, using isolated protein subunits as target structures. If contacts between subunits within quaternary structures are included, the accuracy increases to 97%. Interactions beyond atom–atom contact range were not required to distinguish native structures from the decoys using this method. The contact scoring performed as well or better than existing statistical and physicochemical potentials and may be applied as an independent means of evaluating putative structural models.
Solvent effects, including hydrophobic interactions, have long been seen as the driving force behind protein folding (see ref. 1). The direct or indirect inclusion of solvation effects thus is an important component of a protein-folding potential. The calculation of solvent-accessible surfaces (SASs) (2) in particular has provided a useful approximation for estimating energies of solvation. Atomic SASs provide a means to quantify solvent contact in the absence of explicit solvent molecules and are strongly correlated to experimental solvation energies (3). Direct methods of incorporating solvation effects into physics-based potentials include the generalized Born/surface-area method (4–6), Gaussian approximations (7, 8), and explicit solvent/surface-area methods (9).
Statistical protein-folding potentials (10–18), extracted from data on known protein structures, implicitly incorporate solvation effects to some degree. The medium-range attractive potential between hydrophobic residues, for example, is largely due to the localization of these residues in the interior of the protein, minimizing their solvent contact. Many statistical scoring functions assume that interatomic or interresidue distances follow a Boltzmann-like distribution, and the global minimum score occurs in the vicinity of the lowest energy structure. Alternatively, a scoring function may be viewed as a set of probability distributions, which can be used to find a maximum probability structure (19, 20). In practice, both these approaches usually quantify scores using the log-odds ratio of an observed quantity, such as interresidue distances, to a specified reference state. Unfortunately, solvation terms are not readily derived by using a distance-based methodology, because the positions of solvent molecules surrounding a protein for the most part are unknown. Although the theoretical basis of statistical potentials has been questioned (21), they have proven to be as effective as physicochemical-based folding potentials (8, 22).
The testing and verification of protein-folding potentials has been facilitated greatly by the availability of protein decoy sets (20, 23–25). A given decoy set will contain one to thousands or more simulated protein-like structures, based on the amino acid sequence from a known structure. These decoy sets provide a means to independently verify the performance of scoring functions for protein folding and permit comparisons between different scoring methods. Within any decoy set, an effective potential should be able to distinguish native structures from decoy structures with a high degree of accuracy. It should also recognize decoys that closely resemble the native structure, assuming that near-native conformations are sampled sufficiently within the set. It has been suggested that any scoring function for protein folding should be tested with at least some of the standardized decoy sets before publication (8).
Two early decoy sets were the CASP1 (Asilomar) and EMBL_misfold sets (23). Both statistical and physicochemical potentials have been able to distinguish the native protein structures from the decoys in these sets (7, 10), with the notable exception of the hexameric protein NDK from the EMBL_misfold set, the native isolated subunit of which was not recognized by either type of potential. Decoys from the 4state_reduced (24), lattice_ssfit (25), and lmds data sets were used later to evaluate several residue-based potentials (12). In this comparison, the native structure was ranked first in 42–58% of the test cases. Similar accuracy was also obtained by using a residue-based hydrophobic discrimination function (26). The 4state_reduced decoy sets likewise were used for testing scoring functions based on all-atom representations. Several of these functions distinguished the native structures from corresponding decoys (7, 10, 11, 27, 28). More recent decoy sets such as those generated by the Rosetta method (20) provide a particularly challenging test of scoring functions, because the decoys are assembled from fragments of known native structures (8). As of yet, few data have been published on the performance of scoring functions using these decoys.
Given the strong correlation between atomic surface areas and solvation energy (3), it is reasonable to assume that the energy of desolvation (i.e., the hydrophobic effect) may be approximated by loss of SAS. Interatomic contact areas additionally might be used to determine statistical contact preferences between atoms, where a contact preference approximates a sum of energetic interactions and structural constraints. To test this hypothesis, we conducted a statistical assessment of atom–atom and atom–solvent contact areas within known structures extracted from the Protein Data Bank (29) and used this data to generate atom–atom contact potentials. Contacts were quantified by using a constrained Voronoi tessellation procedure (30), which permits atom–atom and atom–solvent contacts to be treated as similar statistical quantities. It is assumed that by explicitly including atom–solvent contacts, the solvation/desolvation energies will be approximated better within the scoring function, leading to a more accurate potential.
Methods
Calculation of Contact Potentials.
The presented potential is based on an assessment of contact preferences for the 167 standard residue-specific ATOM types within Protein Data Bank records (29). For each atom type there are 168 possible contact types, representing 167 possible atom contacts plus solvent contact. The complete potential may be represented as an array of 167 × 168 contact parameters ɛa(b). The completely unfolded protein is used as the reference state, in which all atoms are initially in contact with solvent. From this state it is assumed that the protein folds into a configuration that maximizes favorable atomic contacts.
To quantify contact surfaces, a procedure based on a Voronoi tessellation (see ref. 31) is used to create a polyhedron surrounding each nonhydrogen atom within a protein. The faces of the polyhedron surrounding a given atom are projected to the surface of a sphere, and SASs and atom contacts are calculated from the surface areas of the projected faces (ref. 30; Fig. 1). The radius of the sphere is the atomic van der Waals radius plus the radius of a solvent molecule, giving a maximum sphere radius of 3.3 Å for the defined atom types. The theoretical maximum separation distance between two contacting atoms thus is 6.6 Å, although in practice the majority of contacts occur at <5-Å separation. In this representation, the sum of the SAS, covalent contacts, and noncovalent contacts is a constant for an atom of a given radius. The total atom–atom contact area gained on moving a solvent-exposed atom into the core of the protein is equal to the loss of SAS, and thus the SAS and atom–atom contact areas may be treated as comparable quantities.
Figure 1.

Definition of atom–atom contacts (shown in two dimensions for clarity). (Left) A Voronoi tessellation procedure is used to divide the protein into cells. The cell volume is restricted to within a sphere, which also defines the atom SAS. Atom–atom contacts are calculated from the projection of the cell faces to the surface of the sphere. (Right) The contact areas for atom A. This contact definition corrects for differences in cell size and partitions the surface between atom contacts and the SAS. (The figure was adapted from ref. 30.)
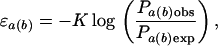
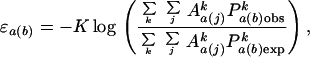
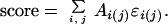
Contact potentials are derived from atom–atom contact preferences within the training set of experimentally determined structures. The contact data are transformed into a potential by using the log-odds distribution of contact area probabilities,
 |
1 |
where ɛa(b) is the potential for atom type a with contact type b, Pa(b)obs is the observed contact area probability, Pa(b)exp is the expected contact probability based on a random distribution, and K is a proportionality constant. Because we are concerned with only relative quantities, K is set to 1. For an isolated protein, Pa(b)obs is the fraction of the total nonbonded contact area of type a atoms with type b contacts,
 |
2 |
where Aa(b) is the total area of type a in contact with type b, and j is an index summing over all contact types, giving ∑j Aa(j) as the total nonbonded contact area for all type a atoms. The expected contact probability Pa(b)exp is estimated based on the distribution of contact areas within the protein and is equal to the ratio of total area in contact with type b to the sum of total available contacts,
 |
3 |
where i sums over all atom types and j sums over all contact types. ∑i Ai(b) thus is the sum of areas making contact with type b, and ∑i,j Ai(j) is the sum of all available nonbonded contact areas including solvent. The available solvent-contact area is estimated from the unfolded (reference) state. In this state, all noncovalently bonded atom surfaces are in contact with solvent, and the maximal solvent contact of the protein is equal to the sum of nonbonded surface areas for protein atoms. The available solvent-contact area therefore scales linearly with the protein size, and Pa(solvent)exp ≈ 0.5 for all atom types.
In calculating the scoring function from the training set, potentials were corrected for differences in composition between proteins. The potentials obtained from individual proteins were weighted according to the total area of the given atom type within the protein,
 |
4 |
where the index k indicates the kth protein in the training set. Contacts within a residue or between adjacent residues were not included in calculating contact areas and probabilities. The derived potentials are used to score protein and decoy structures, where the total score is the product of the atom-contact area and the potential coefficient, summed over all contact areas,
 |
5 |
If the functional unit of a protein is a dimer or higher-order oligomer, scores are calculated for both the fully solvated subunit and the subunit including contacts within the quaternary structure.
Identification of Putative Cation Sites.
If an ion site is scored in the absence of the ion, contacts between the ion-ligating atoms are frequently unfavorable and can bias scores away from the native structure. To reduce this source of error, a method was introduced to identify putative ion sites. Binding sites of the common constitutive cations Mg2+, Ca2+, Zn2+, Fe2+, and Fe3+ were tentatively located by using information generated by the Voronoi procedure used for scoring. If a vertex within the Voronoi tessellation occurred at the intersection of four ion-ligating atoms (defined as either four oxygens or any four of cys Sg, his Nd/Ne, asp Od1/Od2, or glu Oe1/Oe2), the vertex was treated as a putative ion site. Because contact scores for ions were not parameterized, a score was not assigned to an ion contact, but instead unfavorable contact scores between the ion-ligating atoms were set to zero. This method was used in scoring all decoys and native structures.
Protein Training Set.
An initial set of 1,520 proteins with <25% pairwise sequence identity was obtained from the September 2001 version of the PDB_select_25 list of representative protein structures (32). This set was reduced to 648 proteins by excluding structures with a resolution poorer than 2.5 Å or unknown resolution (i.e., NMR structures), those having R factors >0.24, or those with >4% heteroatoms or nonstandard residue atoms. Proteins with incomplete side chains or missing atoms also were omitted from the training set as well as proteins present within any of the decoy sets used for testing. All structures were obtained from the Protein Data Bank (29).
Decoy Test Sets.
Publicly available decoy sets were used to test the derived scoring function. The EMBL_misfold and CASP1 sets were obtained from the Prostar web site (http://prostar.carb.nist.gov), the lattice_ssfit, 4state_reduced, and lmds sets from the Decoys 'R' Us web sites (http://dd.stanford.edu and http://dd.compbio.washington.edu), and the Rosetta decoys from the Baker laboratory web site (http://depts.washington.edu/bakerpg). Additional decoy sets were generated from submissions to the Fourth Critical Assessment of Protein Structure Prediction, CASP4 (http://predictioncenter.llnl.gov/casp4) (33). These latter decoys are unlikely to be biased toward any particular scoring function, because the decoy structures represent the best models of numerous protein structure prediction teams using a variety of methods.
Target proteins were selected from the decoy sets by using similar criteria to that used for the training set. Targets were omitted if they did not have a corresponding x-ray crystal structure, had >10% difference in the number of atoms between target and decoy structures, or contained constitutive ligands (e.g., heme groups or iron-sulfur clusters). An exception is the inclusion of NMR target structures within the 4state and lattice_ssfit decoy sets to permit comparison with published data. The complete list of target structures used is shown in Table 2, which is published as supporting information on the PNAS web site, www.pnas.org. Root mean square deviations between native structures and decoys were calculated by using the PRO FIT protein structural alignment tool (34), if not provided with the decoy structures.
Clustering of Atom Types.
For presentation and comparison of atom-contact scores, a clustering algorithm was used to group atom types by similarity. The scores for each atom type i are treated as a vector ɛi = [ɛi(1), ɛi(j), … , ɛi(168)], and an area-weighted Cartesian distance was calculated for each pair of atom types,
 |
6 |
Distances were weighted by area to account for both differences in frequency and in nonbonded surface area. The distance measure dab was used in an iterative pairwise-clustering procedure to group side-chain atom types. The distance between two groups was taken as the maximum dab between members of the two groups, and the closest pair of groups was combined at each iteration. From an initial 167 groups of one atom per group, the clustering procedure was continued to give 12 final groups. Backbone atoms were not included in the clustering procedure.
Results
Contact Potentials.
The contact potentials ɛi(j) between protein atoms are presented in Fig. 2. The side-chain contact potentials were assigned to groups 2–13 based on similarity by using a Cartesian distance measure (Eq. 6). Group 14 represents solvent contact, and the potentials for backbone atoms Cα, C, N, and O are shown as averages (group 1). Factors affecting atom-contact preferences can be inferred from the clustering of atom types. As expected, atoms mostly grouped according to chemical similarity, with side-chain carbon atoms separating by residue hydrophobicity into predominantly hydrophobic (groups 2 and 3), predominantly hydrophilic (group 4), positively charged (group 11), and negatively charged (group 12). There was also an effect of position within the side chain, with hydrophobic atoms being split into those near the backbone (group 3) and near the side-chain terminus (group 2). Bonding arrangement had a noticeable effect, with the isolation of sp2 carbons bonded to three nonhydrogen atoms into groups 5, 6, and 9. Atom classes were not strictly divided by chemical similarity, with the mostly carbon-containing group 4 also having some of the less polar oxygen and nitrogen species. The influence of adjacent atoms within a side chain is seen within group 10, which contains mostly H-bond donor nitrogen and oxygen but also lys Cd and lys Ce due to the effect of the neighboring lys Nz.
Figure 2.

Calculated atom–atom contact potentials. Favorable contacts (blue) are shown as negative values, and unfavorable contacts (red) are shown as positive values, similar to energetic potentials. Backbone atom potentials are shown as averages, and side-chain atoms are grouped according to similarity. Groupings are for presentation purposes and are not used in calculating the scoring function.
The complete set of 167 × 168 contact potentials, subdivided by amino acid type, is presented in Table 3, which is published as supporting information on the PNAS web site.
Recognition of Native Protein Structures.
Table 1 summarizes the decoy testing data. The results are presented as the number of first-ranked native structures within the decoy sets and as the Z score (the difference between the native score and mean of the decoy set in standard deviations). For the five earlier decoy sets (EMBL_misfold, CASP1, 4state_reduced, lattice_ssfit, and lmds), the scoring function correctly identifies all native structures if contacts within the quaternary protein structure are considered. Although the quaternary structure provides a more accurate representation of native proteins, isolated subunits are more often the output of prediction algorithms. Therefore, the performance of the scoring function on isolated subunits was investigated. Within the earlier five decoy sets, 3 of 54 isolated native subunits (protein NDK from CASP1 and amino acid chains 1b0n-B and 1fc2-C from the lmds set) were not ranked first among the decoys. In the hexameric state of NDK, each subunit has a large portion of its surface (32%) in contact with other subunits, severely affecting the solvation component of the subunit score. (We note that in the absence of solvent interactions the function does rank the native subunit first.) Subunits 1b0n-B and 1fc2-C are both small chains of heterodimers, and the solvation score is poor for both structures in the absence of the larger chain. However, the scores of the subunits without the solvation component were insufficient to recognize the native structures; recognition required contacts with the larger subunit to be included in the score.
Table 1.
Performance of atom–atom contact scoring on decoy sets
| Decoy source | Average no. of decoys per target | Solvated subunits
|
Quaternary structure
|
||
|---|---|---|---|---|---|
| Rank 1 | Z score | Rank 1 | Z score | ||
| EMBL | 1 | 25 /25 | n/a | 25 /25 | n/a |
| CASP1 | 7 | 5 /6* | 2.4 | 6 /6 | 3.7 |
| 4state | 665 | 7 /7 | 3.9 | 7 /7 | 4.1 |
| lattice_ssfit | 2,000 | 8 /8 | 8.2 | 8 /8 | 9.2 |
| lmds | 453 | 6 /8* | 5.0 | 8 /8 | 7.8 |
| Rosetta | 1,042 | 19 /23* | 3.6 | 21 /23† | 4.4 |
| CASP4 | 53 | 23 /27* | 2.6 | 26 /27† | 3.0 |
| Totals | 103 /114 | 111 /114 | |||
Average Z scores are calculated as the distance from the score of the native structure to the mean score of the decoy set in standard deviations. Scores were calculated for both solvated subunits and the subunit including quaternary contacts.
Missed subunits: CASP1, NDK; lmds, 1b0n-B and 1fc2-C; Rosetta, 1gvp, 1msi, 1utg, and 5icb; CASP4, T0098, T0106, T0118, and T0123.
Missed quaternary structures: Rosetta, 1msi and 5icb; CASP4, T0123.
The results from the CASP4 and Rosetta decoy sets (Figs. 3 and 4) also show quaternary structure to be important in native structure recognition. The total number of missed first-rank targets decreases from 8 of 50 to 3 of 50 when contacts between subunits are included (Table 1). Thus, desolvation and/or intersubunit contacts contribute to the stability of the multimeric targets T0098, T0106, and T0118 (Fig. 3) and proteins 1gvp and 1utg (Fig. 4). The three native quaternary structures that were not ranked first by the scoring function are 1msi (Rosetta), 5icb (Rosetta), and T0123 (CASP4), although in the last case the best scoring decoy had the same fold as the native structure.
Figure 3.

Atom–atom contact scores for all-atom CASP4 decoys. For dimers and higher-order structures, native proteins are scored both as the solvated subunit and as the subunit within the quaternary structure, with the quaternary structure score lower on the y axis.
Figure 4.

Atom–atom contact scores for Rosetta decoys. For dimers and higher-order structures, native proteins are scored as both the solvated subunit and as the subunit within the quaternary structure, with the quaternary structure score lower on the y axis.
Figs. 3 and 4 indicate that in both the CASP4 and Rosetta data sets, there are relatively few globally near-native decoy structures. Only 9 of the 23 Rosetta sets tested and 7 of 27 CASP4 sets tested contained decoys within 5-Å Cα root mean square deviation of the native structures. Of the latter, all had homologous structures from which to construct decoys, providing a greater degree of sampling in the vicinity of the native structure. These seven CASP4 targets, T0111 (1e9i), T0112 (1e3j), T0113 (1e3w), T0117 (1j90), T0122 (1geq), T0123 (1exs), and T0125 (1gak), also had their highest-ranked decoy within 5 Å root mean square deviation of the native structure (Fig. 3).
Discussion
The contact-based scoring function was able to distinguish native proteins from corresponding decoy structures with a high degree of accuracy. Consideration of intersubunit contacts was important for a number of targets, and it is likely that the structures of these subunits are partly determined by contacts within the quaternary structure. The presented methodology is distinct from scoring functions currently used with protein-folding algorithms, and as such it can provide an independent test of putative protein models.
Three of 114 native structures, 1msi (CASP4), 5icb (Rosetta), and 1exs (Rosetta), were not ranked first among the decoys. There is no common structural feature shared by these proteins that would explain why these structures were not top-ranked. 1msi is a small antifreeze protein (35) with little helical or β-sheet structure. The protein has a planar face with evenly spaced atoms capable of forming hydrogen bonds with an ice lattice, mostly from the protein backbone. 1exs is an unusual β-sheet dimer, in which the amino acid chains from each subunit intertwine in the interface between them. This would explain the poor score of the isolated monomers, because the intertwined portion of the chain would be mostly solvated, but it does not explain why the dimer was ranked second among the decoys. 5icb (calbindin) is a calcium-binding protein, containing two Ca2+ ions in the native structure. It is possible that the removal of negative contact scores for atoms surrounding the Ca2+ ions was insufficient to account for the effect of the ion. In general, the use of the ion site locating procedure slightly improved the numerical score of the native structure but did not affect the native ranking for structures other than 5icb.
It is somewhat surprising that the scoring function is as accurate as it is, given that only a single coefficient is used to quantify a given atom contact. No explicit energetic terms are used, and only short-range interactions are considered. The accuracy of the method may be due to the correlation of solvation/desolvation energies with SAS areas. It is possible that the area-based methodology provides a better quantification of hydrophobic interactions than analogous distance-based methodologies.
A possible area for improvement of the scoring function is the estimation of interactions for polar or highly spatially constrained atoms such as backbone oxygen and nitrogen. The calculated contact potentials for backbone atoms are more likely to be an artifact of structural constraints than a reflection of energetic interactions. Although structural constraints are an important consideration, a better estimation of energetic interactions for these atoms could improve results, particularly for atypical structures such as the antifreeze protein 1msi.
The presented scoring function is an intermediate resolution potential. An all-atom representation of protein structures is used, but there is insufficient detail within the scoring function to determine precise interatomic distances. It may be possible to combine the form of this function with a van der Waals type potential, resulting in a potential that can optimize interatomic distances as well as atom–atom contacts. The addition of a short-range repulsive interaction such as this would also permit the scoring function to be used in dynamic procedures such as minimization and structural refinement. Validation of hybrid potentials such as these will require additional decoy sets with a high degree of sampling in the vicinity of the native structure.
Supplementary Material
Abbreviation
- SAS
solvent-accessible surface
Footnotes
This paper was submitted directly (Track II) to the PNAS office.
References
- 1.Baldwin R L. Nat Struct Biol. 1999;6:814–817. doi: 10.1038/12268. [DOI] [PubMed] [Google Scholar]
- 2.Lee B, Richards F M. J Mol Biol. 1971;55:379–400. doi: 10.1016/0022-2836(71)90324-x. [DOI] [PubMed] [Google Scholar]
- 3.Eisenberg D, McLachlan A D. Nature. 1986;319:199–203. doi: 10.1038/319199a0. [DOI] [PubMed] [Google Scholar]
- 4.Qiu D, Shenkin P S, Hollinger F P, Still W C. J Phys Chem A. 1997;101:3005–3014. [Google Scholar]
- 5.Dominy B N, Brooks C L. J Phys Chem B. 1999;103:3765–3773. [Google Scholar]
- 6.Liu Y, Beveridge D L. Proteins. 2002;46:128–146. doi: 10.1002/prot.10020. [DOI] [PubMed] [Google Scholar]
- 7.Lazaridis T, Karplus M. J Mol Biol. 1999;288:477–487. doi: 10.1006/jmbi.1999.2685. [DOI] [PubMed] [Google Scholar]
- 8.Lazaridis T, Karplus M. Curr Opin Struct Biol. 2000;10:139–145. doi: 10.1016/s0959-440x(00)00063-4. [DOI] [PubMed] [Google Scholar]
- 9.Vorobjev Y N, Almagro J C, Hermans J. Proteins. 1998;32:399–413. [PubMed] [Google Scholar]
- 10.Samudrala R, Moult J. J Mol Biol. 1998;275:895–916. doi: 10.1006/jmbi.1997.1479. [DOI] [PubMed] [Google Scholar]
- 11.Lu H, Skolnick J. Proteins. 2001;44:223–232. doi: 10.1002/prot.1087. [DOI] [PubMed] [Google Scholar]
- 12.Tobi D, Elber R. Proteins. 2000;41:40–46. [PubMed] [Google Scholar]
- 13.Miyazawa S, Jernigan R L. J Mol Biol. 1996;256:623–644. doi: 10.1006/jmbi.1996.0114. [DOI] [PubMed] [Google Scholar]
- 14.Betancourt M R, Thirumalai D. Protein Sci. 1999;8:361–369. doi: 10.1110/ps.8.2.361. [DOI] [PMC free article] [PubMed] [Google Scholar]
- 15.Xia Y, Levitt M. J Chem Phys. 2000;113:9318–9330. [Google Scholar]
- 16.Pillardy A, Czaplewski C, Liwo A, Lee J, Ripoll D R, Kazmierkiewicz R, Oldziej S, Wedemeyer W J, Gibson K D, Arnautova Y A, et al. Proc Natl Acad Sci USA. 2001;98:2329–2333. doi: 10.1073/pnas.041609598. [DOI] [PMC free article] [PubMed] [Google Scholar]
- 17.Melo F, Feytmans E. J Mol Biol. 1997;267:207–222. doi: 10.1006/jmbi.1996.0868. [DOI] [PubMed] [Google Scholar]
- 18.Zhang C, Vasmatzis G, Cornette J L, DeLisi C. J Mol Biol. 1997;267:707–726. doi: 10.1006/jmbi.1996.0859. [DOI] [PubMed] [Google Scholar]
- 19.Domingues F S, Koppensteiner W A, Jaritz M, Prlic A, Weichenberger C, Wiederstein M, Floeckner H, Lackner P, Sippl M J. Proteins. 1999;37, Suppl. 3:112–120. [PubMed] [Google Scholar]
- 20.Simons K T, Ruczinski I, Kooperberg C, Fox B A, Bystroff C, Baker D. Proteins. 1999;34:82–95. doi: 10.1002/(sici)1097-0134(19990101)34:1<82::aid-prot7>3.0.co;2-a. [DOI] [PubMed] [Google Scholar]
- 21.BenNaim A. J Chem Phys. 1997;107:3698–3706. [Google Scholar]
- 22.Bonneau R, Baker D. Annu Rev Biophys Biomol Struct. 2001;30:173–189. doi: 10.1146/annurev.biophys.30.1.173. [DOI] [PubMed] [Google Scholar]
- 23.Holm L, Sander C. J Mol Biol. 1992;225:93–105. doi: 10.1016/0022-2836(92)91028-n. [DOI] [PubMed] [Google Scholar]
- 24.Park B, Levitt M. J Mol Biol. 1996;258:367–392. doi: 10.1006/jmbi.1996.0256. [DOI] [PubMed] [Google Scholar]
- 25.Xia Y, Huang E S, Levitt M, Samudrala R. J Mol Biol. 2000;300:171–185. doi: 10.1006/jmbi.2000.3835. [DOI] [PubMed] [Google Scholar]
- 26.Fain B, Xia Y, Levitt M. IBM J Res Dev. 2001;45:525–532. [Google Scholar]
- 27.Gatchell D W, Dennis S, Vajda S. Proteins. 2000;41:518–534. [PubMed] [Google Scholar]
- 28.Dominy B N, Brooks C L. J Comput Chem. 2000;23:147–160. doi: 10.1002/jcc.10018. [DOI] [PubMed] [Google Scholar]
- 29.Berman H M, Westbrook J, Feng Z, Gilliland G, Bhat T N, Weissig H, Shindyalov I N, Bourne P E. Nucleic Acids Res. 2000;28:235–242. doi: 10.1093/nar/28.1.235. [DOI] [PMC free article] [PubMed] [Google Scholar]
- 30.McConkey B J, Sobolev V, Edelman M. Bioinformatics. 2002;18:1365–1373. doi: 10.1093/bioinformatics/18.10.1365. [DOI] [PubMed] [Google Scholar]
- 31.Preparata F P, Shamos M I. In: Computational Geometry: An Introduction (Texts and Monographs in Computer Science) Gries D, editor. New York: Springer; 1985. [Google Scholar]
- 32.Hobohm U, Sander C. Protein Sci. 1994;3:522–524. doi: 10.1002/pro.5560030317. [DOI] [PMC free article] [PubMed] [Google Scholar]
- 33.Zemla A, Venclovas E, Moult J, Fidelis K. Proteins. 2001;45, Suppl. 5:13–21. doi: 10.1002/prot.10052. [DOI] [PubMed] [Google Scholar]
- 34.Martin A C D. PRO FIT, Protein Least Squares Fitting. Reading, U.K.: SciTech Software; 1992. [Google Scholar]
- 35.Jia Z C, DeLuca C I, Chao H M, Davies P L. Nature. 1996;384:285–288. doi: 10.1038/384285a0. [DOI] [PubMed] [Google Scholar]
Associated Data
This section collects any data citations, data availability statements, or supplementary materials included in this article.