Abstract
The mammalian securin, pituitary tumor transforming gene (PTTG), regulates sister chromatid separation during mitosis. Mice or cell lines deficient in PTTG expression, however, are surprisingly viable. Here we show that PTTG disruption in mice (PTTG−/−) severely impairs glucose homeostasis leading to diabetes during late adulthood, especially in males associated with nonautoimmune insulinopenia and reversed alpha/beta cell ratio. Islet beta cell mass in PTTG−/− mice was already diminished before development of frank diabetes and only increased minimally during growth. BrdUrd incorporation of islet cells in PTTG-null mice was ≈65% lower (P < 0.005) than in the WT pancreas, whereas apoptosis rates were similar. PTTG−/− beta cells had pleiotropic nuclei, suggesting defects in cell division. The results indicated that securin is indispensable for normal pancreatic beta cell proliferation.
Pituitary tumor transforming gene (PTTG) was initially isolated from rat pituitary tumor cells and is functionally homologous to yeast securin (1, 2). Securin proteins together with separin and cohesin regulate sister chromatid separation during M phase of the cell cycle (2, 3). Securin accumulation and binding to separin during interphase and early mitosis prevents premature separin activation. During the normal cell cycle, the anaphase promoting complex eventually degrades securin, thus activating separin to facilitate equal chromosome segregation. In this sense, securin functions as an inhibitor of chromatid separation during anaphase (2, 3). Because securin is a highly conserved protein, and appears to be critical for cell division, it is surprising that PTTG loss seems not to be detrimental for mammalian cell survival; inactivation of human securin in a karyotypically stable colorectal cancer cell line resulted in a higher chromosome loss rate, whereas the cells remained viable (4). Securin PTTG−/− mice generated in our laboratory are viable and fertile despite PTTG−/− mouse embryo fibroblasts (MEFs) showing abnormal chromosome structure and aneuploidy in some cells (5).
In this report, we show that securin is indispensable for pancreatic beta cell proliferation. Islet beta cell mass is smaller and grows at a much lower rate in PTTG−/−mice, especially males, in which diabetes develops in late adulthood. In addition, ≈3% of beta cells in PTTG−/− mice are macronuclear, suggesting defects in cell division. The results demonstrate that securin plays a critical role in maintaining pancreatic beta cell division.
Materials and Methods
Animals.
Securin PTTG−/− mice have been described (5) and are kept in a hybrid background derived from C57/BL6 and 129SvJ mouse strains. Animals were housed in a 12-h dark/light cycle and fed standard chow ad libitum. Mice aged 2–13 mo were used for experiments. Food intake and urine production were measured in metabolic cages.
Blood Sample Assays.
Fasting blood glucose was measured using a DEX glucometer (Bayer). Serum concentrations of insulin and C-peptide were measured using RIA kits (Linco Research Immunoassay, St. Charles, MO).
Intraperitoneal Insulin and Glucose Tolerance Test.
For glucose tolerance testing, mice were fasted 14 h before i.p. glucose injection (1 g/kg of body weight) and blood collected from the tail vein at the indicated time points. For insulin tolerance testing, mice were fasted 6 h before i.p. insulin injection (1 unit/kg of body weight), and blood was collected at the indicated time points.
Histological, Immunohistological, and Morphometric Analysis.
Tissues including pancreata and epididymal fat pads were isolated and weighed at the indicated age and fixed in 10% formalin overnight, from which slide sections were obtained for hematoxylin/eosin staining. For immunohistological analysis, streptavidin-biotin peroxidase complex method was used (Dako) with rabbit Abs against insulin, glucagon, somatostatin, and pancreatic polypeptide (American Histolabs, Gaithersburg, MD). For morphometrical islet analysis, 40–60 serial 5-μm sections were stained with hematoxylin/eosin and photographed using an Olympus digital camera at a final magnification of ×40. Images were analyzed using photoshop (Adobe Systems, San Jose, CA) to quantify the islet cross-sectional area vs. total pancreas cross-sectional area.
Assays for Islet Cell Proliferation.
For BrdUrd labeling, mice were injected with 50 μg of BrdUrd (Sigma) per gram of body weight and killed 24 h later. Pancreatic tissue sections (5 μm) were stained for BrdUrd and counterstained with hematoxylin (6). Beta cell nuclear morphology was visualized in tissue sections double stained for insulin [guinea pig antiinsulin (Linco Research Immunoassay) and anti-guinea pig rhodamine (Jackson ImmunoResearch)] and DNA (Hoechst 33342).
Isolated Islet Studies.
Pancreatic islets were isolated as described (7), handpicked after collagenase digestion, and cultured in RPMI medium 1640 with 5 mM glucose and 10% FBS. Insulin secretion was measured in supernatants and islet DNA measured by fluoremetric analysis using Hoechst 33258 reagent.
Results
PTTG−/− Males Exhibit Hyperglycemia and Lipodystrophy.
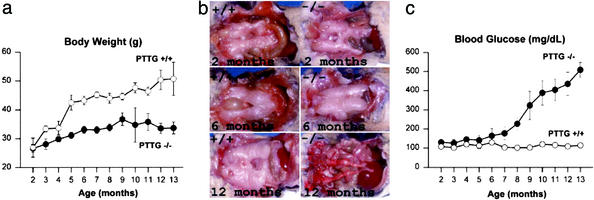
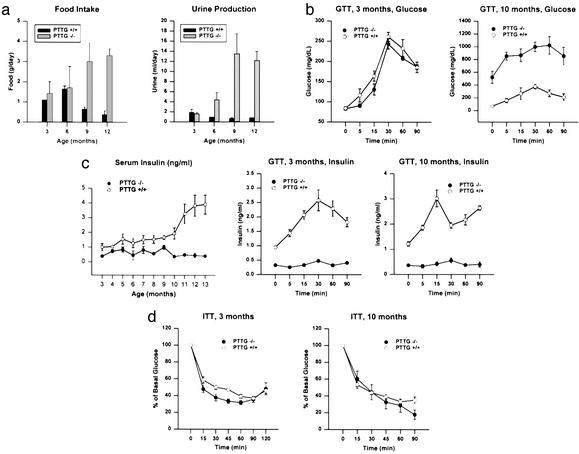
We previously reported that, for up to 6 mo, PTTG−/− mice were fertile but exhibited testicular and splenic hypoplasia. Under continued observation, PTTG−/− males showed a leaner phenotype than WT mice and exhibited no significant further weight gain (Fig. 1a). Epididymal fat pad mass in PTTG−/− males were similar until ≈6 mo of age and then showed loss (0.24, 0.46, and 0.08 g for PTTG−/− males vs. 0.28, 0.47, and 0.82 g for WT mice at 2, 6, and 12 mo, respectively; Fig. 1b). Fasting blood glucose levels began increasing in PTTG−/− males after 6 mo, and >80% of PTTG−/− males had fasting blood glucose levels >150 mg/dl at 9 mo of age, with values reaching as high as 650 mg/dl (Fig. 1c). In PTTG−/− female mice, however, body weight gain was comparable to that of WT females and fasting blood glucose levels largely normal (3 of 82 females between 8 and 12 mo old had fasting glucose levels between 140 and 220 mg/dl). PTTG−/− mice exhibited increased food uptake and polyuria concurrently with hyperglycemia (Fig. 2a), but no ketoacidosis was observed and mice were viable without insulin treatment despite profound hyperglycemia. Glucose tolerance tests confirmed defects in glucose metabolism in aged (10 mo) male PTTG−/− mice (Fig. 2b).
Figure 1.
Metabolic changes in securin deficient males. (a) Body weights of securin+/+ and PTTG−/− males. Values are expressed as mean ± SE from six to eight securin+/+ and PTTG−/− mice at each age point (P < 0.05). (b) Epididymal fat pad morphology in securin+/+ and PTTG−/− males. Three to five mice were observed at the indicated age, and representative comparative images are depicted. (c) Hyperglycemia development in PTTG−/− males. Values are expressed as mean ± SE from six to eight WT and PTTG−/− mice at each age point (P < 0.05).
Figure 2.
PTTG−/− mice are diabetic. (a) Food intake and urine production in WT and PTTG−/− males. Values are expressed as mean ± SE for four to five males at each age point for each genotype (P < 0.05). This experiment was repeated twice with similar results. (b) Abnormal glucose tolerance test in PTTG−/− mice. Mice aged 3 and 10 mo were injected with 1 g/kg glucose, i.p. (time 0), after overnight fasting. Blood glucose values were measured at the indicated time points. Data represent mean ± SE for five males from each genotype (P < 0.05). This experiment was repeated once with similar results. (c) PTTG−/− mice have decreased insulin production but normal insulin sensitivity. Serum insulin was also measured during glucose loading. Data represent mean ± SE for four to five males at each age point for each genotype (P < 0.05). (d) Insulin sensitivity as measured by insulin tolerance test (ITT). Mice aged 3 and 10 mo were injected with 1 unit/kg insulin, i.p. (time 0), after overnight fasting. Blood glucose values were measured at indicated time points. Data represent mean ± SE for five males from each genotype (P < 0.05). The experiment was repeated with similar results.
Decreased Insulin Levels and Normal Insulin Sensitivity in PTTG−/− Mice.
To determine whether the observed hyperglycemia in male PTTG−/− mice was due to decreased insulin production and/or insulin resistance, insulin was measured and insulin tolerance tested. Fasting insulin levels were lower (≈60% of WT) at the earliest test point (3 mo) in PTTG−/− males (Fig. 2c). Although insulin levels continued to rise with age in WT males, in PTTG−/− males levels remained low through 12 mo (<15% of those observed in WT males). Glucose tolerance testing (GTT) showed that although insulin was induced by glucose stimulation in WT mice, insulin levels were essentially unchanged by glucose in PTTG−/− mice (Fig. 2d). Circulating C-peptide levels were lower in PTTG−/− males. At 5 mo, WT C-peptide levels (940 ± 153 pM) were >4-fold PTTG−/− levels (188 ± 74 pM) (P < 0.002). At 8 mo, WT C-peptide (821 ± 141 pM) remained persistently higher than PTTG−/− levels (103 ± 55 pM) (P < 0.009). Insulin sensitivity as assessed by insulin tolerance tests in both younger and older PTTG−/− males with hyperglycemia was similar to that of WT mice (Fig. 3b). These results indicate that the hyperglycemia in PTTG−/− male mice was due to absolute decreased insulin production rather than to insulin resistance or to relatively low insulin levels in the presence of increased glucose production. To further assess the gender-selectivity of hyperglycemia, female PTTG−/− mice aged 6 mo were tested. After oophorectomy, PTTG−/− female mice developed fasting hyperglycemia (418 ± 32 mg/dl) (Table 1). Gonadectomy of male PTTG−/− mice did not alter blood sugar levels for up to 5 mo.
Figure 3.
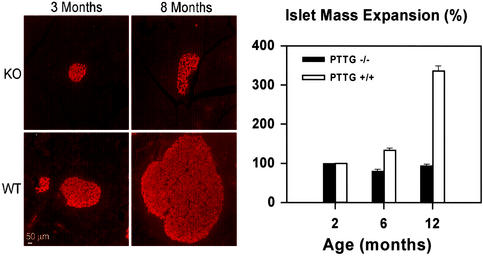
Pancreatic islet mass expansion. (Left) Insulin immunofluorescence of pancreas sections derived from WT and PTTG−/− males aged 3 and 8 mo. (Right) Comparison of islet mass expansion at 2, 6, and 12 mo in WT and PTTG−/− males. Data represent mean ± SE for three males at the indicated ages for each genotype.
Table 1.
Fasting blood glucose levels in female mice
| Control
|
Oophorectomy
|
||
|---|---|---|---|
| WT, n = 5 | PTTG−/−, n = 5 | WT, n = 3 | PTTG−/−, n = 3 |
| 154 ± 17 | 147 ± 12 | 91 ± 10 | 418 ± 32* |
WT and PTTG−/− mice were oophorectomized at 4 wk, and overnight fasting blood sugar was measured at 6 mo (*, P < 0.005).
PTTG−/− Male Mice Exhibit Decreased Beta Cell Mass.
Low circulating insulin levels could arise as a consequence of reduced pancreatic weight, islet number, or beta cell mass, or by decreased beta cell insulin content or release. In PTTG−/− hyperglycemic males, pancreatic weight did not differ from WT mice when normalized for body weight (data not shown). Pancreatic sections showed smaller islets derived from PTTG−/− males than WT islets at 6 mo. Islet mass did not appear to expand, although islet number was similar to those observed at younger ages (Fig. 3): At 2, 6, and 12 mo of age, PTTG−/− male islets are ≈3.2%, 2.6%, and 2.7% of total pancreatic mass vs. 3.4%, 5.3%, and 13.4% for WT islets (n = 4, P < 0.05). Although WT mouse islets have an average mass expansion of 134% and 337% at 6 and 12 mo compared to those aged 2 mo, PTTG−/− islets only retain 81% and 95% of their original mass at 6 and 12 mo compared to that of 2 mo, suggesting reduced islet expansion capacity despite an increased insulin demand in the null mice. Indeed, PTTG−/− islets had diminished immunoreactive insulin content and increased glucagon content, thus resulting in a lower beta/alpha cell ratio.
Impaired Beta Cell Proliferation in PTTG−/− Mice.
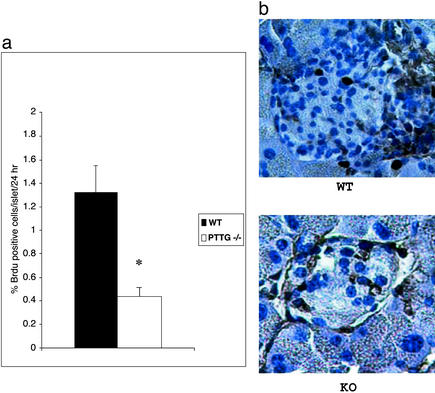
To determine whether the decreased islet beta cell mass is due to defective proliferation or increased apoptosis, BrdUrd incorporation (Fig. 4) was measured in 30- to 40-day-old WT and PTTG−/− mice. Lower proliferation rate was detected in PTTG−/− islets (P < 0.005). Nuclear morphology as assayed by fluorescence microscopy, electron microscopy, and terminal deoxynucleotidyltransferase-mediated UTP end labeling staining did not show evidence for beta cell apoptosis in WT or PTTG−/− mice (data not shown). Because reduced islet cell proliferation is associated with decreased insulin immunoreactivity, securin deficiency appears to primarily cause defective beta cell proliferation.
Figure 4.
Pancreatic islet cell proliferation rate. (a) Reduced islet cell proliferation in PTTG-null mice. Each value represents mean percentage ± SEM of BrdUrd-positive cells in a total of 200 WT and 200 PTTG−/− islets obtained from three WT and four PTTG-null mice 30–40 days old. *, P < 0.005. (b) BrdUrd immunostaining of pancreatic islets. Positive cells have dark nuclei.
Pleiotropic Beta Cell Nuclei in PTTG−/− Mice.
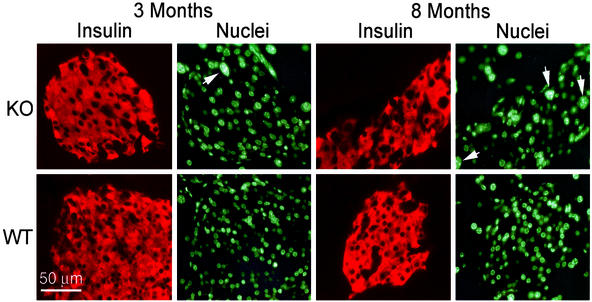
The nuclear morphology of PTTG−/− beta cells differed from that of WT (Fig. 5). Notably, some beta cells (≈3%) were much larger with macronuclei, multiple nucleoli, and absent intranuclear septa. Beta cell macronuclei were already present in 3-mo-old PTTG−/− mice and were more frequent in 8-mo-old mice. In contrast, no such macronuclear beta cells were seen in the WT pancreas.
Figure 5.
Pleiotropic beta cell nuclei in PTTG−/− islets. Islets of WT and securin−/− mice at 3 and 8 mo were stained with a guinea pig Ab to insulin and goat anti-guinea pig Rhodamine (red) and nuclei counterstained with Hoechst 33342 (green). Macronuclei are indicated by arrowheads.
Insulin secretion by isolated PTTG−/− islets was 13 pg per islet per h (range 70–280 pg per well) as compared to 53 pg per islet per h (range 162–960 pg per well) for WT (not significant). Thus, reduced beta cell mass appears to be the primary contributor to the low circulating insulin levels.
Discussion
Securin is an integral component of the mitotic mechanism, and conceptually mitotic chaos should ensue when securin function is absent (3, 5). Because cells and mice devoid of securin are indeed viable, a second mechanism for sister chromatid cohesion has been suggested (8). In this report, we demonstrate that securin-null mice have profound defects on pancreatic beta cell proliferation and abnormal nuclear morphology. Thus illustrating that any compensatory mechanisms for sister chromatid separation are not sufficient for maintaining beta cell proliferation and subsequent intact islet cell function.
Beta cell proliferation is governed by intrinsic beta cell genetic programs, growth factors, and hormones. Several mouse models exhibit reduced islet numbers and/or volume and/or beta cell mass decrease, including IRS-2−/− mice (9), S6K1−/− mice (10), and dominant-negative FGFR1c-overexpressing (FRID1) mice (11). Beta cell proliferation is stimulated by hormones and growth factors including growth hormone (GH), prolactin, glucagon like peptide-1, insulin-like growth factors and parathyroid hormone-related protein (12). It appears that securin in the natural environment plays a permissive role in islet cell proliferation and morphology. PTTG−/− beta cells exhibit macronuclei similar to those observed in PTTG−/− mouse embryonic fibroblasts (5), and these changes have not been reported in models of growth factor defects. Although PTTG induces basic fibroblast growth factor in vitro (13, 14), PTTG−/− mice do not exhibit gross physiological abnormalities, have normal insulin-like growth factor-1 and thyroid hormone levels, and are fertile (5). Thus it is unlikely that pituitary-dependent growth factors alter beta cell mass in these animals.
It is not clear why beta cells are apparently selectively affected by securin deficiency. Beta cells undergo a proliferation phase before the end of the first postnatal month, when the pancreas is subject to dynamic changes in response to variations in insulin demand (15). Beta cell replication rates decrease from a perinatal high of ≈18% new cells per day to ≈7% at 1 mo of age and 2–3% per day in adulthood. The beta cell population is maintained in a delicate balance of beta cell formation (neogenesis and proliferation) and beta cell death (senescence, apoptosis, and necrosis) (16). A diabetes-prone strain of Zucker fatty rat does not increase beta cell mass adequately in the face of insulin resistance, demonstrating that beta cell mass expansion is an essential component of compensatory mechanisms required to maintain normal glucose tolerance. In this regard, securin loss and resultant abnormal cell cycle progression may directly affect beta cell mass expansion resulting in diabetes.
Securin-deficient diabetes is sexually dimorphic and exhibits high (>80%) hereditary penetrance in males observed for up to 16 mo. Sexually dimorphic hyperglycemia has been reported; TallyHo mice with noninsulin dependent diabetic mellitus showed male-restricted hyperglycemia (17); IR/IRS-1/IRS-2 triple heterozygous mice developed insulin resistance and diabetes almost exclusively in males (18); and pancreatic IDX-1-deficient mice also showed male-restricted hyperglycemia (19). As oophorectomized PTTG−/− female mice exhibit fasting hyperglycemia, it is likely that estrogen might be protective for islet maintenance and or insulin action in these models. These results indicate that securin loss predisposes male mice to diabetes, and additional nongenetic factors may also contribute to hyperglycemia development in these mice.
In conclusion, although mice or cell lines deficient in PTTG expression are viable, PTTG disruption results in intrinsic impairment of pancreatic beta cell proliferation and diabetes. These results suggest that securin function is critical for normal beta cell proliferation and securin plays a permissive role in glucose metabolism.
Acknowledgments
We thank Ida Chen and HongXiang Hui for helpful suggestions, and SongGuang Ren, LiHua Xia, Kiwon Kim, and Fabio Rotondo for technical help. This work was supported by the Doris Factor Molecular Endocrinology Laboratory, National Institutes of Health Grant CA75979, and the Lilly Pituitary Scholars Award (to R.Y.).
Abbreviation
- PTTG
pituitary tumor transforming gene
References
- 1.Pei L, Melmed S. Mol Endocrinol. 1997;11:433–441. doi: 10.1210/mend.11.4.9911. [DOI] [PubMed] [Google Scholar]
- 2.Zou H, MaGarry T J, Bernal T, Kirschner M W. Science. 1999;285:418–422. doi: 10.1126/science.285.5426.418. [DOI] [PubMed] [Google Scholar]
- 3.Nasmyth K, Peters J, Uhlmann F. Science. 2000;288:1379–1384. doi: 10.1126/science.288.5470.1379. [DOI] [PubMed] [Google Scholar]
- 4.Jallepalli P V, Waizenegger I C, Bunz F, Langer S, Speicher M R, Peters J M, Kinzler K W, Vogelstein B, Lengauer C. Cell. 2001;105:445–457. doi: 10.1016/s0092-8674(01)00340-3. [DOI] [PubMed] [Google Scholar]
- 5.Wang Z, Yu R, Melmed S. Mol Endocrinol. 2001;15:1870–1879. doi: 10.1210/mend.15.11.0729. [DOI] [PubMed] [Google Scholar]
- 6.Graztner H G. Science. 1982;218:474–475. doi: 10.1126/science.7123245. [DOI] [PubMed] [Google Scholar]
- 7.McDaniel M L, Colca J R, Kotagal N, Lacy P E. Methods Enzymol. 1983;98:182–200. doi: 10.1016/0076-6879(83)98149-1. [DOI] [PubMed] [Google Scholar]
- 8.Stemmann O, Zou H, Gerber S A, Gygi S P, Kirschner M W. Cell. 2001;107:715–726. doi: 10.1016/s0092-8674(01)00603-1. [DOI] [PubMed] [Google Scholar]
- 9.Bruning J C, Winnay J, Bonner-Weir S, Taylor S I, Accili D, Kahn C R. Cell. 1997;88:561–572. doi: 10.1016/s0092-8674(00)81896-6. [DOI] [PubMed] [Google Scholar]
- 10.Pende M, Kozma S C, Jaquet M, Oorschot V, Burcelin R, Le Marchand-Brustel Y, Klumperman J, Thorens B, Thomas G. Nature. 2000;408:994–997. doi: 10.1038/35050135. [DOI] [PubMed] [Google Scholar]
- 11.Hart A W, Baeza N, Apelqvist A, Edlund H. Nature. 2000;408:864–868. doi: 10.1038/35048589. [DOI] [PubMed] [Google Scholar]
- 12.Garcia-Ocana A, Vasavada R C, Takane K K, Cebrian A, Lopez-Talavera J C, Stewart A F. J Clin Endocrinol Metab. 2001;86:984–988. doi: 10.1210/jcem.86.3.7315. [DOI] [PubMed] [Google Scholar]
- 13.Zhang X, Horwitz G A, Heaney A P, Nakashima M, Prezant T R, Bronstein M D, Melmed S. J Clin Endocrinol Metab. 1999;84:761–767. doi: 10.1210/jcem.84.2.5432. [DOI] [PubMed] [Google Scholar]
- 14.Heaney A P, Horwitz G A, Wang Z, Singson R, Melmed S. Nat Med. 1999;5:1317–1321. doi: 10.1038/15275. [DOI] [PubMed] [Google Scholar]
- 15.Scaglia L, Cahill C J, Finegood D T, Bonner-Weir S. Endocrinology. 1997;138:1736–1741. doi: 10.1210/endo.138.4.5069. [DOI] [PubMed] [Google Scholar]
- 16.Tokuyama Y, Sturis J, DePaoli A M, Takeda J, Stoffel M, Tank J, Sun X, Polonsky K S, Bell G I. Diabetes. 1995;44:1447–1457. doi: 10.2337/diab.44.12.1447. [DOI] [PubMed] [Google Scholar]
- 17.Kim J H, Sen S, Avery C S, Simpson E, Chandler P, Nishina P M, Churchill G A, Naggert J K. Genomics. 2001;74:273–286. doi: 10.1006/geno.2001.6569. [DOI] [PubMed] [Google Scholar]
- 18.Kido Y, Burks D J, Withers D, Bruning J C, Kahn C R, White M F, Accili D. J Clin Invest. 2000;105:199–205. doi: 10.1172/JCI7917. [DOI] [PMC free article] [PubMed] [Google Scholar]
- 19.Thomas M K, Devon O N, Lee J H, Peter A, Schlosser D A, Tenser M S, Habener J F. J Clin Invest. 2001;108:319–329. doi: 10.1172/JCI12029. [DOI] [PMC free article] [PubMed] [Google Scholar]


