Abstract
Using an automated scanning microscope, we report the surprising result that individual dormant spores of Bacillus thuringiensis grow and shrink in response to increasing and decreasing relative humidity. We simultaneously monitored the size of inorganic calibration particles. We found that the spores consistently swell in response to increased relative humidity, and shrink to near their original size on reexposure to dry air. Although the dispersion of swelling amplitudes within an ensemble of spores is wide (≈30% of the average amplitude), amplitudes for individual spores are highly correlated between different swelling episodes, suggesting that individual spores respond consistently to changes in humidity. We find evidence for two distinct time scales for swelling: one with a time scale of no more than ≈50 s, and another with a time scale of ≈8 min. We speculate that these two mechanisms may be due to rapid diffusion of water into the spore coat + cortex, followed by slower diffusion of water into the spore core, respectively. Humidity-dependent swelling may account for the greater kill effectiveness of spores by gas-phase chlorine dioxide, formaldehyde, and ethylene oxide at very high relative humidity.
In the aftermath of the anthrax attacks in Fall 2001, we looked into measurable physical properties of bacterial endospores that might distinguish Bacillus anthracis from other species. This led to two striking discoveries: The first, which we report in this paper, is that dormant spores are not entirely static but rapidly swell and shrink in response to increases and decreases in relative humidity (RH), with interesting biological implications. The second, which we report in a subsequent paper, is that, when RH and temperature are held constant, accurate measurements of sizes of Bacillus spores can discriminate among species.
It has long been known from the high refractive index of spores that the core has a low water content. Neihof et al. (1) measured water sorption and desorption of both freeze-dried and crushed Bacillus subtilis spores as a function of RH. From the sigmoid shape, hysteresis, and similar behavior of normal and crushed spores, they inferred that swelling accompanies sorption and that an anhydrous spore core is not maintained by a water permeability barrier.
Studies of the inverse correlation between spore heat resistance and water content have led to the present view that an osmotic pressure within the spore is responsible for maintaining the partly dry core (2, 3). The requisite tension and pressure are thought to be generated in the cortex by peptidoglycan, initially polymerized in an ordered tightly packed conformation, fixed by cross-linking of the glycan chains (3). From experiments with deuterated water, Marshall and Murrell (4) concluded that at least 97% of the water in spores was able to exchange with the environment. In experiments with tritiated water, they found that water exchange in a population of spores as well as of vegetative cells was almost complete in 2–3 min at 0°C. In measurements of water sorption isotherms for four species of Bacillus, they found that vegetative cells absorbed more water at saturation than did spores and, more significantly, that species differed in amount of water absorbed. Due to the imprecise nature of their experiments, they did not have the means to study dependence of spore size on water content. In the 1970s, NMR spin-echo spectrometry led some to conclude that in some cells, two or even three fractions of water exist, one of which is strongly bound to protein and does not freeze at temperatures down to −80°C (6).
Ulanowski et al. (7) and DePieri et al. (8) used laser diffractometry to infer water content and size of two components of Bacillus sphaericus spores, which they attributed to the core and the cortex, but only on an overall population, not individual spores, and not as a function of humidity. They inferred a water content of ≈0.6 g/ml in the cortex and only ≈0.3 g/ml in the core, with small variations that depended on growth temperature.
Recently, Ishihara and colleagues (9, 10) used time-domain reflectometry to study “free” and “bound” water in both vegetative cells and spores of B. subtilis after various drying treatments. They found that spores contain only ≈ as much of both types of water as do vegetative cells. They also found that spores that had been dehydrated to <22% of their initial bound water could not germinate, whereas vegetative cells dehydrated to 20% of their initial bound water are 100% viable. In freeze-dried cells and spores only bound water remained (9, 10). Using differential thermal analysis/thermogravity, they observed a phase transition between gel and sol phases of bound water at 37°C in dried vegetative cells, but not in spores. It is commonly thought that the core of a spore contains a gel in which cross-linking between macromolecules occurs through stable but reversible bonds so as to form a polymeric matrix with entrapped water (11).
Despite these and many other experiments, the nature of the water in cells and spores is far from understood. The inconsistency of the nomenclature (free, bulk, bound, structured, layered, ordered, etc.) highlights this lack of understanding.
Until now, no one has had the ability to make direct, nondestructive, high-resolution measurements of dimensional changes in individual cells and spores as a function of humidity. In what follows, we report such measurements, show that the size of individual spores is an increasing function of humidity, and show that there appear to be two distinct time constants in the swelling curve. We will discuss how our results alter the traditional view that, when not germinating, spores in the wild are entirely static. We will also discuss implications of our results for the location of the water in the spore and for inactivation of spores by gases such as chlorine dioxide, formaldehyde, and ethylene oxide.
Description of Measurement: Materials and Methods
Several years ago, two of us (A.J.W. and P.B.P.) developed an automated scanning microscope for the purpose of analyzing nuclear glass track-etch detectors. Since then, we have used the system successfully in numerous research projects in diverse research fields, including high-energy astrophysics (12, 13), relativistic heavy ion physics (14–17), cluster radioactivity studies (18), hypervelocity grain capture in aerogels (19), and even atomic physics of highly relativistic atoms (20). The scanning system consists of a Leitz microscope, a computer-controlled stage, a CCD camera, and a Linux workstation with an image acquisition card. The system can rapidly scan a surface, such as a microscope slide, automatically measuring and recording the size of every object on the surface. In a typical application, the image of each object is fitted to an ellipse, so five parameters (x and y position, semiminor and semimajor axis, and orientation) are recorded for each detected object. Each measurement is derived from many pixels, so the absolute precision of a single measurement is better than 50 nm. Furthermore, by measuring the same object multiple times, the precision can be improved dramatically. Here, by averaging over >100 measurements, we have achieved a precision in size measurement of better than 5 nm. For example, the dispersion in the size data presented below, in the times before changes in humidity are introduced, is 4.4 nm.
That we can achieve such precision may appear at first glance to be somewhat surprising, because it is more than two orders of magnitude smaller than the wavelength of the light used for the measurement, and smaller than the projected size of the pixellation on the image plane (≈300 nm). But there are numerous examples of similar precision in optical systems. The LIGO gravity-wave detectors, for example, are sensitive to displacements of less than one-trillionth of a wavelength, using optical lasers. By comparison, our precision is extremely modest. We have confirmed the precision of the technique using a Monte Carlo simulation of the measurement process.
The scanning system is described in detail in ref. 21; we provide a brief summary here. The digitized image of the field of view of the microscope is transferred into a computer, which fits ellipses to the “threshold-gradient” image of each particle. These ellipse characteristics (size and position) are recorded in a file. The computer then moves the stage to a new field of view and repeats the process. In a typical scan of a nuclear track-etch detector, the computer moves to a completely new field of view between each image acquisition. By contrast, in the present case we pixellated the image slightly differently for each image acquisition, so the stage was moved only slightly. The scanning microscope was housed in a thermally stabilized box at 28°C.
Using this technique, we found that the mean semimajor and semiminor axes of the spore images were 1,380 and 1,070 nm, respectively. The measured sizes of the optical image differ from the actual sizes of the spores. Using a scanning electron microscope, we measured the sizes of the same spores used in the measurement described below and found that the semimajor axis as measured by scanning electron microscopy is ≈25% smaller than that measured optically, and that the semiminor axis is ≈50% smaller. This discrepancy is due to two effects: first, the diffracted image is larger than the actual spore, and second, the ellipse-fitting algorithm weights exterior pixels more strongly than interior pixels in fits of small objects. We have modeled the second effect with a Monte Carlo simulation and find that the measured size is almost exactly proportional to the actual size.
Spores from Bacillus thuringiensis (35646, American Type Culture Collection) were produced by shaking at 300 rpm (Innova Shaking Incubator, New Brunswick Scientific) at 37°C in Schaeffer's sporulation medium as described (22). After ≈2 days, when >95% of the culture consisted of phase-bright spores (Zeiss phase-contrast microscope), they were harvested by centrifugation and purified with a Reno-cal density gradient (23) and several (six) washings with sterilized double-distilled water. The spores were freeze-dried (Labconco, Kansas City, MO) in 1-ml aliquots at 50°C and 50–100 mtorr (1 torr = 133 Pa) pressure for 2 days and subsequently stored in a dessicator at room temperature.
We constructed a glass microchamber within which the RH could be changed on a time scale of a few tens of seconds. The top, bottom, and two of the sides of the chamber consisted of portions of microscope slides glued together. The third side (intake) was inserted into a machined polyethylene block that directed air of controlled RH from an inlet tube through the chamber and out of the fourth (exhaust) side. Objects on the bottom of the chamber could be viewed with the microscope through a hole drilled through the top of the chamber.
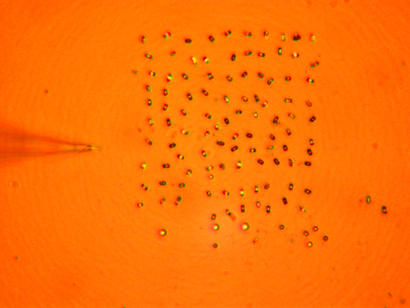
Before assembly of the glass microchamber, we placed 100 B. thuringiensis spores and six 2-μm borosilicate glass spheres (No. 9002, Duke Scientific, Palo Alto, CA) onto a microscope slide, using a micromanipulator (MP-285, Sutter Instruments, Novato, CA) and a pulled glass microneedle. The spores weakly adhered electrostatically to the microneedle, so transfer to and from the needle was done gently and with no obvious damage to the spores. (Four ≈4-μm glass spheres were also placed on the slide, but these could not be imaged properly by the scanning system because of poor contrast and focus.) In Fig. 1 we show the scanned field of view.
Figure 1.
Image of the scanned field of view. The field contains 100 B. thuringiensis spores and six 2-μm borosilicate glass spheres. The glass microneedle that placed the spores in the array is visible in the image.
The air supply was a pressurized bottle of dry air. The air line was split into two lines through a tee; one line was bubbled through a 1-liter Ehrlenmeyer flask to provide a humid air supply, the other line was unprocessed. The two lines merged through another tee, and the merged line was attached to the polyethylene block. The humidity was monitored in a small chamber inserted into the merged line just before entering the microscope box by using a digital hygrometer (800014, Sper Scientific, Scottsdale, AZ). The two lines were switched rapidly by pinching the plastic tubing with a surgical clamp.
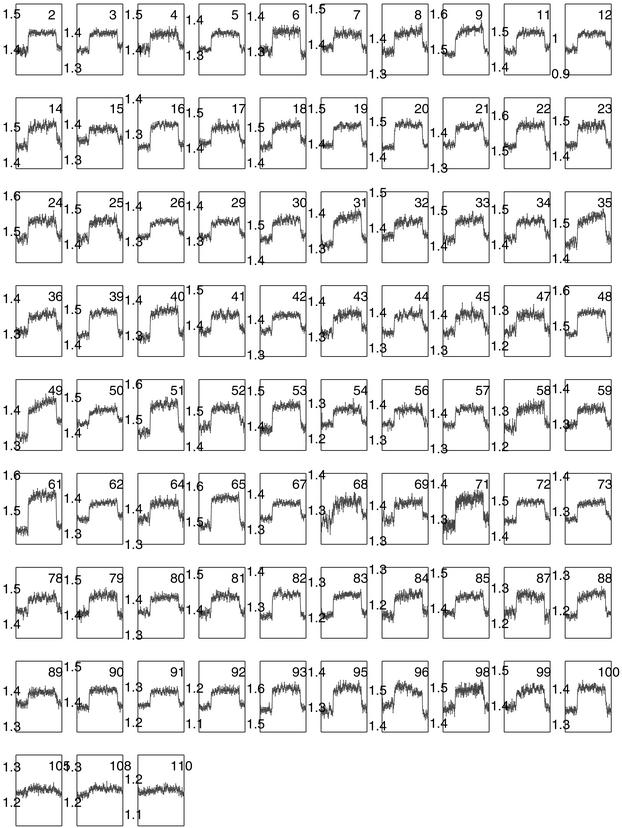
We did scanning and measuring using a ×50 objective. Some of the results for changes in size of each of the 100 spores and six glass spheres in response to an increase and decrease in humidity are shown in Fig. 2, which displays semimajor axis as a function of time measured in scan units. Each scan unit equals 76 s, the time it took to make 121 measurements of each of the 100 spores + 6 glass spheres (70 s) plus the time required to start a new scan (6 s). Between each of the 121 measurements within a scan, the stage was moved slightly (on an 11 × 11 = 121 grid with 1-μm spacing) to avoid errors that might result from discrete pixels in the CCD. A complete run of 100 scan units lasted 76 × 100 = 7,600 s. Thus, each particle was measured 12,100 times during an interval of 7,600 s. Each data point in the high size-resolution dataset in Fig. 2 is the average of the 121 measurements of an individual particle within a particular scan unit.
Figure 2.
Measurement histories (semimajor axis a in micrometers versus scan number 1–100, not labeled) for 80 spores and three calibration glass spheres (nos. 105, 108, and 110).
Data Analysis
Individual particles were assigned labels and were identified in the scan data by location. Of the original 100 spores, we omitted 20 (nos. 1, 10, 13, 27, 28, 37, 38, 46, 55, 60, 63, 66, 70, 74–77, 86, 94, and 97) in the analysis because of excessive noise in the data. Spheres 102, 103, 104, and 109 were difficult to image correctly because of their larger size and were also rejected. Two particle pairs (spore 74 and glass sphere 101, and glass spheres 106 and 107) were too close to be cleanly distinguished, so data from these particles were rejected in the analysis. Although in a few cases the excessive noise is clearly due to confusion between close neighbors, in most cases the source of the excessive noise is not yet understood. However, these noisy measurements comprise only 20% of the data.
In Fig. 2 we show the time history of the measurement of the semimajor axis a of the 80 spores and three small glass calibration spheres for the first of the two runs for which we present data. The semiminor axis data (not shown) are similar. For these runs, the slide was first exposed to dry air (measured RH = 3.0%). We then switched to a humid line (RH > 95%, noncondensing) at the beginning of scan 26, corresponding to a time 33 min into run 1. The humidity as measured in a small chamber just upstream of the sample chamber increased to >70% RH within 30 s of the transition and was above 80% within 1 min. At scan 86, corresponding to a time 109 min into run 1, the flow was switched back to dry air. The timing for run 2 was similar.
Swelling Amplitude.
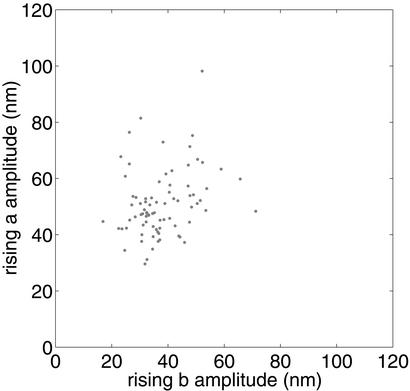
We determined the amplitude of swelling for the particles by comparing the average semimajor or semiminor axes in the 10 measurements before changing humidity (i.e., scans 16–25) to those between 10 and 20 measurements afterward (i.e., scans 36–45). In Fig. 3 we show a scatterplot of the two amplitudes, for the first run. The data for the second run (not shown) are similar. The semimajor and semiminor swelling amplitudes are not obviously correlated. We found the semimajor swelling amplitude to be 51.0 ± 1.3 nm for run 1 and 54.2 ± 1.4 nm for run 2; the width of the distribution was 11.8 ± 1.3 nm for run 1 and 11.9 ± 1.3 nm for run 2. For the semiminor axes, the amplitudes were 37.7 ± 1.1 nm for run 1 and 41.4 ± 1.3 nm for run 2; widths were 10.1 ± 1.1 nm for run 1 and 11.9 ± 1.3 nm for run 2. Calibration particles exhibited very small but significant changes in size (semimajor axis, ≈12 ± 4 nm for run 1 and ≈11 ± 2 nm for run 2; semiminor axis, ≈13 ± 3 nm for run 1 and ≈9 ± 1 nm).
Figure 3.
A scatterplot of semimajor vs. semiminor swelling amplitudes for 80 spores in run 1 (see text).
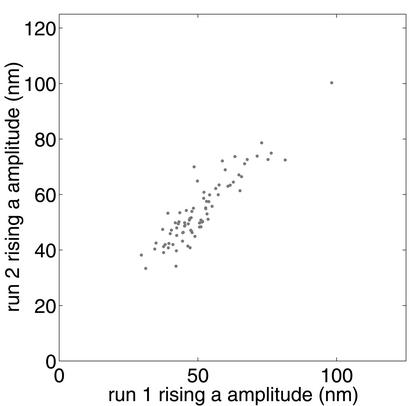
We investigated the reproducibility of the spore swelling by scanning the same spore array twice. In Fig. 4 we show scatterplots of the measured semimajor and semiminor swelling amplitudes between the two independent runs. The scattering amplitudes are highly correlated, suggesting that each individual spore has characteristic swelling amplitudes.
Figure 4.
Scatterplots of semimajor axis swelling amplitudes for two independent runs. The semiminor axis swelling amplitudes are similarly correlated.
Swelling Time Constant.
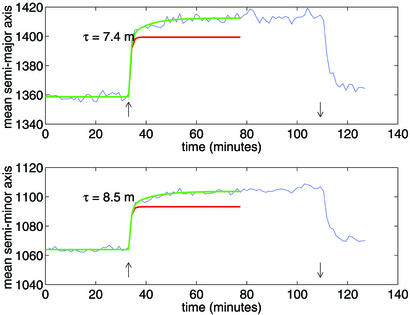
To investigate the time constant for swelling, we used an ensemble-average of the 80 spores that showed the lowest noise. In Fig. 5 we show the data at high size-resolution; that is, in which all measurements in a given 70-s scan are averaged for each time bin. Thus, the value in each time bin in Fig. 5 is the average of 121 × 86 points. The rapid swelling at 33 min for the dry-to-humid transition and shrinking at 109 min for the humid-to-dry transition occur immediately on change in humidity.
Figure 5.
An ensemble-averaged, low time-resolution history of the semimajor (Upper) and semiminor (Lower) spore axes for the first run. The up- and down-pointing arrows indicate the times of switching from dry to humid and from humid to dry conditions, respectively. The red line shows the prediction of the time history (until t = 80 min) from the short-time scale swelling fit using the high time-resolution data; the green line shows the fit when an additional slow component is included, as in Eq. 2.
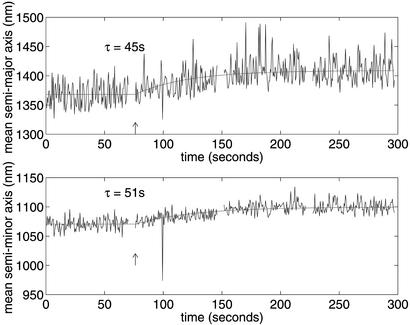
The time scale for the rapid swelling observed just after the RH is increased at 33 min is not well resolved in the high size-resolution data. To attempt to resolve this time scale, we formed a high time-resolution dataset, in which the ensemble-averaged dimensions are computed, but are not averaged over time. For the first run, these data are shown in Fig. 6. Except for a gap of a few seconds between scans, these data have a resolution of 70 s/121 s = 0.58 s. These data are shown for the first run in Fig. 6. For times after the switch time ts, we fitted the data, using maximum likelihood, to a function of the form
 |
1 |
where a is the size (semiminor or semimajor axis), a0 is the size before humidity change, δa is the steady-state increment at high RH, t is time, and τ is the swelling time constant. The best-fit values of the time constant τ are 45 s for the semimajor axis data and 51 s for the semiminor axis data. These values are approximately equal to the time constant for observed change in humidity of the apparatus. We conclude that we have still not resolved the intrinsic time scale for spore swelling even in these high-resolution data, and can only place an upper limit on this time scale at ≈50 s.
Figure 6.
An ensemble-averaged, high-resolution time history of the semimajor (Upper) and semiminor (Lower) spore axes. The switch from dry to humid air is indicated by the arrow.
This rapid swelling component (Fig. 6, red curve) does not, however, appear to be adequate to describe the data for longer times (Fig. 5, red curve). We found that an additional increase in size, of the same form as the first but with a smaller amplitude and longer time scales, fit the data well. Independent maximum-likelihood fits to the data gave amplitudes for this increase of 13 nm (semimajor axis) and 11 nm (semiminor axis), and a time constant of ≈8 min for both semimajor and semiminor axes. These fits are described by
 |
2 |
where the subscripts f and s signify the fast and slow components of the size increment and are shown as the green curves in Fig. 5. The fast and slow component increments, δaf and δas, correspond to changes in spore size of 2.9 and 0.9%, respectively. The time scales and amplitudes for the second run are consistent with those of the first run.
Although we have no way to make any associations of these two distinct swelling mechanisms with any structure in the spore, we speculate that the rapid swelling may be associated with diffusion of water into the spore coat + cortex, and that the slower swelling may be associated with diffusion of water into the spore core. We will develop this argument quantitatively in the next section.
Discussion
We have presented, for the first time, direct measurements of swelling due to water uptake by individual spores in response to an increase in RH. We list several implications of our results:
First and foremost, the view that dormant spores are entirely static while waiting for nutrient germination clues must be reconsidered. The dynamic response of the dormant spore to a change in one environmental parameter (humidity) may play a role in preparing the spore for a change in another parameter (nutrient cueing of germination). Further study of spore swelling may increase our understanding of the mechanism of spore dormancy and emergence from the dormant state.
At a more fundamental level, it may be possible in future work to dissect the functions of various core and cortex proteins in dehydration and rehydration during germination. One could, for example, examine whether mutants of B. subtilis in which cortex cross-linking is altered have swelling that is altered. See discussion by Driks (24) in his section on posttranslational modification of the coat proteins.
Along these same lines, it may be possible to use our automated microscopic technique to search for distinct phases of swelling during spore germination by comparing the swelling of wild spores and cortex-related mutants.
The fast and slow time constants of Eq. 2 may represent, respectively, time for diffusion of water into the spore coats and cortex and time for diffusion of water into the spore core. The coats + cortex are commonly thought to be readily permeable to water and to contain free water, whereas the core is thought to contain structured or bound water (2). A simple model of the two time constants is to assume that the diffusion coefficient is the same for coats, cortex, and core, as a consequence of which diffusion time is proportional to square root of radial distance penetrated into the spore. Using the electron micrographs of Bacillus spores in Fig. 1 of the review by Driks (24), we estimate the thickness of outer coat to be ≈27 nm, of the inner coat to be ≈50 nm, and of the cortex to be ≈100 nm, and the radius of the core to be ≈400 nm. Hydration of the spore core therefore requires diffusion through a radial distance of the order of 27 + 50 + 100 + 400 = 577 nm, whereas hydration of the coats + cortex involves diffusion through only 27 + 50 + 100 = 177 nm. On this model, the ratio of time constants should be ≈(577/177)2 = 10.6, which is close to the observed ratio, 480 s/48 s ≈ 10.
Various authors have studied the effect of RH on inactivation of bacterial spores by gas-phase ethylene oxide (25), formaldehyde (26, 27), and chlorine dioxide [Chlorine Dioxide (ClO2) Gas Phase Demonstration Project, U.S. Environmental Protection Agency Environmental Response Team Report, unpublished]. All of them reported that spore killing efficacy increased with RH, approaching 100% for RH greater than ≈70%, but opinions differed as to the role of humidity. Our discovery of spore swelling in response to a large increase in RH provides a natural explanation in terms of Ling's “size rule.” Ling et al. (28) have shown that the inside-to-outside partition ratio q of solute concentration in a cell diminishes as the molecular size increases, demonstrating that exclusion from the cell is based on size. They found that small solutes such as water enter the cell rather easily, with q ≡ 1.0, whereas larger ones encounter more difficulty. Applying their experimental dependence of q on molecular volume to the gases that have been used to inactivate spores (25, 25–27), we estimate partition ratios q = 0.94, 0.90, and 0.7 for formaldehyde, ethylene oxide, and chlorine dioxide, respectively. Admittedly, these values of q are not much smaller than unity, but they are based on observations in vegetative cells, not spores. If the channels for access of gases into spores are smaller than in cells, the partition ratios for these gases may be much smaller than for water. Thus, in geometric terms, swelling of a spore increases the diameter of channels through which inactivating gases can pass. A small increase in pore size would, we believe, significantly increase q and thus increase the equilibrium concentration of the gases inside the spore.
We did not attempt to analyze the data near the transition from humid to dry air because of the limited data after this transition in both runs. Qualitatively, however, it appears that the time scale for shrinkage after this transition is longer than for swelling.
A possibly related phenomenon has been pointed out to us: that intensity of spore fluorescence depends on the extent of dehydration in a time-dependent manner, as recently shown by Faris et al. (29).
Acknowledgments
We are indebted to Michael Solarz for assistance and Greg Faris, Wayne Nicholson, and Adam Driks for careful review of the manuscript. This research was supported in part by National Science Foundation Grant DBI-0204004 (to P.B.P. and A.J.W.) and the Defense Advanced Research Projects Agency (T.J.L.).
Abbreviation
- RH
relative humidity
Footnotes
See commentary on page 3007.
References
- 1.Neihof R, Thompson J K, Deitz V R. Nature. 1967;216:1304–1306. doi: 10.1038/2161304a0. [DOI] [PubMed] [Google Scholar]
- 2.Gould G W. J Appl Bacteriol. 1977;42:297–309. doi: 10.1111/j.1365-2672.1977.tb00697.x. [DOI] [PubMed] [Google Scholar]
- 3.Warth A D. In: Fundamental and Applied Aspects of Bacterial Spores. Dring G J, Ellar D J, Gould G W, editors. London: Academic; 1985. pp. 209–225. [Google Scholar]
- 4.Marshall B J, Murrell W G. J Appl Bacteriol. 1970;33:103–129. doi: 10.1111/j.1365-2672.1970.tb05237.x. [DOI] [PubMed] [Google Scholar]
- 5.Hazlewood C F, Chang D C, Nichols B L, Woessner D E. Biophys J. 1974;14:583–606. doi: 10.1016/S0006-3495(74)85937-0. [DOI] [PMC free article] [PubMed] [Google Scholar]
- 6.Belton P S, Jackson R R, Packer K J. Biochim Biophys Acta. 1972;286:16–24. doi: 10.1016/0304-4165(72)90084-0. [DOI] [PubMed] [Google Scholar]
- 7.Ulanowski Z J, Ludlow I K, Waites W M. FEMS Microbiol Lett. 1987;40:229–232. [Google Scholar]
- 8.DePieri L A, Ludlow I K, Waites W M. J Appl Bacteriol. 1993;74:578–582. [PubMed] [Google Scholar]
- 9.Ishihara Y, Takano J, Mashimo S, Yamamura M. Thermochim Acta. 1994;235:153–160. [Google Scholar]
- 10.Ishihara Y, Saito H, Takano J. Cell Biochem Funct. 1999;17:9–13. [Google Scholar]
- 11.Black S H, Gerhardt P. J Bacteriol. 1962;83:960–967. doi: 10.1128/jb.83.5.960-967.1962. [DOI] [PMC free article] [PubMed] [Google Scholar]
- 12.Westphal A J, Afanasyev V G, Price P B, Solarz M, Akimov V V, Rodin V G, Shvets N I. Astrophys J. 1996;486:679–685. [Google Scholar]
- 13.Westphal A J, Price P B, Weaver B A, Afanasiev V G. Nature. 1998;396:50–52. [Google Scholar]
- 14.Westphal A J, Guiru J, Price P B. Phys Rev C. 1991;44:1687–1690. doi: 10.1103/physrevc.44.1687. [DOI] [PubMed] [Google Scholar]
- 15.Westphal A J, Price P B, Snowden-Ifft D P. Phys Rev C. 1992;45:2423–2426. doi: 10.1103/physrevc.45.2423. [DOI] [PubMed] [Google Scholar]
- 16.He Y D, Price P B. Z Phys A. 1994;348:105–109. [Google Scholar]
- 17.He Y D, Price P B. Phys Lett B. 1993;298:50–53. [Google Scholar]
- 18.Guglielmetti A, Bonetti R, Poli G, Collatz R, Hu Z, Kirchner R, Roeckl E, Gunn N, Price P B, Weaver B A, et al. Phys Rev C. 1997;56:2912–2916. [Google Scholar]
- 19.Westphal A J, Snead C, Borg J, Quirico E, Raynal P I, Zolensky M, Ferrini G, Colangeli L, Palumbo P. Meteoritics Planetary Sci. 2002;37:855–865. [Google Scholar]
- 20.Westphal A J, He Y D. Phys Rev Lett. 1993;71:1160–1163. doi: 10.1103/PhysRevLett.71.1160. [DOI] [PubMed] [Google Scholar]
- 21.Weaver B A, Westphal A J, Price P B, Afanasyev V G, Akimov V V. Nucl Instrum Methods Phys Res Sect B. 1998;145:409–428. [Google Scholar]
- 22.Leighton T J, Doi R H. J Biol Chem. 1971;246:3189–3195. [PubMed] [Google Scholar]
- 23.Longchamp P, Leighton T. J Appl Microbiol. 1999;87:246–249. doi: 10.1046/j.1365-2672.1999.00879.x. [DOI] [PubMed] [Google Scholar]
- 24.Driks A. Microbiol Mol Biol Rev. 1999;63:1–20. doi: 10.1128/mmbr.63.1.1-20.1999. [DOI] [PMC free article] [PubMed] [Google Scholar]
- 25.Dadd A H, Town M M, McCormick K E. J Appl Bacteriol. 1985;58:613–621. doi: 10.1111/j.1365-2672.1985.tb01718.x. [DOI] [PubMed] [Google Scholar]
- 26.Munro K, Lanser J, Flower R. Appl Environ Microbiol. 1999;65:873–876. doi: 10.1128/aem.65.2.873-876.1999. [DOI] [PMC free article] [PubMed] [Google Scholar]
- 27.Cross G L, Lach V H. J Appl Bacteriol. 1990;68:461–470. doi: 10.1111/j.1365-2672.1990.tb02897.x. [DOI] [PubMed] [Google Scholar]
- 28.Ling G N, Niu Z, Ochsenfeld M. Physiol Chem Phys Med NMR. 1993;25:177–208. [PubMed] [Google Scholar]
- 29.Faris G W, Copeland R A, Mortelmans K, Bronk B V. Appl Opt. 1997;36:958–967. doi: 10.1364/ao.36.000958. [DOI] [PubMed] [Google Scholar]


