Abstract
This paper presents evidence indicating that the signals generated by neural responses to visual input can be either enhanced by increasing or suppressed by decreasing the area of the stimuli to which attention is directed. We used magnetoencephalography (MEG) to measure the frequency-tagged steady-state visual evoked responses of 11 subjects presented with two superimposed images flickering at different frequencies. Each image consisted of seven parallel bars of equal length; in any image, all bars were either red or green and either horizontal or vertical. At randomly chosen times during the experiments, any one of the three middle bars in either image transiently increased or decreased in width. Subjects were asked to attend to one image and ignore the other and to respond to changes in bar width in the attended image with a key press. In one condition, subject responses were required for changes in any of the three central bars of the attended image. We found that visual steady-state evoked responses to the attended image were enhanced relative to those evoked by the unattended image in this condition. In a second condition, subject responses were required for changes only in the middle bar. In this condition, the responses to the attended image were suppressed relative to those of the unattended image. These results may reflect relative differences in the synchronization and desynchronization of responding neuronal populations.
A long-standing question in neuroscience is whether attention involves inhibition as well as enhancement of cortical neural responses to sensory input (1, 2). Evidence suggesting the existence of inhibitory effects can be found in a number of previous studies. For example, functional MRI studies have reported suppression of the blood oxygen level-dependent signal in areas of primary visual cortex representing the peripheral visual field when subjects attended to a foveal stimulus, in contrast to greater activity accompanying passive viewing of the same stimulus (3). Electroencephalogram recordings analyzed by Silberstein et al. (4) showed that the steady-state potential amplitude evoked by a visual background was reduced when an attended image was superimposed on that background. Moran and Desimone (5) used single-cell electrophysiology to show that spiking activity in neurons could be suppressed by covertly switching the focus of attention from an effective to an ineffective stimulus within the cell's receptive field. Similarly, in a study using event-related potentials, Luck et al. (6) found that early visual-evoked activity in extrastriate cortex was suppressed when attention was shifted from the location of the evoking stimulus to another location in the visual field.
To examine these issues further under stringent conditions, we recorded the steady-state magnetoencephalographic (MEG) signals evoked in subjects viewing superimposed flickering visual stimuli. We found that even when the visual input remained unchanged, the power of the recorded MEG signal could be either increased or decreased, depending on the aspect of the scene to which attention was directed.
We used frequency tags to identify the steady-state visual-evoked responses in the MEG signal that corresponded to distinct but spatially overlapping visual stimuli (7). Frequency tagging involves the simultaneous presentation of distinct stimuli flickering at different “tag” frequencies. Responses in the MEG signal at the corresponding frequencies can then be measured. A recent example of this technique is provided by studies of binocular rivalry in which two overlapping images flickered at different frequencies: enhanced power and coherence in the MEG signal were found at the tag frequency corresponding to the perceptually dominant image (8, 9). Frequency tagging has also been used in conjunction with electroencephalogram recordings, in which measurement of steady-state visual-evoked responses revealed enhancement of responses to attended stimuli in a spatial attention task (10) and inhibition of evoked responses to an irrelevant background (4).
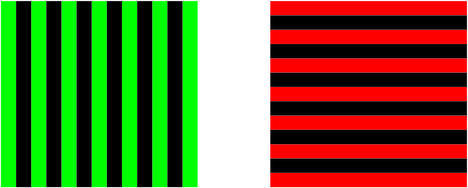
In our study, 11 subjects were presented with two superimposed images flickering at two different frequencies. Each image consisted of seven equally spaced parallel bars; in any image, all bars were either red or green and either horizontal or vertical (Fig. 1). Subjects were asked to attend to one image and ignore the other and to respond to randomly occurring transient changes in bar width in the attended image with a key press; equivalent random transient changes also occurred in the unattended image. We investigated two conditions distinguished only by task instructions; the physical stimuli were the same in both conditions. In the first condition, subjects were required to respond to width changes in any of the central three bars of the attended image. In the second condition, subject responses were required only for width changes in the central bar of the attended image. In this condition, changes in flanking bars of the attended image served as distracters. Analysis of MEG signals during the first condition revealed enhancement of visual-evoked responses to attended stimuli, as compared with visual-evoked responses to the equivalent unattended image. In the second condition, in which subject responses were to changes in the central bar only, we observed suppression of MEG signals relative to those of the unattended image.
Figure 1.
An example of the visual stimuli used in the experiment. Images of this kind flickered at two different frequencies (7.41 and 8.33 Hz). The images were presented simultaneously, overlapped entirely, and occupied a square field of visual angle ≈13° directly in front of the subject. A complete list of the image combinations used is shown in Table 1.
Materials and Methods
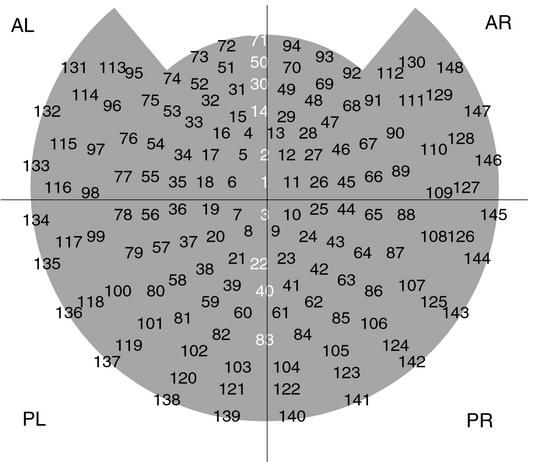
All 11 subjects participating in the experiment (eight males and three females, ages 25–64) had normal or corrected-to-normal vision. The experimental protocol was approved by the local Institutional Review Board, and all subjects gave informed consent. Neuromagnetic signals were collected by using a Magnes 2500Wh MEG system from 4-D NeuroImaging (San Diego). The MEG sensors consisted of 148 magnetometer coils (1-cm diameter) covering the whole head with 3-cm spacing (see Fig. 2). MEG recordings were collected in a magnetically shielded room. Stimuli were generated outside the MEG recording room by using a Macintosh computer and were projected [by using a Proxima (San Diego) 2000 projector] onto a screen in front of the subjects through a porthole and a reflection mirror.
Figure 2.
MEG sensor index and channel layout, as viewed from above with the subject's nose at the top of the image. Channels are grouped into four quadrants: anterior left (AL), anterior right (AR), posterior left (PL), and posterior right (PL). Midline channels, which were omitted from all quadrants, are labeled in white.
Visual stimuli consisted of superimposed images, each comprising seven equally spaced parallel bars. In any image, all bars were either red or green and were either horizontally or vertically oriented (Fig. 1). Images flickered at either 7.41 or 8.33 Hz. These frequencies corresponded to one image every nine or eight video frames, respectively, at a frequency of about 67 frames per second; on all other frames, black images were projected. When projected, the images overlapped entirely and occupied a square field with a visual angle of ≈13°. The remainder of the visual field was black. Luminance levels of the images were set such that equiluminance was perceived by the majority of a pool of pilot subjects. All experimental trials involved the simultaneous presentation of two images of different colors, orientations, and flicker frequencies. Throughout all trials, a constant (nonflickering) dim gray dot was also displayed as a fixation point at the center of both images. From time to time, one bar from each image transiently increased or decreased in width by 20%. Each change lasted for three image presentations (≈0.4 sec), after which the bar returned to its original width. On each such occasion, the modified bar was randomly selected from among the central three bars of the image. The combined width of these bars occupied ≈5.5° of visual angle, an area exceeding the visual angle of the fovea (≈2°). Width changes occurred independently for each image, with the interval between changes (for each image) chosen from a flat distribution between 1 and 3 sec.
Each trial lasted ≈2 min and commenced with the projection of a pair of images together with the fixation point. Four unique combinations of images were chosen from the two different colors (red or green), orientations (horizontal or vertical), and tag frequencies (7.41 and 8.33 Hz). These combinations are listed in Table 1. Each of the four combinations was repeated in two consecutive trials (a trial pair). In the first trial, subjects were asked to fixate the gray dot and to pay attention either to the horizontal bars (and the corresponding color) or to the vertical bars (and the corresponding color), and to ignore the other orientation and color combination. These instructions were reversed for the second trial of each pair. The four trial pairs were repeated in the two different experimental conditions, resulting in a total of 16 trials per subject. The sequence of trial pairs was randomized within each condition.
Table 1.
The four combinations of stimuli used in the experiments
| Combination | Stimuli |
|---|---|
| 1 | Green vertical 7.41 Hz and red horizontal 8.33 Hz |
| 2 | Green vertical 8.33 Hz and red horizontal 7.41 Hz |
| 3 | Red vertical 7.41 Hz and green horizontal 8.33 Hz |
| 4 | Red vertical 8.33 Hz and green horizontal 7.41 Hz |
We designated the two experimental conditions “attend-to-all” and “attend-to middle.” In the attend-to-all condition, subjects were asked to depress a key pad in response to transient width changes in any of the three central bars of the attended image. In the attend-to-middle condition, subjects were asked to respond to transient width changes in the center bar only and to ignore distracting changes in the flanking bars. Subjects were told that the direction of width change was irrelevant, i.e., they were asked to respond to both increases and decreases in width. In all trials, subjects were instructed not to respond to any changes in the unattended image.
Several photodiodes were placed on the computer screen and recorded in real time the timing of the flickering images and of all width changes in both images. During all trials, two sets of electrodes monitored eye movements. One pair was placed above and below the left eye to record blinks and vertical eye muscle movements. Another pair was placed near the external canthus of each eye to record horizontal eye muscle movements. Each electrode was referenced to the other in the same pair. Instances of blinks and saccades were identified from these two recordings by the waveform exceeding a threshold.
The task was explained to each subject beforehand, and subjects were allowed one or two practice trials to gain familiarity. During all experimental trials, signals from the key pads and the photodiodes were collected along with the MEG signals and saved to the computer for analysis. For each trial, subjects started to respond 10–20 sec before the onset of data collection, after which continuous MEG signals were recorded for 100 sec, providing a frequency resolution of 0.01 Hz.
The MEG signals were band-pass filtered at 1–100 Hz and digitized at 508 Hz. For each channel, MEG signals corresponding to each of the images were extracted from the power spectrum of the whole trial (100 sec) by using a fast Fourier transform algorithm (matlab, Mathworks, Natick, MA). The two flicker frequencies were identified from the power spectrum of the photodiode recording and were consistent with the frequency peaks observed across most MEG channels. Each of the frequency peaks was located within one bin with 0.01-Hz frequency resolution. Power at each of these frequency bins was recorded and classified as attended or unattended depending on the experimental condition.
Results
Behavioral Results.
For each trial, correct responses were defined by key presses occurring within 100–1,000 ms after a target event. Target events were defined as width changes in the attended image, either in any of the three central bars or in the middle bar only, depending on the experimental condition. In the attend-to-middle condition, the mean correct response level across all subjects was 77.7% (SEM = 4.6%) with a false positive rate of 16.1% (SEM = 3.3%). In the attend-to-all condition, the mean correct response level was 61.6% (SEM = 5.4%) with a false-positive rate of 18.1% (SEM = 3.1%). Although blink and saccade rates varied considerably from subject to subject, these rates were not significantly influenced by experimental condition: averaged across all subjects, differences in blink and saccade rates between the attend-to-all and attend-to-middle conditions did not deviate significantly from zero (for blinks, P > 0.1; for saccades, P > 0.1, both by two-tailed t tests). Moreover, influences of eye movements were masked by measuring brain responses at the specific tag frequencies >100 sec of continuous recording per trial.
Brain Responses.
Single subject exemplar.
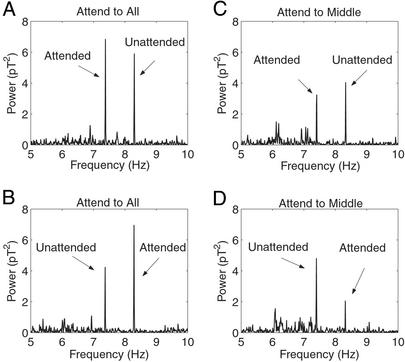
Fig. 3 A and B shows two examples of power spectra from a typical subject (subject E, Table 2) in the attend-to-all condition. Power spectra are shown of the same channel (no. 127, located in the right-frontal zone; see Fig. 2) from two different trials. In one trial (Fig. 3A), the subject was attending to a red-horizontal image tagged at 7.41 Hz and responding to changes in any of the three central bars while ignoring the green-vertical image, tagged at 8.33 Hz. In the second trial (Fig. 3B), the subject attended to the 8.33 Hz green-vertical image. The visual stimuli (color, orientation, and frequencies) in the two trials were the same; the only difference was that the subject attended to different images. The MEG signals in both trials show clear peaks at the two tag frequencies. The magnitude of the peak signal corresponding to the attended image is greater than that corresponding to the unattended image. This difference is assumed to reflect the influence of the attentive task.
Figure 3.
Power spectra from Channel 127 in one subject (E, Table 2) for four different conditions. In this example, the subject was presented with green-vertical bars flickering at 8.33 Hz and red-horizontal bars flickering at 7.41 Hz. The subject was required to attend to the red bars (A and C) and to the green bars (B and D). In A and B, the subject responded to changes in any of the three central bars (attend-to-all). In C and D, the subject responded to changes in the middle bar only (attend-to-middle). In the attend-to-all condition, power associated with the attended image was enhanced, compared with that associated with the unattended image. This effect was reversed in the attend-to-middle condition. The units on the ordinate are in picoTesla (pT) (1 pT = 10−12 T).
Table 2.
Average percentage differences between the power evoked by attended stimuli and that evoked by unattended stimuli for 11 individual subjects, in both experimental conditions and at both tag frequencies
| Subject | Attend-to-all, Hz
|
Attend-to-middle, Hz
|
||
|---|---|---|---|---|
| 7.41 | 8.33 | 7.41 | 8.33 | |
| A | 79.4* | 106.1* | −13.4 | −1.9 |
| B | 8.8* | 28.3* | 85.7* | −45.1* |
| C | 30.1* | −15.7* | −27.2 | 0.3 |
| D | 28.5* | 10.7* | −20.8* | 1.1 |
| E | 21.8* | 24.5* | −22.1* | −35.1* |
| F | 18.1* | 77.7* | 10.3* | −14.7* |
| G | 36.9* | 64.9* | −9.5* | 6.6 |
| H | 6.5* | 24.2* | 10.7 | 0.5 |
| I | 13.4 | 2.7 | −62.7* | −63.3* |
| J | 10.7 | 33.9* | −14.3 | −17.7* |
| K | 8.9* | 21.6 | −12.3 | −19.6* |
Positive values indicate larger signals evoked by attended stimuli than unattended stimuli. ANOVA analyses were carried out for each percentage difference; asterisks indicate statistical significance at the P < 0.05 level (n = 592) for the effect of attention on MEG power. In the attend-to-all condition, 10 of 11 subjects showed statistically significant differences at one or both tag frequencies. Attended power was greater than unattended power in all cases except subject C at 8.33 Hz, who showed the opposite result. In the attend-to-middle condition, 8 of 11 subjects showed statistically significant differences at one or both tag frequencies. Unattended power was greater than attended power in all cases except subjects B and F, who showed opposite effects at 7.41 Hz.
Fig. 3 C and D show equivalent data for two trials in the attend-to-middle condition, collected from the same channel and the same subject, using the same visual stimuli. As before, only the task instructions differed. In contrast to the attend-to-all condition, in this example attention reduced the magnitude of the MEG signal at the corresponding frequency tag.
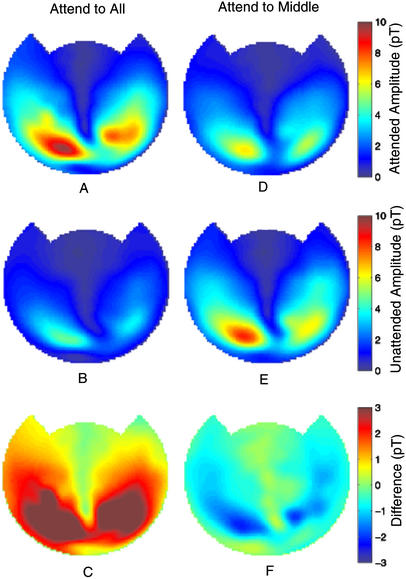
As shown in Fig. 4, these effects were not specific to a particular channel for this subject (subject E). In Fig. 4, we chose to display the square root of the power (amplitude) in our plots. The channel-by-channel MEG signal amplitude distributions from this subject are shown at one frequency (8.33 Hz) averaged across all combinations of stimulus color and orientation. On the left are averaged amplitude distributions in the attend-to-all condition when the 8.33 Hz stimulus was attended (Fig. 4A) and unattended (Fig. 4B). Largest amplitudes were seen in posterior cortical regions corresponding to occipitoparietal areas. Fig. 4C displays the amplitude differences after subtraction of unattended signals from attended signals. On the right (Fig. 4 D–F) are the equivalent data in the attend-to-middle condition.
Figure 4.
Frequency-tagged MEG signals from subject E at 8.33 Hz, showing amplitude distributions in a planar projection, averaged across four different stimulus trials (see Table 1) in both the attend-to-all (A–C) and attend-to-middle (D–F) conditions. For each condition, MEG signals are plotted for the attended image (A and D) and the unattended image (B and E). The differences in amplitude intensity (attended minus unattended) between the two conditions are shown in C and F. In the attend-to-all condition, these differences are largely positive; in the attend-to-middle condition, they are largely negative. Color bars represent the amplitudes of frequency-tagged responses in A, B, D, and E), and the amplitude differences between the conditions when the stimuli were attended and unattended. Notice that the amplitude range in C and F is reduced from that of A, B, D, and E, and also that it extends below zero. Units in the color bars are in picoTesla (pT) (1 pT = 10−12 T).
Clearly, in the attend-to-all condition, frequency-tagged MEG signals were larger when the corresponding stimulus was attended than when it was unattended (Fig. 4C). In contrast to these results, in the attend-to-middle condition, there was an overall decrease in the frequency-tagged response for the attended stimulus (Fig. 4F). These changes were broadly distributed across the MEG sensor array.
Although most other subjects showed effects similar to those of subject E, we did observe considerable intersubject variability in the details of spatial patterning of MEG signals. These individual differences are discussed in greater detail below.
All subjects and statistical analysis.
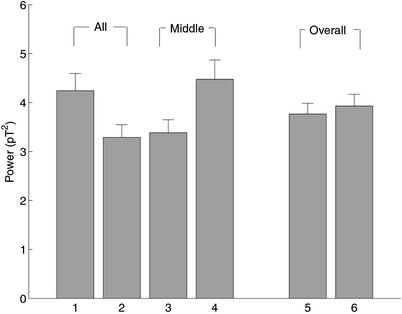
Fig. 5 shows MEG signals to attended and unattended stimuli averaged across all subjects and both tag frequencies, for both the attend-to-all and attend-to-middle conditions. Fig. 5 accords with the differences seen in Fig. 4. A comparison of columns 1 and 2 shows that, in the attend-to-all condition, MEG signals evoked by attended stimuli are significantly larger than those evoked by unattended stimuli (two-tailed t test, n = 88, P < 0.05). A comparison of columns 3 and 4 shows that the reverse is true in the attend-to-middle condition (two-tailed t test, n = 88, P < 0.05).
Figure 5.
Power of frequency-tagged MEG signals averaged across all 11 subjects, all 148 MEG channels, and both tag frequencies. Columns 1 and 2 show MEG signals to attended (1) and unattended (2) stimuli in the attend-to-all condition. Columns 3 and 4 show MEG signals to attended (3) and unattended (4) stimuli in the attend-to-middle condition. Columns 5 and 6 show the average of attended and unattended MEG signals in attend-to-all (5) and attend-to-middle (6) conditions. Mean values with standard error are shown. pT2, picoTesla squared.
Fig. 5 also indicates that changes occurred in signals evoked by both attended and unattended stimuli. A comparison of columns 2 and 4 shows that the MEG signals evoked by unattended stimuli are significantly larger in the attend-to-middle condition than in the attend-to-all condition (two-tailed t test, n = 88, P < 0.05). Conversely, a comparison of columns 1 and 3 indicates that signals evoked by attended stimuli are larger in the attend-to-all than in the attend-to-middle condition, although this difference did not reach statistical significance (two-tailed t test, n = 88, P = 0.05). Columns 5 and 6 of Fig. 5 show the overall level of evoked responses (the average of signals to both attended and unattended stimuli) in both the attend-to-all and attend-to-middle conditions. This overall level is not significantly different between the two conditions (two-tailed t test, n = 88, P > 0.1).
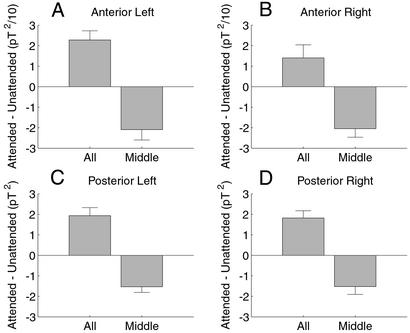
To determine whether these effects of attention were localized to particular cortical areas, for each image of a particular color, orientation, and frequency, we calculated the power difference at the tag frequency between the condition when it was attended and when it was unattended for four distinct quadrants of the MEG sensor array [see Fig. 2; these subdivisions have been used previously in Patel and Balaban (11)]. This calculation also controlled for variability that may arise from images of different color (red or green) and orientation (horizontal or vertical) that may generate frequency-tagged responses of different amplitude. Fig. 6 summarizes such power differences averaged for all conditions and across all 11 subjects. The four plots show averaged differences in power. Differences in the attend-to-all condition were all positive; those in the attend-to-middle condition were all negative. For each quadrant, an ANOVA test indicated that these differences are significantly different between these two experimental conditions (n = 88, P < 0.01). The ratio of the differences between the two conditions is strikingly similar across quadrants.
Figure 6.
Overall mean differences between attended and unattended frequency-tagged responses in the attend-to-all (All) and attend-to-middle (Middle) conditions, averaged across all 11 subjects. Shown are power differences at 8.33 Hz calculated within four quadrants of the 148 channels used (anterior left, anterior right, posterior left, and posterior right; see Fig. 2). Across all four regions, power differences in the attend-to-all condition are positive, and power differences in the attend-to-middle condition are negative. These differences are significantly different between the two conditions, indicating that the influence of attention changed from enhancement to suppression (ANOVA, n = 88, P < 0.01). The differences were larger in magnitude by a factor of ≈10 in posterior quadrants than in anterior quadrants. A similar pattern of results was observed for power differences at 7.41 Hz (not shown). pT2, picoTesla squared.
To assess whether attention had a reliable effect on MEG signals on a subject-by-subject basis, we calculated the percentage difference between MEG signals evoked by attended and unattended stimuli from all 11 subjects at both tag frequencies and in both experimental conditions (see Table 2). To assess the statistical significance of these values, we applied an ANOVA test to each entry in Table 2, using attention (attended or unattended), color (red or green), orientation (horizontal or vertical), and channels (1–148) as factors. Percentage differences that reached statistical significance for the effect of attention at the P < 0.05 level (n = 592) are indicated by asterisks in Table 2. In the attend-to-all condition, 10 of 11 subjects showed statistically significant differences at one or both tag frequencies. Power evoked by attended stimuli was greater than that evoked by unattended stimuli for all subjects apart from subject C at 8.33 Hz, who showed the opposite result at this tag frequency. In the attend-to-middle condition, 8 of 11 subjects showed statistically significant differences at one or both tag frequencies. Power evoked by unattended stimuli was greater than that evoked by attended stimuli for all subjects except B and F (Table 2), who showed opposite effects at 7.41 Hz.
These results demonstrate considerable individual variability in both statistical significance and magnitude of the percentage changes in MEG signal. Even so, for most subjects in the attend-to-all condition, attention-enhanced MEG signals at the tag frequency corresponded to the attended image, and for most subjects this effect was reversed in the attend-to-middle condition. It is possible that the individual variability we observe is due to individual differences in sensitivity to color, orientation, and flicker frequency of the visual stimuli. Fig. 6, which controls for these factors, clearly shows the influence of the attentive task.
Discussion
The primary finding from our study is that steady-state evoked responses to attended stimuli were enhanced in the attend-to-all condition and were suppressed in the attend-to-middle condition (Figs. 3–6). In both conditions, changes occurred in MEG signals evoked by both attended and unattended stimuli, whereas the overall level of evoked response remained roughly constant (Fig. 5). Changes were also broadly distributed across the entire MEG sensor array (Fig. 4), although we observed considerable individual variability in the statistical significance, magnitude, and spatial patterning of these changes (Fig. 4 and Table 2).
Our experimental design enabled us to compare MEG signals evoked by attended images to signals evoked by equivalent and spatially overlapping unattended images, while manipulating the attentive task to be performed for the attended image. In contrast, previous studies suggesting the existence of inhibitory effects involved either the spatial separation of stimuli (3, 5, 6) or the superimposition of an “attended” image on an “irrelevant” background (4). Our results show that evoked steady-state responses can be modulated by attention to a stimulus sharing the same spatial location as an unattended stimulus. These findings are consistent with reported attentional modulation of event-related potentials evoked by overlapping visual stimuli (12).
Do our results imply the operation of inhibitory attentional mechanisms? Kanwisher and Wojciulik (1) have pointed out that many apparent inhibitory effects of attention can in fact be accounted for purely in terms of differential enhancement over different areas. They suggest that unfocused attention to a visual scene might evoke a uniform level of enhanced neural activity over all cortical visual areas. Directing attention to a restricted part of that scene might then result in a redistribution of enhancement of neural activity. This would have the effect of increasing activity evoked by the focal attended stimuli and lessening that in the surrounding cortex. This decrease might lead to the interpretation that inattention can actively suppress neuronal activity in the absence of any specific inhibitory process.
This interpretation has the implication that evoked responses to attended stimuli should always be enhanced. Although this was indeed the case in the studies referred to above, we found that, under the stringent conditions of our tests, there were enhanced signals to attended stimuli when attention was broadly focused to detect changes anywhere in the visual scene, and there were suppressed signals, also to attended stimuli, if attention was narrowly focused to ignore changes in the peripheral input.
There are alternative interpretations. The first is that the attend-to-middle condition may require fewer neural resources than the attend-to-all condition, because only one bar need be monitored in the former as opposed to three bars in the latter. One might expect, on this basis, that evoked responses to attended stimuli in the attend-to-middle condition would be weaker than evoked responses to attended stimuli in the attend-to-all condition. As Fig. 5 shows, this is indeed the case. However, this leaves unexplained why, in the attend-to-middle condition, evoked responses to attended stimuli are actually weaker than responses to unattended stimuli. Presumably, monitoring for changes in a single bar would still require more resources than no monitoring at all.
Alternatively, because the attend-to-middle condition requires the suppression of behavioral responses to distracting changes within the attended stream, it may be that weak evoked responses to the attended image result from inhibitory attentional processes directed to the flanking (distracting) bars. Because such inhibition would not be required in the attend-to-all condition, in which all changes are targets, this might account for weaker evoked responses to attended stimuli in the attend-to-middle than in the attend-to-all condition. More importantly, in the attend-to-middle condition, attentional inhibition of distracting bars may outweigh any accompanying enhancement associated with monitoring for changes in the central bar. Such a net inhibition might account for our finding that evoked responses to attended stimuli are indeed weaker than evoked responses to unattended stimuli in this condition.
Some recent neuropsychological data are consistent with this interpretation. In contrast to normal subjects, patients with damage to the lateral prefrontal cortex have reduced evoked visual potentials to attended visual targets (13), according well with the notion that the lateral prefrontal cortex may facilitate neural responses to sensory input in normal subjects. However, in contrast to normal subjects, patients with damage to the orbitofrontal cortex showed elevated evoked responses to distracters in an attention task, suggesting that the orbitofrontal cortex in normal subjects may contribute to, and perhaps suppress, neural responses to novel and distracting inputs.
The magnitudes of the steady-state evoked MEG signals reported here are a function of many factors, among which are the anatomical distribution, level of activity, and synchronicity of neuronal responses to flickering visual stimuli (14). We presume that the observed changes in MEG signals corresponding to attended stimuli are caused by changes in one or more of these factors that correlate with willful changes in attentive tasks. Previous studies have shown that attention is associated with increased synchronization among neurons responding to attended stimuli (15, 16). It may be that our results reflect both synchronization (increases in the MEG signal) and desynchronization of neuronal populations (decreases in the MEG signal), depending on the attentive task. In the attend-to-all condition, attended stimuli may evoke a net increase in synchrony, whereas in the attend-to-middle condition, attended stimuli may lead to both synchronization (associated with the central bar) and desynchronization (associated with the distracting bars), with the latter effect possibly dominating.
The frequency tags used in our experiment (7.41 and 8.33 Hz) are close to frequency range of α-band brain activity (8–14 Hz). Worden et al. (17) recently reported increased α activity corresponding to unattended locations in visual space. However, in our study, 10 of 11 subjects showed no significant differences in intrinsic α activity between the attend-to-all and attend-to-middle conditions (we measured power across the 7- to 14-Hz frequency range excluding the tag frequencies). It is therefore unlikely that differential α activity was directly responsible for the enhancement and suppression of MEG signals observed in our study.
The changes we observed in the MEG signals corresponding to the unattended stimuli were not anticipated in our experiment (Fig. 5). These changes may be a consequence of the fact that, within a dynamic system composed of highly causally interconnected although spatially distributed elements, it is difficult to sustain oscillations at two different frequencies that are not harmonically related. The neural responses to the images flickering at different frequencies might in a sense compete for influence on the dynamics of the global system, so that any decrease of causal efficacy of one input is matched by an increase in efficacy of the other.
A further aspect of our findings that deserves comment is the broad anatomical distribution of changes in MEG signal in both experimental conditions. Fig. 4 C and F show a representative example, and Fig. 6 shows broadly and evenly distributed changes when signals from all subjects are combined. These observations suggest that attention may involve a widespread modulation of neural activity, which is consistent with the notion that the brain acts as a globally integrated dynamic system (18).
Despite these broad effects, absolute magnitudes of MEG signals were clearly largest in posterior brain regions (see Fig. 4 and also ref. 19). A plausible explanation for this asymmetry is that frequency-tagged input to the anterior cortex may be weaker than corresponding input to the posterior cortex, because most visual input passes through the posterior cortex before reaching anterior regions. However, another possibility is that cortical areas differ intrinsically in their sensitivity to specific frequency tags. Future research using different frequency tags may distinguish between these alternatives.
In summary, our results provide strong evidence that signals generated by neural responses to visual input can be either enhanced or suppressed, depending on the attentive task. Although our results cannot definitively establish the existence of inhibitory mechanisms of attention, they are most plausibly accounted for in this way. The possibility that attentional inhibition may involve the selective desynchronization of neural populations deserves further investigation.
Acknowledgments
We are grateful for productive discussions with other members of the Imaging Group at The Neurosciences Institute, including B. Baars, J. Iversen, E. Izhikevich, A. Patel, and B. van Swinderen. We also thank D. Nitz, B. Cunningham, and R. Greenspan for constructive comments. We are especially grateful to Professor Steven Hillyard of the Department of Neurosciences, University of California at San Diego, for valuable criticism, and we thank Lacey Kurelowech for expert contribution in data collection and technical support. This work was supported by the Neurosciences Research Foundation.
Abbreviation
- MEG
magnetoencephalographic
References
- 1.Kanwisher N, Wojciulik E. Nat Rev Neurosci. 2000;1:91–100. doi: 10.1038/35039043. [DOI] [PubMed] [Google Scholar]
- 2.Milliken B, Joordens S, Merikle P M, Seiffert A E. Psychol Rev. 1998;105:203–229. doi: 10.1037/0033-295x.105.2.203. [DOI] [PubMed] [Google Scholar]
- 3.Smith A T, Singh K D, Greenlee M W. NeuroReport. 2000;11:271–277. doi: 10.1097/00001756-200002070-00010. [DOI] [PubMed] [Google Scholar]
- 4.Silberstein R B, Schier M A, Pipingas A, Ciorciari J, Wood S R, Simpson D G. Brain Topogr. 1990;3:337–347. doi: 10.1007/BF01135443. [DOI] [PubMed] [Google Scholar]
- 5.Moran J, Desimone R. Science. 1985;229:782–784. doi: 10.1126/science.4023713. [DOI] [PubMed] [Google Scholar]
- 6.Luck S J, Hillyard S A, Mouloua M, Woldorff M G, Clark V P, Hawkins H L. J Exp Psychol Hum Percept Perform. 1994;20:87–904. doi: 10.1037//0096-1523.20.4.887. [DOI] [PubMed] [Google Scholar]
- 7.Regan D. Human Brain Electrophysiology: Evoked Potentials and Evoked Magnetic Fields in Science and Medicine. New York: Elsevier; 1989. [Google Scholar]
- 8.Tononi G, Srinivasan R, Russell D P, Edelman G M. Proc Natl Acad Sci USA. 1998;95:3198–3203. doi: 10.1073/pnas.95.6.3198. [DOI] [PMC free article] [PubMed] [Google Scholar]
- 9.Srinivasan R, Russell D P, Edelman G M, Tononi G. J Neurosci. 1999;19:5435–5448. doi: 10.1523/JNEUROSCI.19-13-05435.1999. [DOI] [PMC free article] [PubMed] [Google Scholar]
- 10.Morgan S T, Hansen J C, Hillyard S A. Proc Natl Acad Sci USA. 1996;93:4770–4774. doi: 10.1073/pnas.93.10.4770. [DOI] [PMC free article] [PubMed] [Google Scholar]
- 11.Patel A D, Balaban E. Nature. 2000;404:80–84. doi: 10.1038/35003577. [DOI] [PubMed] [Google Scholar]
- 12.Valdes-Sosa M, Bobes M A, Rodriguez V, Pinilla T. J Cognit Neurosci. 1998;10:137–151. doi: 10.1162/089892998563743. [DOI] [PubMed] [Google Scholar]
- 13.Knight R T, Staines W R, Swick D, Chao L L. Acta Psychol (Amsterdam) 1999;101:159–178. doi: 10.1016/s0001-6918(99)00004-9. [DOI] [PubMed] [Google Scholar]
- 14.Hamalainen M H R, Ilmoniemi R J, Knuutila J, Lounasmaa O V. Rev Mod Phys. 1993;65:413–497. [Google Scholar]
- 15.Fries P, Reynolds J H, Rorie A E, Desimone R. Science. 2001;291:1560–1563. doi: 10.1126/science.1055465. [DOI] [PubMed] [Google Scholar]
- 16.Steinmetz P, Roy A, Fitzgerald P J, Hsiao S S, Johnson O, Niebur E. Nature. 2000;404:187–190. doi: 10.1038/35004588. [DOI] [PubMed] [Google Scholar]
- 17.Worden M S, Foxe J J, Wang N, Simpson G V. J Neurosci. 2000;20:RC63. doi: 10.1523/JNEUROSCI.20-06-j0002.2000. [DOI] [PMC free article] [PubMed] [Google Scholar]
- 18.Edelman G M, Tononi G. A Universe of Consciousness: How Matter Becomes Imagination. New York: Basic Books; 2000. [Google Scholar]
- 19.Silberstein R. In: Neocortical Dynamics and Human EEG Rhythms. Nunez P, editor. Oxford: Oxford Univ. Press; 1995. pp. 272–303. [Google Scholar]


