Abstract
In vivo 13C and 31P nuclear magnetic resonance techniques were used to study propionate metabolism by activated sludge in enhanced biological phosphorus removal systems. The fate of label supplied in [3-13C]propionate was monitored in living cells subjected to anaerobic/aerobic cycles. During the anaerobic phase, propionate was converted to polyhydroxyalkanoates (PHA) with the following monomer composition: hydroxyvalerate, 74.2%; hydroxymethylvalerate, 16.9%; hydroxymethylbutyrate, 8.6%; and hydroxybutyrate, 0.3%. The isotopic enrichment in the different carbon atoms of hydroxyvalerate (HV) produced during the first anaerobic stage was determined: HV5, 59%; HV4, 5.0%; HV3, 1.1%; HV2, 3.5%; and HV1, 2.8%. A large proportion of the supplied label ended up on carbon C-5 of HV, directly derived from the pool of propionyl-coenzyme A (CoA), which is primarily labeled on C-3; useful information on the nature of operating metabolic pathways was provided by the extent of labeling on C-1, C-2, and C-4. The labeling pattern on C-1 and C-2 was explained by the conversion of propionyl-CoA to acetyl-CoA via succinyl-CoA and the left branch of the tricarboxylic acid cycle, which involves scrambling of label between the inner carbons of succinate. This constitutes solid evidence for the operation of succinate dehydrogenase under anaerobic conditions. The labeling in HV4 is explained by backflux from succinate to propionyl-CoA. The involvement of glycogen in the metabolism of propionate was also demonstrated; moreover, it was shown that the acetyl moiety to the synthesis of PHA was derived preferentially from glycogen. According to the proposed metabolic scheme, the decarboxylation of pyruvate is coupled to the production of hydrogen, and the missing reducing equivalents should be derived from a source other than glycogen metabolism.
Enhanced biological phosphorus removal results from the enrichment of activated sludge processes in polyphosphate-accumulating organisms. These activated sludge processes are operated in two phases: the effluent rich in phosphorus and short-chain fatty acids is first fed to an anaerobic phase and proceeds to the aerobic step, where no effluent is added. At the end of the aerobic phase, activated sludge is allowed to settle and recycled to the first phase as a clarified effluent free of phosphorus. Phosphorus is removed from the system by purging the biomass. Also, enhanced biological phosphorus removal can occur in a sequencing batch reactor operated under alternating anaerobic and aerobic conditions.
Two main metabolic models have been proposed for the enhanced biological phosphorus removal process. The first one, put forward by Comeau et al. (5) and adapted by Wentzel et al. (30), postulated that in anaerobic conditions, short-chain fatty acids such as acetate were taken up by bacteria and transformed to poly-β-hydroxybutyrate (PHB), with concomitant release of phosphorus, derived from the hydrolysis of polyphosphate reserves. The chemical energy present in polyphosphate was conserved in ATP needed to sustain energy-demanding processes in the cell. The tricarboxylic acid cycle (TCA) was proposed as a source of reducing equivalents for PHB synthesis. Under aerobic conditions, the bacteria are able to grow on the stored carbon products and take up excess phosphorus to incorporate in biomass and polyphosphate.
Mino et al. (19) suggested a different metabolic model based on the degradation of intracellular carbohydrates during the anaerobic period and their synthesis during the aerobic phase. The PHB and polyphosphate turnovers were accepted, but these authors proposed that TCA would not operate under anaerobic conditions and, instead, the needed reducing equivalents come from the catabolism of stored glycogen, a new carbon reserve formed in aerobic conditions.
Pereira et al. (23) proposed a combination of the two models to explain the results obtained by in vivo nuclear magnetic resonance (NMR). The observed transfer of 13C label from [2-13C]acetate to polyhydroxyalkanoates (PHA) in the anaerobic period, subsequent to glycogen in the aerobic phase, and again to PHA in a second anaerobic period confirmed the involvement of both polymers in the metabolism, in accordance with the Mino model. On the other hand, the observation of labeled CO2 production under anaerobic conditions and the need for an additional source of reducing equivalents (other than glycolysis) to fulfill the redox balance indicated the operation of TCA under anaerobiosis, as proposed by Wentzel et al. (31).
Louie et al. (16) proposed, for the production of reducing equivalents, the operation of the glyoxylate cycle coupled to a futile cycle from acetyl-coenzyme A (CoA) and back to acetyl-CoA instead of the TCA cycle. Kortstee et al. (12) suggested that in order to synthesize poly-β-hydroxyvalerate, conversion of pyruvate (derived from glycogen) to succinyl-CoA, the precursor of propionyl-CoA, could occur in two ways: transcarboxylation to oxaloacetate and then to succinyl-CoA (left side of the TCA operating backwards) or via the first part of the TCA till succinyl-CoA. The actual pathway for conversion would depend on the availability of reducing equivalents, as the mechanism in the first hypothesis consumes while the second alternative produces reducing equivalents.
Another controversial aspect in enhanced biological phosphorus removal metabolism concerns the pathway for degradation of glycogen to pyruvate. The use of solid-state NMR proved the involvement of the Entner-Doudoroff pathway, yielding two ATP molecules, in detriment of the Embden-Meyerhof-Parnas pathway, yielding three ATP molecules (10, 18). Pramanik et al. (24) suggested that glycogen breakdown occurred through a variation of the Entner-Doudoroff pathway (coupled to the pentose phosphate pathway) and accounted for all the NADH required for PHA synthesis.
Thus far, no polyphosphate-accumulating organisms isolated from enhanced biological phosphorus removal have been able to depict the general metabolic behavior observed for activated sludge. Among them are Acinetobacter spp. (7), Lampropedia spp. (28) Microlunatus phosphovorus (21), and Tetrasphaera spp. (17). In the absence of a true isolate of polyphosphate-accumulating organisms, attention was directed to molecular biology tools to describe enhanced biological phosphorus removal microbial communities. By using a clone library and fluorescent in situ hybridization techniques, it was shown that bacteria related to the Rhodocyclus group (“Candidatus accumulibacter phosphatis”) were widespread in laboratory-scale enhanced biological phosphorus removal reactors, with extremely efficient P removal (6, 9). Due to the failure to isolate a true polyphosphate-accumulating organism, most experiments are still carried out with activated sludge.
Essentially all studies on enhanced biological phosphorus removal metabolism consider acetate a model carbon substrate. In reality, wastewater contains a much more diverse mixture of substrates, and research was conducted with other compounds, such as propionate, butyrate, valerate, formate, lactate, malate, pyruvate, glucose, citrate, and succinate, alone and in a mixture (2, 3, 4, 15, 16, 27). In all cases, the consumption of these substrates gives rise to the production of PHA with different compositions. Several metabolic models have been proposed for acetate as a substrate in enhanced biological phosphorus removal, but among the alternative substrates, a metabolic model has been developed only for glucose (29).
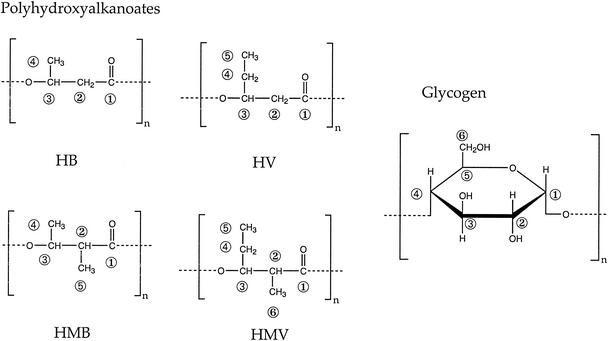
According to Comeau et al. (5), poly-β-hydroxyvalerate production was significantly higher than that of PHB when a substrate with an odd number of carbon atoms was fed to activated sludge. This observation was confirmed later for propionate by Lemos et al. (13). The composition of PHA derived from propionate was elucidated by Satoh et al. (27) as a mixture of hydroxyvalerate (HV), hydroxybutyrate (HB), hydroxymethylvalerate (HMV), and hydroxymethylbutyrate (HMB) (Fig. 1).
FIG. 1.
Intracellular polymers associated with enhanced biological phosphorus removal: polyhydroxyalkanoates and glycogen. HB, hydroxybutyrate; HV, hydroxyvalerate; HMB, hydroxymethylbutyrate; HMV, hydroxymethylvalerate.
Despite the number of studies reported in the literature on propionate metabolism by polyphosphate-accumulating organisms, a deep knowledge is still lacking. We resorted to the use of nuclear magnetic resonance (NMR) to further investigate propionate metabolism in enhanced biological phosphorus removal. This powerful analytical methodology allows the identification and quantification of intra- and extracellular metabolites in a noninvasive mode and in real time (22, 26). The ability to detect phosphorus and carbon nuclei simultaneously makes NMR an especially suitable technique to elucidate the interrelationship between carbon and phosphorus metabolism in polyphosphate-accumulating bacteria. The results obtained for propionate metabolism are discussed in light of the metabolic model proposed earlier for acetate.
MATERIALS AND METHODS
Seed sludge.
The initial inoculum was obtained from the wastewater treatment plant of Beirolas, Lisbon, and start-up of the operation occurred in February 1997. The activated sludge plant was operating for carbon removal and consisted of a stirred tank coupled to a settler. In the laboratory, the reactor was operated as a sequencing batch (sequencing batch reactor) with a mixture of acetate, propionate, and butyrate as the carbon source, with a total concentration of 320 mg of chemical oxygen demand/liter (one third each).
Medium.
The defined mineral medium chemical oxygen demand:N:P ratio was 100:4.4:2.8. Its composition was 679.9 mg of CH3COONa · 3H2O, 211.5 mg of CH3CH2COOH, 176.1 mg of CH3CH2CH2COOH, 600 mg of MgSO4 · 7H2O, 160 mg of NH4Cl, 92 mg of K2HPO4, 45 mg of KH2PO4, 100 mg of EDTA, 70 mg of CaCl2 · 2H2O, and 2 ml of trace elements in 1 liter of distilled water. The trace element mixture consisted of 1,500 mg of FeCl3 · 6H2O, 150 mg of H3BO3, 150 mg of CoCl2 · 6H2O, 120 mg of MnCl2 · 4H2O, 120 mg of ZnSO4 · 7H2O, 60 mg of Na2MoO4 · 2H2O, 30 mg of CuSO4 · 5H2O, and 30 mg of KI in 1 liter of distilled water. The pH was adjusted to 7.2 prior to autoclaving. No nitrification was observed in the reactor despite the fact that no inhibitor was added.
Sequencing batch reactor.
A laboratory-scale sequencing batch reactor consisting of a 2-liter vessel with a working volume of 1.5 liters was operated at 23°C, without pH control, and stirred at 250 rpm during gas bubbling. Each anaerobic/aerobic cycle consisted of 2 h of anaerobic (argon bubbling), 4 h of aerobic (air bubbling), 1 h of settling (no agitation), 1 h of withdrawing one third of the liquid phase, and refilling with the same volume of fresh medium. This resulted in an 8-h cycle and a hydraulic retention time of 1 day. At the end of the aerobic period, biomass was purged to maintain a mean cell residence time of 10 days. The gas flow (0.3 liter min−1) was controlled by electromagnetic valves, and the supernatant withdrawal and feeding of fresh medium was controlled by pumps, all connected to timers. Electrodes (pH and redox potential) were introduced into the reactor.
Chemical analytical techniques in sequencing batch reactor.
Phosphate, volatile fatty acids, suspended solids, volatile suspended solids, and PHA determinations were performed according to Lemos et al. (13). Glycogen was determined as glucose with the Glucose HK diagnostic kit (Sigma Diagnostics). After biomass lyophilization (40 to 60 mg), 1 ml of HCl (0.6 N) was added, and the mixture was de-aerated for 10 min with argon or N2 and then heated to 100°C for 2 h. After cooling and centrifugation, 10 μl of the supernatant was added to 1 ml of the test kit. Absorbance was measured at 340 nm against a blank made with water. Standards of glycogen were subjected to the same treatment as the samples. The glucose concentration obtained was converted to chemical oxygen demand by using the oxidation stoichiometry.
Ammonia was analyzed by high-performance ionic liquid chromatography with a Shodex IC YK 421 column with 5 mM tartaric acid, 1 mM dipicolinic acid, 1.5 g of boric acid per liter, and 1.5 mM 18-crown 6-ether as the eluent, an elution rate of 1 ml/min, and an operating temperature of 50°C, coupled to a conductivity detector in the nonsuppresser mode (Merck). Prior to injection, samples were filtered with a 0.2-μm membrane and subsequently an ultrafiltration membrane with a 50-kDa cutoff.
Nitrite and nitrate concentrations were determined by segmented flow analysis (Skalar Analytical B. V., Breda, The Netherlands). Nitrite was determined by the colorimetric reaction with N-(1-naphthyl)-ethylenediamine after diazotization with sulfanylamide. Nitrate was determined as nitrite after reduction in a cadmium column (1).
Sample preparation for in vivo NMR analysis.
A sample of cell suspension (200 to 250 ml) was collected from the reactor at the end of the aerobic phase, concentrated by centrifugation (8,000 × g, 15 min, 4°C), and suspended in fresh mineral medium supplemented with 10 mM KCl and 2 mM MgSO4 · 7H2O at pH 7.0 without carbon or phosphorus sources. Experiments were performed with 5 ml of cell suspension (typically 0.1 g dry weight). Agitation and gassing in the NMR tube were achieved with an air-lift system (25) and bubbling argon or air (0.13 liter min−1). 2H2O was added (5%, vol/vol) in order to provide a lock signal.
The anaerobic cycle was started when 20 mM labeled sodium propionate was added. At the end of the first anaerobic stage, the cell suspension was centrifuged (8,000 × g, 15 min, 4°C), and the pellet was resuspended in fresh supplemented mineral medium; at the beginning of the following aerobic cycle, potassium phosphate (5 mM) was added. Prior to the second anaerobic stage, cells were again centrifuged (8,000 × g, 15 min, 4°C) and suspended in fresh supplemented mineral medium. This second anaerobic cycle was started with the addition of 10 mM unlabeled sodium propionate.
Chloroform extracts of polyhydroxyalkanoates.
Freeze-dried cells were extracted with chloroform and vigorously agitated for 24 h at 4°C. After centrifugation (25,000 × g, 30 min, 4°C), the solvent in the supernatant solution was evaporated, and the residue was dissolved in extrapure chloroform (0.6 to 1.0% ethanol). This solution was filtered through 0.45-μm-pore-size membranes (HA Millipore) and evaporated under a nitrogen flow. The residue obtained was then dissolved in 0.5 ml of deuterated chloroform.
Acquisition of NMR spectra.
31P-NMR and 13C-NMR spectra were acquired with a quadruple nuclei probe head (10-mm diameter) in a Bruker DRX-500 spectrometer operating at 125.75 MHz for carbon and 202.45 MHz for phosphorus. The acquisition conditions were as previously reported (23). Carbon resonances were referenced with respect to external methanol (designated at 49.3 ppm), and phosphorus resonances were referenced with respect to external 85% H3PO4. A probe head temperature of 30°C was always used.
13C-NMR spectra of the chloroform extracts were recorded with a selective probe head (5-mm diameter). The following acquisition conditions were used: spectral width, 50 kHz; repetition delay, 60 s; pulse width, 9 μs (corresponding to a flip angle of 90°); data size, 128,000; and probe temperature, 28°C. Proton broadband decoupling was applied during the acquisition time only (1.3 s). Chemical shifts were referenced with respect to the resonance of deuterated chloroform at 77.5 ppm.
The relative intensities of the carbon resonances in Fig. 3, 5, and 6 do not reflect true relative concentrations due to the reasonably fast pulse rate conditions used to acquire 13C-NMR spectra of living cells and diverse nuclear Overhauser enhancement factors of different carbon atoms. The actual concentrations of polyhydroxyalkanoates and glycogen were obtained as previously described (23). Phosphate concentrations were determined by comparison of the intensities of the resonance due to inorganic phosphate with the increase in intensity observed upon addition of a known amount of phosphate.
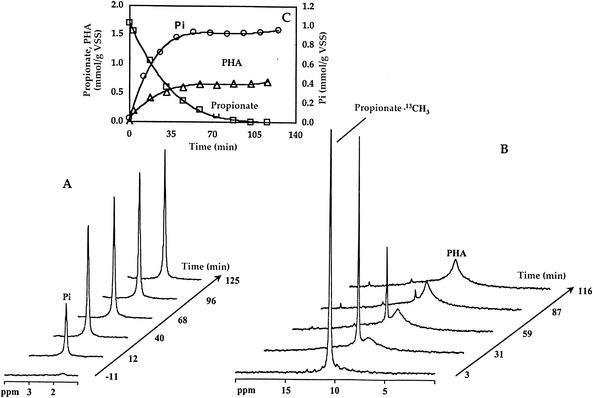
FIG. 3.
Time evolution of phosphorus release (A) and propionate consumption and PHA formation (B) for activated sludge in anaerobic conditions, followed by in vivo 31P-NMR and 13C-NMR. The results obtained are presented in the inset graphic (C). ○, inorganic phosphate (Pi); □, propionate; and ▵, PHA. VSS, volatile suspended solids.
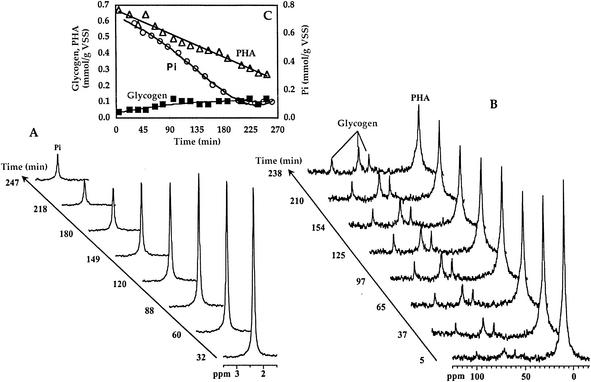
FIG. 5.
Time evolution of phosphorus consumption (A) and PHA degradation and glycogen formation (B) for activated sludge in aerobic conditions followed by in vivo 31P-NMR and 13C-NMR. After the experiment depicted in Fig. 3, the atmosphere was changed to air, and phosphorus and carbon spectra were acquired in alternately. Results are represented in the inset (C). Glycogen values correspond to what was directly detected by NMR (60% of the total). ○, inorganic phosphate (Pi); ▵, PHA; and ▪, glycogen. VSS, volatile suspended solids.
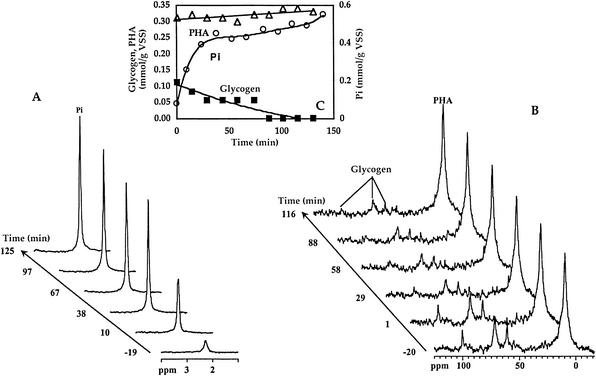
FIG. 6.
Phosphorus release (A) and glycogen consumption and PHA production (B) for activated sludge under anaerobic conditions, followed by in vivo 31P-NMR and 13C-NMR. The results obtained are represented in the inset (C). After the experiment depicted in Fig. 5, the atmosphere was modified to argon, and at time zero 10 mM unlabeled propionate was added. Glycogen values correspond to what was directly detected by NMR (60% of the total). ○, inorganic phosphate (Pi); ▵, PHA; and ▪, glycogen. VSS, volatile suspended solids.
Chemicals.
[3-13C]propionate (sodium salt with 99% atom 13C enrichment) was acquired from Campro Scientific BV, Veenendaal, Netherlands, and 2H2O (99.9% atom 2H) was purchased from Sigma Chemical Co. Extrapure chloroform (0.6 to 1.0% ethanol) and [2H]chloroform (99.5% atom 2H) were obtained from E. Merck, Darmstadt, Germany. All other chemicals were of reagent grade.
RESULTS
Sequencing batch reactor.
To perform the experiments with propionate as the carbon source, activated sludge collected from the wastewater treatment plant of Beirolas was adapted to this substrate. A sequencing batch reactor was fed with a mixture of acetate, propionate, and butyrate with the same concentration in terms of chemical oxygen demand (total of 320 mg of O2/liter). The characteristic profile of these systems of biological phosphorus removal started to be apparent after 1 week of operation, improved, and then did not change for several months.
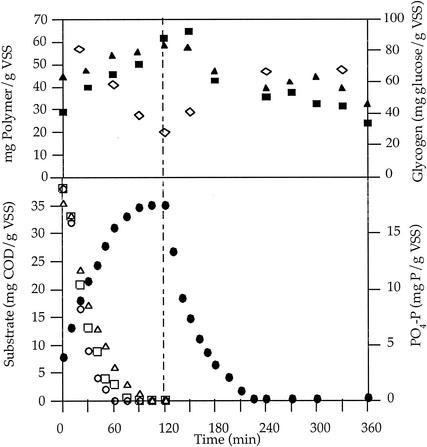
An example of the operating cycle is shown in Fig. 2. In the anaerobic phase, the substrates were fully consumed; propionate was the first to be exhausted, followed by butyrate and finally acetate. Substrate consumption was concomitant with phosphorus release to the external medium. The production of PHA, consisting of both PHB and poly-β-hydroxyvalerate, occurred during the entire anaerobic period, even after carbon substrate depletion, concomitant with glycogen consumption. In the subsequent aerobic phase, phosphorus was removed from the medium in relative excess to the feed value, PHA was consumed, and glycogen was produced. The total sludge P content determined for this experiment was 5.2% (wt/wt). Nitrate and nitrite were barely detectable, and this did not change during the cycle of operation. Thus, the presence of denitrifying anaerobic bacteria that could compete for carbon substrate and the presence of aerobic nitrifying bacteria that would convert ammonia into nitrate was excluded. The absence of nitrifying bacteria could be due to the low residence time used for activated sludge in this study.
FIG. 2.
Operation cycle for an enhanced biological phosphorus removal system fed with a mixture of substrates (▵, acetate; ○, propionate; □, butyrate; •, phosphorus; ▴, HB; ▪, HV; and ⋄, glycogen). COD, chemical oxygen demand; VSS, volatile suspended solids.
For the NMR experiments, sludge was collected approximately 2 months after the reactor reached steady-state conditions, defined by full consumption of substrate in the anaerobic phase and full P removal by the end of the aerobic phase.
NMR studies. (i) First anaerobic phase.
A typical NMR experiment comprised three distinct phases: an anaerobic phase, with addition of propionate enriched with carbon-13 in the methyl group; an aerobic phase; and a second anaerobic phase, during which nonlabeled propionate was added. Sludge in the NMR tube was subjected to an anaerobic period of approximately 2 h, starting with the addition of [3-13C]propionate at a final concentration of 20 mM. 13C- and 31P-NMR spectra were acquired alternately to enable monitoring of the pools of labeled carbon metabolites and of phosphorus-containing compounds in a single experiment.
An illustration of this type of experiment is shown in Fig. 3. Propionate (resonance at 10.54 ppm) was converted into PHA, announced by the appearance of a strong, broad resonance centered at 9.4 ppm, assigned to the methyl groups in HV5 and HMV5 and also comprising contributions from HMV6 and HMB5 (see below). Two weak resonances at 31.0 ppm and 34.2 ppm were attributed to the CH2 groups of propionate and succinate, respectively. The time profiles for the consumption of propionate, PHA synthesis, and phosphorous release are plotted in Fig. 3 (inset). From 1 mol of carbon (C mol) of labeled propionate that was consumed, 0.83 C mol of PHA was produced. The area of the resonance at 9.4 ppm, after propionate depletion, was used for quantification of the polymer (average of three assays). The area under this resonance corresponds to the sum of the contributions due to CH3(HV5) and CH3(HMV5) and also CH3(HMV6) and CH3(HMB5), which originate resonances that cannot be individualized in the spectra of living cells. This assignment was derived from the analysis of chloroform extracts from parallel experiments.
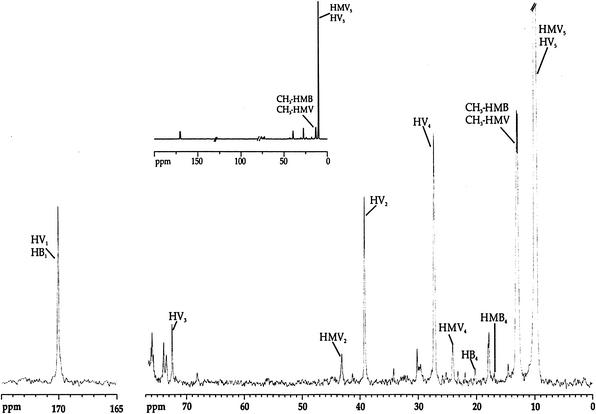
The 13C-NMR spectrum of extracts derived from cells that were allowed to metabolize [3-13C]propionate under anaerobic conditions was rather informative (Fig. 4). In addition to the HV resonances observed at 9.4 ppm in the spectra of living cells, it was also possible to detect resonances due to hydroxymethylvalerate (HMV), hydroxybutyrate (HB), and hydroxymethylbutyrate (HMB) (Fig. 4). To calculate the percentages of isotopic enrichment in HV, chloroform extracts were also analyzed by gas chromatography to quantify total HV. The total amount of 13C corresponding to each resonance was determined by comparison with the intensity of the resonance due to a known amount of benzene added to the NMR sample and used as a concentration standard. The isotopic enrichment of a given carbon was calculated from the difference between the measured 13C and the corresponding natural abundance divided by the total concentration, as determined by gas chromatography analysis. The percentage of isotopic enrichment for each carbon of HV was: HV5, 59%; HV4, 5.0%; HV3, 1.1%; HV2, 3.5%; and HV1, 2.8%.
FIG. 4.
13C-NMR spectrum of a chloroform extract obtained from activated sludge to which [3-13C]propionate was supplied in anaerobic conditions. In the inset, part of the same spectrum where the vertical scale was reduced in order to make evident the ratio of intensities between the different peaks is presented.
The ratio between the amount of HV and HMV in the polymer formed can be obtained from the area ratio between the CH2 (HV4) resonance of HV (at 27.2 ppm) and the CH2 (HMV4) resonance of HMV (at 24.1 ppm). The molar ratio was 4.4. The molar composition of the PHA formed was determined from the intensities of the methyl resonances due to HV5, HMV5, HMB5, and HB4: 74.2% of HV, 16.9% of HMV, 8.6% of HMB, and 0.3% of HB. Based on these percentages, the average value of carbon atoms in the monomeric unit of PHA is 5.17. The contribution of HB was neglected in these calculations.
The ratio of phosphorus released to propionate consumed (moles of P/moles of C) was 0.20 (average of three assays).
(ii) Aerobic phase.
At the end of the anaerobic phase, cells were washed and resuspended in mineral medium containing phosphorus but without a carbon source, and the atmosphere was switched to air. 13C- and 31P-NMR spectra were acquired alternately for approximately 4 h (Fig. 5). The intensity of PHA resonances decreased with time concomitantly with an increase in the intensity of resonances due to C-1, C-2, C-5, and C-6 in glycogen. PHA was not fully consumed after about 4 h under air, but by then phosphorus was no longer taken up, and therefore the aerobic phase was interrupted. A similar pattern of labeling in glycogen was observed in earlier studies with [2-13C]acetate as the substrate (23).
For 1 C mol of propionate consumed in the first anaerobic phase, at least 0.54 C mol of glucose was formed in the aerobic phase (taking into account that the NMR detectability of glycogen in these cells is 60% [23]). From the consumption of 1 C mol of PHA degraded in the aerobic phase, 0.37 mol of phosphorus was taken up. Formation of polyphosphate was not detected in 31P-NMR spectra of living cells, most likely due to the high degree of immobilization of this polymer.
(iii) Second anaerobic phase.
Activated sludge was subjected to a second anaerobic phase in which nonlabeled propionate was added at a final concentration of 10 mM (Fig. 6) with the objective of assessing the consumption of labeled glycogen and the formation of PHA derived from labeled glycogen. Only a slight increase in the 9.4 ppm resonance was observed, corresponding to a small increase in the resonance due to methyl groups in the three-carbon moieties of HV and HMV, although a considerable amount of glycogen was consumed (Fig. 6). This shows that the label present in glycogen ended up in carbon groups other than the methyl groups of HV units. From our previous studies with activated sludge (23), we know that the methylene groups of PHAs in living cells originate very broad resonances, and this explains our failure to detect other carbon groups derived from labeled glycogen.
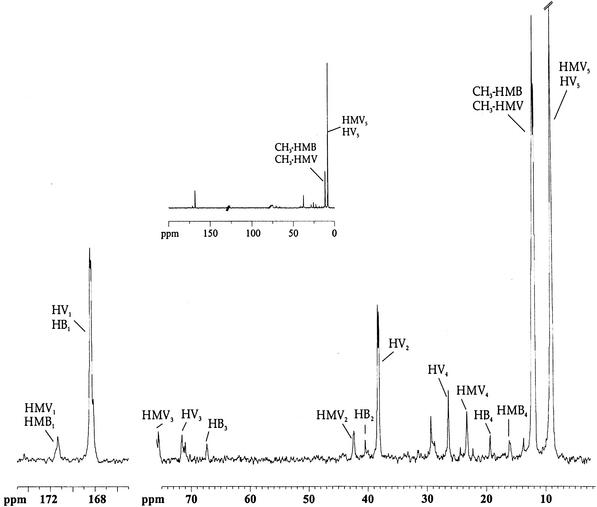
Further information on the fate of the label in glycogen was obtained from the 13C-NMR analysis of cell extracts derived from cells collected at the end of the second anaerobic phase (Fig. 7), which showed significant differences in the ratios of resonance intensities compared to extracts of the first anaerobiosis (Table 1). In particular, in this second anaerobic phase there was enhancement of labeling on CH2 (HV2) compared to CH2 (HV4) (compare Fig. 4 and 7), whereas the ratio of resonance intensity between CH3 (HV5) and CH2 (HV4) was not significantly affected. This shows that the acetyl units needed for the synthesis of HV are derived primarily from glycogen. This conclusion is further supported by the two following observations (Table 1): (i) the enrichment on CH2 (HMV4) relative to CH2 (HMV2) did not change and (ii) the enrichment of CH3 (HV5) relative to CH3 (HB4) clearly decreased. In summary, the propionyl units in PHA are mainly derived from propionate, whereas the acetyl units come from glycogen.
FIG. 7.
13C-NMR spectrum of a chloroform extract obtained from activated sludge at the end of a second anaerobic phase to which nonlabeled propionate was supplied. In the inset, part of the same spectrum where vertical scale was reduced in order to become evident the ratio of intensities between the different peaks is presented.
TABLE 1.
Ratios of resonance intensities in the fully relaxed 13C-NMR spectra of chloroform extracts obtained after the first and second anaerobic stages for specific carbons in HV, HB, and HMVa
| Anaerobic stage | Resonance intensity ratio
|
|||
|---|---|---|---|---|
| CH3(HV5) | CH2(HV4) | CH2(HMV4) | CH3(HV5) | |
| CH2(HV4) | CH2(HV2) | CH2(HMV2) | CH3(HB4) | |
| First | 9.65 | 1.45 | 1.27 | 233.76 |
| Second | 13.19 | 0.32 | 1.37 | 66.30 |
Data were derived from parallel experiments.
DISCUSSION
The polymer formed from propionate during anaerobiosis was composed essentially of hydroxyvalerate units, whereas hydroxybutyrate is the major component of PHA derived from acetate (2, 4, 19, 23, 27). The specific composition of the polymer synthesized from propionate was: hydroxyvalerate, 74.2%; hydroxymethylvalerate, 16.9%; hydroxybutyrate, 0.3%; and hydroxymethylbutyrate, 8.6%. The presence of these monomers was previously reported in activated sludge when acetate, propionate, or lactate was used as the carbon source (27). These authors found the following percentages of monomers in PHA derived from propionate: HV, 44.6%; HMV, 48.2%; HB, 1.8%; and HMB, 5.4%. The most notable difference between these and our results concerns the proportions of HV and HMV and is probably due to different populations and/or metabolism.
The several carbons in hydroxyvalerate synthesized during the first anaerobic phase showed rather different levels of isotopic enrichment: HV5, 59%; HV4, 5.0%; HV3, 1.1%; HV2, 3.4%; and HV1, 2.8%. Thus, except for HV3, all the carbon atoms in HV were significantly enriched from [3-13C]propionate. As expected, a large proportion of the supplied label ended up on carbon C-5 of HV, directly derived from the pool of propionyl-CoA, which is primarily labeled on C-3. The extent of isotopic enrichment observed on HV5, which is considerably lower than that of [3-13C]propionate, reflects primarily the presence of nonlabeled internal reserves of PHA. The significant degree of labeling on other carbons provides valuable information on metabolic pathways.
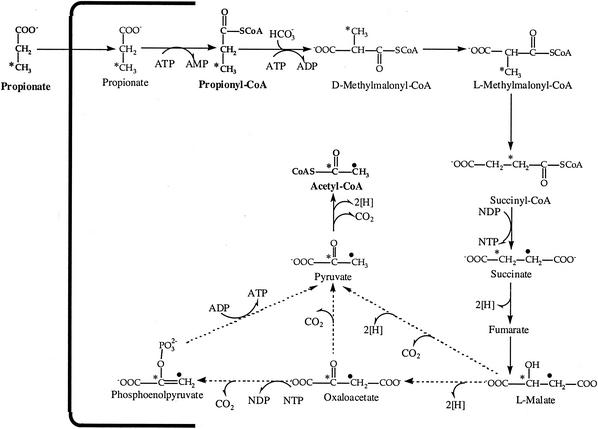
The formation of an HV unit implies the combination of a propionyl moiety and an acetyl moiety. The observed labeling pattern on the acetyl moiety (C-1 and C-2) is explained by the metabolic scheme presented in Fig. 8, similar to that proposed earlier for obtaining acetyl-CoA from propionyl-CoA in Rhodococcus ruber (31). According to this proposal, the label in the CH3 group of propionate will end up in equal proportions on the CH3 and the COO− of acetyl-CoA due to scrambling of label between carbons C-2 and C-3 of succinate, a symmetrical molecule. This interpretation is supported by our experimental data, which show similar extents of labeling in HV1 and HV2. A similar labeling pattern on acetate was obtained for sludge fed with propionate and used for treatment of sulfate- and sulfide-rich wastewaters (14). Mobilization of propionate to form acetyl units is attributed to the methylmalonyl-CoA pathway. Other proposed pathways for propionate metabolism, such as α-hydroxyglutarate, citramalate, acryloyl-CoA, and the 2-methylcitric acid cycle, could not account for the labeling that we observed (revised by Horswill and Escalante-Semerena [11]).
FIG. 8.
Proposal to obtain double labeling on acetyl groups derived from [3-13C]propionate. NDP, nucleotide diphosphate; NTP, nucleotide triphosphate. *, carbons directly derived from the initial labeled 3-[13C]propionate; •, labeling derived from scrambling at the level of succinate.
The labeling in HV4 is explained by backflux from succinate to propionyl-CoA. This is further supported by the observation of a small resonance due to propionate labeled on C-2 (Fig. 3). Eventual labeling of HV3 could only be explained by the operation of the full tricarboxylic acid cycle or the glyoxylate shunt, which lead to identical labeling patterns on succinyl-CoA. However, the set of results presented here do not suggest significant labeling of HV3.
An additional source of acetyl groups has to exist because the metabolic scheme proposed here explains the origin of only a small part of the acetyl moieties needed for PHA synthesis; our data identify glycogen, a carbon reserve metabolized during the anaerobic phase, as the primary precursor for acetyl units in PHA, confirming the hypothesis put forward by Satoh et al. (27).
The isotopic enrichment in HV2 and HV1 is 3.4% and 2.8%, respectively. Therefore, approximately 6.2% (3.4 + 2.8) of the molecules in the acetyl-CoA pool are labeled on either C-1 or C-2 and should be derived from labeled propionate. The remaining 93.8% of the acetyl units must be derived from glycogen. Taking into account the number of acetyl units present in HB, HV, and HMB and the relative proportions of these monomers in the PHA, 83.4 acetyl units are required to synthesize 100 PHA monomers, of which 78.2 were derived from glycogen. Thus, 39.1 mol of glucose will be catabolized to the level of acetyl-CoA, producing 156.4 reducing equivalents. This would represent a clear excess compared with the 100 reducing equivalents required to synthesize 100 PHA monomers.
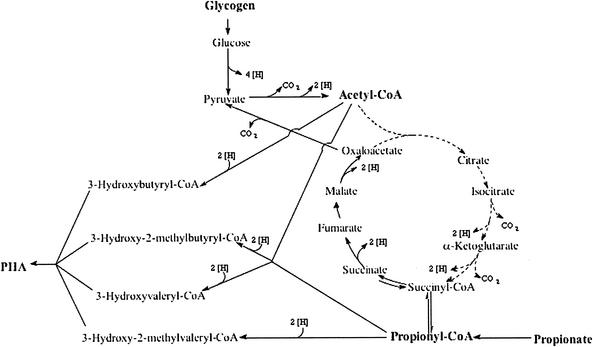
A possible explanation for this excess could be that the conversion of pyruvate to acetyl-CoA would not be coupled to NADH production but rather to hydrogen evolution. This process has been widely described among anaerobic organisms (8). To check this hypothesis, a batch experiment was carried out in a closed reactor without gas bubbling. Analysis of the gaseous phase by gas chromatography during the metabolism of propionate confirmed the production of hydrogen (results not shown). Therefore, we propose that only 78.2 mol of NAD(P)H are generated in this cell system. In an earlier study with acetate as the substrate (23), we proposed the contribution of the full TCA cycle to produce the missing reducing equivalents; however, this hypothesis is weakened by the lack of significant labeling of HV3.
Several authors (12, 20) contested the operation of the full TCA cycle under anaerobic conditions due to the need to regenerate FADH2 resulting from the conversion of succinate to fumarate, which is not directly utilized in PHA synthesis. However, our results definitely demonstrate the operation of succinate dehydrogenase under anaerobic conditions, since the two carbons in the acetyl moiety in HV are labeled from propionate (Fig. 9). Other authors have proposed the operation of this metabolic reaction under anaerobic conditions in enhanced biological phosphorus removal to explain the decreased production of PHA when an inhibitor of succinate dehydrogenase, malonate, was used (16).
FIG. 9.
Metabolic model for the conversion of propionate and glycogen into the four different types of PHA detected in activated sludge under anaerobic conditions. Broken lines indicate reactions in the TCA cycle for which no final proof was obtained based on 13C labeling analysis.
Earlier we proposed a metabolic model for the metabolism of acetate by activated sludge in enhanced biological phosphorus removal that is also based on noninvasive NMR. In both cases, glycogen acts as a source of reducing equivalents and also of precursors for the synthesis of PHA; however, when the substrate is acetate, glycogen is primarily channeled to the synthesis of propionyl-CoA, whereas glycogen is mainly directed to the synthesis of acetyl-CoA units when propionate is the substrate.
In this study, solid experimental evidence supporting the operation of succinate dehydrogenase under anaerobic conditions is presented. A clear proof of labeling on carbon C-3 of HV monomers derived from [3-13C]propionate would constitute a final demonstration of the operation of the full TCA cycle. The enzymatic machinery that allows the regeneration of flavin adenine dinucleotide under anaerobic conditions remains elusive.
Acknowledgments
This work was supported by Fundação para a Ciência e Tecnologia (FCT) under project PEAM/C/SEL/494/95. L.S.S. and P.C.L. acknowledge Fundação para a Ciência e Tecnologia for grants PRAXIS XXI/BD/18287/98 and PRAXIS XXI/BPD/20197/99.
We are grateful to João Crespo for useful suggestions and support concerning the operation of the sequencing batch reactor. We thank Claudia Vieira for helpful operation of the fermentors.
REFERENCES
- 1.American Public Health Association. 1989. Standard methods for the examination of water and wastewater, 17th ed. American Public Health Association, Washington, D.C.
- 2.Arun, V., T. Mino, and T. Matsuo. 1989. Metabolism of carboxylic acids located in and around the glycolytic pathway and the TCA cycle in the biological phosphorus removal process. Water Sci. Technol. 21:363-374. [Google Scholar]
- 3.Carrucci, A., M. Majone, R. Ramadori, and S. Rosseti. 1994. Dynamics of phosphorus and organic substrates in anaerobic and aerobic phases of a sequencing batch reactor. Water Sci. Technol. 30:237-246. [Google Scholar]
- 4.Comeau, Y., K. J. Hall, R. E. W. Hancock, and W. K. Oldham. 1986. Biochemical model for enhanced biological phosphorus removal. Water Res. 20:1511-1521. [Google Scholar]
- 5.Comeau, Y., W. K. Oldham, and K. J. Hall. 1987. Dynamics of carbon reserves in biological dephosphatation of wastewaters, p. 39-55. In R. Ramadori (ed.), Biological phosphate removal from wastewaters: proceedings of the International Conference of Advanced Water Pollution Control. Pergamon Press, Oxford, United Kingdom.
- 6.Crocetti, G. R., P. Hugenholtz, P. L. Bond, A. Schuler, J. Keller, D. Jenkins, and L. L. Blackall. 2000. Identification of polyphosphate-accumulating organisms and design of 16S rRNA-directed probes for their detection and quantitation. Appl. Environ. Microbiol. 66:1175-1182. [DOI] [PMC free article] [PubMed] [Google Scholar]
- 7.Fuhs, G. W., and M. Chen. 1975. Microbiological basis of phosphate removal in the activated sludge process for the treatment of wastewater. Microb. Ecol. 2:119-138. [DOI] [PubMed] [Google Scholar]
- 8.Gottschalk, G. 1986. Bacterial metabolism, 2nd ed. Springer-Verlag, New York, N.Y.
- 9.Hesselmann, R. P. X., C. Werlen, D. Hahn, J. R. van der Meer, and A. J. B. Zehnder. 1999. Enrichment, phylogenetic analysis, and detection of a bacterium that performs enhanced biological phosphate removal in activated sludge. Int. J. Syst. Appl. Microbiol. 22:454-465. [DOI] [PubMed] [Google Scholar]
- 10.Hesselmann, R. P. X., R. von Rummel, S. M. Resnick, R. Hany, and A. J. B. Zehnder. 2000. Anaerobic metabolism of bacteria performing enhanced biological phosphate removal. Water Res. 34:3487-3494. [Google Scholar]
- 11.Horswill, A. R., and J. Escalante-Semerena. 1999. Salmonella typhimurium LT2 catabolizes propionate via the 2-methylcitric acid cycle. J. Bacteriol. 181:5615-5623. [DOI] [PMC free article] [PubMed] [Google Scholar]
- 12.Kortstee, G. J. J., K. J. Appeldoorn, C. F. C. Bonting, E. W. J. Niel, and H. W. van Veen. 2000. Recent developments in the biochemistry and ecology of enhanced phosphorus removal. Biochemistry (Moscow) 65:394-404. [PubMed] [Google Scholar]
- 13.Lemos, P. C., C. Viana, E. N. Salgueiro, A. M. Ramos, J. P. S. G. Crespo, and M. A. M. Reis. 1998. Effect of carbon source on the formation of polyhydroxyalkanoates (PHA) by a phosphate-accumulating mixed culture. Enzyme Microb. Technol. 22:662-671. [Google Scholar]
- 14.Lens, P. N. L., C. Dijkema, and A. J. M. Stams. 1998. 13C-NMR study of propionate metabolism by sludges from bioreactors treating sulfate and sulfide rich wastewater. Biodegradation 9:179-186. [DOI] [PubMed] [Google Scholar]
- 15.Liu, Y. H. 1998. Relation between sludge carbohydrate content and biological phosphate removal. Water Res. 32:1635-1641. [Google Scholar]
- 16.Louie, T. M., T. J. Mah, W. Oldham, and W. D. Ramey. 2000. Use of metabolic inhibitors and gas chromatography/mass spectrometry to study poly-β-hydroxyalkanoates metabolism involving cryptic nutrients in enhanced biological phosphorus removal systems. Water Res. 34:1507-1514. [Google Scholar]
- 17.Maszenan, A. M., R. J. Seviour, B. K. C. Patel, P. Schumann, J. Burghardt, Y. Tokiwa, and H. M. Stratton. 2000. Three isolates of novel polyphosphate-accumulating Gram-positive cocci, obtained from activated sludge, belong to a new genus, Tetrasphaera gen. nov., and description of two new species, Tetrasphaera japonica sp. nov. and Tetrasphaera australiensis sp. nov. Int. J. Syst. Evol. Microbiol. 50:593-603. [DOI] [PubMed] [Google Scholar]
- 18.Maurer, M., W. Gujer, R. Hany, and S. Bachmann. 1997. Intracellular carbon flow in phosphorus accumulation organisms from activated sludge. Water Res. 31:907-917. [Google Scholar]
- 19.Mino, T., V. Arun, Y. Tsuzuki, and T. Matsuo. 1987. Effect of phosphorus accumulation on acetate metabolism in the biological phosphorus removal process. p. 27-38. In R. Ramadori (ed.), Biological phosphate removal from wastewaters: proceedings of the International Conference of Advanced Water Pollution Control. Pergamon Press, Oxford, United Kingdom.
- 20.Mino, T., M. C. M. Loosdrecht, and J. J. Heijnen. 1998. Microbiology and biochemistry of the enhanced biological phosphate removal process. Water Res. 32:3193-3207. [DOI] [PubMed] [Google Scholar]
- 21.Nakamura, K., A. Hiraishi, Y. Yoshimi, M. Kawaharasaki, K. Masuda, and Y. Kamagata. 1995. Microlunatus phosphovorus gentile, gen. nov., sp. nov., a new gram-positive polyphosphate-accumulating bacterium isolated from activated sludge. Int. J. Syst. Bacteriol. 32:1-14. [DOI] [PubMed] [Google Scholar]
- 22.Neves, A. R., A. Ramos, C. Shearman, M. J. Gasson, J. S. Almeida, and H. Santos. 2000. Metabolic characterization of Lactococcus lactis deficient in lactate dehydrogenase with 13C-NMR. Eur. J. Biochem. 267:3859-3868. [DOI] [PubMed] [Google Scholar]
- 23.Pereira, H., P. C. Lemos, M. A. M. Reis, J. P. G. Crespo, M. J. T. Carrondo, and H. Santos. 1996. Model for carbon metabolism in biological phosphorus removal processes based on in vivo 13C-NMR labeling experiments. Water Res. 30:2128-2138. [Google Scholar]
- 24.Pramanik, J., P. L. Trelstad, A. J. Schuler, D. Jenkins, and J. D. Keasling. 1999. Development and validation of a flux-based stoichiometric model for enhanced biological phosphorus removal metabolism. Water Res. 33:462-476. [Google Scholar]
- 25.Santos, H., and D. L. Turner. 1986. Characterization of the improved sensitivity obtained with a flow method for oxygenation and mixing cell suspension. J. Magnet. Reson. 68:345-349. [Google Scholar]
- 26.Santos, H., P. Fareleira, J. LeGall, and A. V. Xavier. 1994. In vivo nuclear magnetic resonance in study of physiology of sulphate reducing bacteria. Methods Enzymol. 243:543-558. [Google Scholar]
- 27.Satoh, H., T. Mino, and T. Matsuo. 1992. Uptake of organic substrates and accumulation of polyhydroxyalkanoates linked with glycolysis of intracellular carbohydrates under anaerobic conditions in the biological excess phosphate removal processes. Water Sci. Technol. 26:933-942. [Google Scholar]
- 28.Stante, L., C. M. Cellammare, F. Mamaspina, G. Bortone, and A. Tilche. 1997. Biological phosphorus removal by pure culture Lampropedia spp. Water Res. 31:1317-1324. [Google Scholar]
- 29.Wang, N., J. Peng, and G. Hill. 2002. Biochemical model of glucose induced enhanced biological phosphorus removal under anaerobic conditions. Water Res. 36:45-58. [DOI] [PubMed] [Google Scholar]
- 30.Wentzel, M. C., L. H. Lötter, R. E. Loewenthal, and G. V. R. Marais. 1986. Metabolic behavior of Acinetobacter spp. in enhanced biological phosphorus removal—a biochemical model. Water S. A. (Pretoria) 12:209-224. [Google Scholar]
- 31.Williams, D. R., A. J. Anderson, E. A. Dawes, and D. F. Ewing. 1994. Production of a copolyester of 3-hydroxybutyric acid and 3-hydroxyvaleric acid from succinic acid by Rhodococcus ruber: biosynthetic considerations. Appl. Microbiol. Biotechnol. 40:717-723. [Google Scholar]


