Cardiac computed tomography (CT) is a very rapidly evolving modality. I'd like to discuss some of the older applications of cardiac CT, and then move on to highlight some of the exciting newer applications. Currently, there are many ways to image the heart. We certainly don't need another form of stress testing. Perfusion testing is already performed excellently with nuclear and magnetic resonance imaging. Cardiac CT adds 5 unique applications that are different from the other imaging modalities currently available in cardiology (Table I).
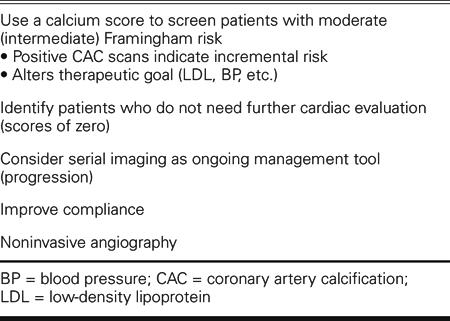
TABLE I. Five Current Uses of Cardiac Computed Tomography

The first is in the measurement of calcium scores for screening patients with an intermediate Framingham risk. The Framingham model is very well validated and very well accepted. The problem is that the NCEP (National Cholesterol Education Program) guidelines have 6 different target levels for low-density lipoprotein cholesterol (LDL)—anywhere between 70 and 220 mg/dL, depending on the patient's risk. So it would be very useful to more precisely risk-stratify those patients who fall in the middle.
In just the past few months, a number of studies, which together encompass tens of thousands of patients, have been published. Part of the reason that the guidelines for use of coronary calcium have not kept up with the science is that the science is rapidly evolving. A score of zero—that is, no detectable coronary calcium—is associated with a remarkably low 5-year risk, lower than traditional Framingham low-risk categories. So a score of zero is somewhat reassuring: the person has no advanced plaque and is at a very low risk of cardiovascular events.
As the calcium score goes above 100, we start to move into what is considered an NCEP high risk of 2% per year, or a 20% 10-year risk. The rule for traditional risk factors runs on the order of two; for instance, you are twice as likely to have a heart attack if you're hypertensive. However, in a recent large study, you were 10 times more likely to have a heart attack if you had a calcium score above 100. So the incremental risk of a high calcium score is robust, and it adds significantly to the predictive area under the Framingham risk-receiver operating characteristic curve— something that C-reactive protein doesn't really do, and something that even LDL cholesterol doesn't do. A larger, longer-term study in 10,000 patients showed that you're about 7 times more likely to die with a high calcium score. Again, you were only about twice as likely to die if you were hypertensive, smoked, or had diabetes; calcium scores provide incremental and independent risk to these traditional risk factors. A diabetic with a high calcium score was at much higher risk than a nondiabetic with a high score, or than a diabetic with a low calcium score.
An Army cohort study called the PACC (Prospective Army Coronary Calcium) was published in September 2005. This study involved patients with a mean age of 43 years. Even these relatively young, asymptomatic men were 12 times more likely to have cardiac events if they had a high calcium score when compared with those who did not. So, from a practical perspective, you can use calcium scoring for people in the middle of the traditional risk spectrum—the people who might or might not need to be on a statin for life. You scan them. If their scores are high, then you can be assured that their risks are high and that they should be treated more aggressively. If their scores are low, you can be very confident that their risks are low: in such patients, diet and exercise may be the most appropriate first-line preventive therapies.
A second major area of clinical application for cardiac CT lies in identifying people who may not need further diagnostic evaluation after an equivocal test result, such as might be had with a treadmill or a thallium scan. An ambiguous functional test result makes it uncertain whether these patients have coronary artery disease or need angiography. In a recent 1,800-patient study,1 the sensitivity of calcium scoring for identifying patients with blockages was over 99%. How does such a sensitive test help us? It becomes very useful as a screening test, because if it's negative (no calcium present), there is a very high likelihood that the person doesn't have obstructive coronary artery disease—a high negative predictive value. If you come to the cath lab with a score of zero, the chance of finding nonobstructive disease or normal coronaries is over 99%. If we use a calcium score in these sorts of circumstances to identify people who may not need catheterization, a negative predictive value of 99% means that we probably could eliminate up to one third of the unnecessary procedures in our cath lab. A simple $200 or $300 calcium scan might avoid the need for invasive testing costing multiple thousands of dollars. Calcium scores can certainly help in these circumstances, and CT angiograms, which I'll discuss later, can help even more.
Another potential application for CT is monitoring the progression of disease over time. I have to confess that at present we really don't have enough data to make any firm recommendations; but what data we have are very provocative. In a recent study, patients were all treated with a statin to the same average LDL, and then underwent CT scanning. Those patients whose calcium scores did not increase over time had no cardiac events; among patients whose calcium scores continued to rise, 1 out of 3 had a cardiac event over the next 7 years. Progressors were 17 times more likely to experience a cardiac event than were nonprogressors.
In the effort to get a patient to take prescribed medication (compliance with therapy), a picture may be worth a thousand words. We just published a very interesting study of 1,000 patients, which demonstrated that the higher the calcium score, the more likely the patient is to take his or her medication. Current compliance with statin therapy is not very good. You can't make an asymptomatic patient feel better. Showing patients that they have plaque in their coronaries may help: we demonstrated that patients with high scores were 9 times more likely to stay on their pills, not over a few months, but over a few years. This is a preliminary, but provocative, finding.
The final, and perhaps most exciting, current clinical application of cardiac CT is for noninvasive angiography, which has come a long way in recent years. Electron beam tomography was good for calcium scoring, but limited for angiography because of its limited resolution. Early 4-slice CT was also not particularly good for cardiac imaging—then along came the real breakthrough of 16-slice CT, which had a sensitivity and specificity for obstructive coronary artery disease of greater than 90%. And now 64-slice appears to be even better. Please remember that a larger number of slices does not necessarily mean higher resolution; it just means that you are covering more of the heart at once. Image resolution doesn't improve dramatically when you go from 16 to 64 slices; it just takes a shorter time to acquire images, and with a moving object, such as the heart, this can be important. The 64-slice images can be really impressive. An initial paper showed a sensitivity of 94% and a specificity of 97%—almost too good to be true. Even cardiac catheterization studies that compare to other cardiac catheterization procedures don't always achieve 95% accuracy.
A 2nd study in 70 patients was not quite as good: it showed a sensitivity of 95% and a specificity of only 90%. However, one very important issue identified by this study was heart rate. Remember that multi-slice CT takes time to acquire images, and you need heart rates in the 50s or 60s to get really good images. In this study, when the heart rate was less than 70 beats/min, the sensitivity was 97% and the specificity was 95%, very similar to results in the initial study. When the heart rate was greater than 70 beats/min, the accuracy dropped to 80% or lower.
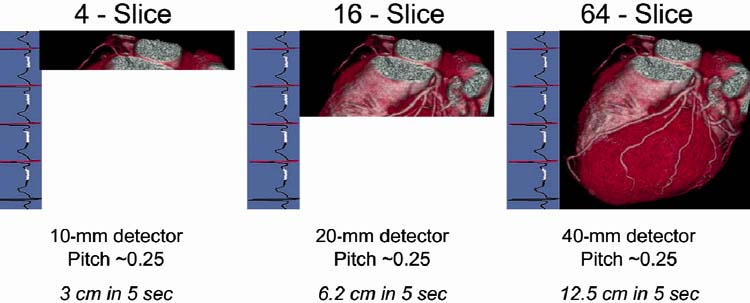
Why is 64-slice so much better? On the left side of Figure 1 is what you get in 5 seconds with the 4-slice CT. In the middle is 16-slice CT, and on the right is 64-slice CT. We cover more territory faster, so the breath-hold time goes down, and the need for iodinated contrast dose goes down. We use the same dye as in the cath lab, but much less of it because we're covering the entire heart in 5 seconds. There's less chance for PVCs (premature ventricular contractions), and less chance that the patient won't be able to hold his or her breath for the study.

Fig. 1 Cardiac images acquired in 5 heartbeats by (left to right) 4-slice, 16-slice, and 64-slice computed tomographic angiography.
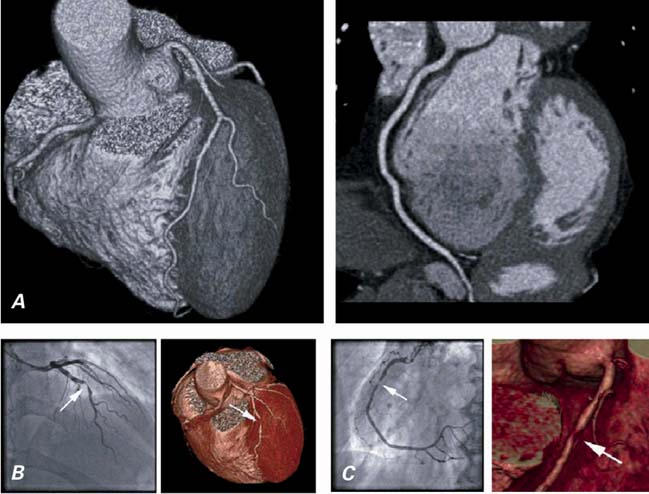
And the pictures are truly spectacular (Fig. 2). These are not “one-in-a-thousand” images; they are more in the way of routine, everyday images. In some regards, we can see more than we usually do in the cath lab, and in others, less. We see less of the small vessels and less of the side branches with CT; but with CT we can see beyond the lumen into the vascular wall. Intravascular ultrasonography remains the gold standard for imaging plaque within the vessel, but CT is beginning to show us some of this information, as well.

Fig. 2 A) Normal heart as imaged by CT angiography. B) Significant coronary obstruction as shown by conventional angiography and CT angiography. C) Anatomic detail of coronary obstruction as shown by conventional angiography and CT angiography.
CT = computed tomographic
Stents are still a challenge. You simply can't see well within a stent, and you should not be using CT angiography to evaluate in-stent restenosis, even with 64-slice CT. The struts cause artifacts, and you cannot always see the entire length of the stent. You'll occasionally see some beautiful images, but most of the day-to-day images are not really helpful.
For bypass grafts, CT angiograms are wonderful, for a number of reasons. We can tell which grafts are open and which are closed, so we don't have to go fishing in the aorta at the time of cardiac catheterization. Computed tomographic angiography can also help the surgeon to visualize and evaluate the mammary arteries. We can see how much plaque is in the aorta; if there's a lot, patients are 7 to 9 times more likely to have a stroke at the time of bypass grafting. A surgeon who knows that in advance can perhaps modify the approach.
We can also use cardiac CT (or magnetic resonance imaging) to create images of the left atrium and pulmonary veins; these images are then overlaid on mapping data acquired in the electrophysiology lab. This makes the procedure potentially more accurate and, one hopes, enables a better outcome. Computed tomographic angiography can also be used to clearly visualize and identify high-grade stenoses in renal and carotid arteries.
Cardiac CT scans can be used as a “triple rule-out” in the emergency room for patients with chest pain. The coronary arteries, aorta, and pulmonary vessels can all be visualized with a single scan. The problem is that very few people can read all 3 components to exclude critical coronary disease, aortic dissection, or pulmonary embolism. Until more people are trained in cardiac CT, it's not ready for prime time as this sort of screening tool.
Conclusions: Cardiac CT angiography is a powerful diagnostic tool with a high negative predictive value, if the image quality is sufficient. Remember, though, that accuracy is not 100%, and that, particularly in the heart, all vessels cannot always be visualized.
Footnotes
Address for reprints: Matthew J. Budoff, MD, Medical Director, Los Angeles Biomedical Research Institute at Harbor-UCLA, 1000 W. Carson Street RB2, Torrance, CA 90502. E-mail: budoff@ucla.edu
Presented at the Texas Heart Institute's symposium “Evolving Standards in Cardiovascular Care: What Have We Learned? Where Are We Going?” held at the Adam's Mark Hotel; 12 November 2005; Dallas


