



Abstract
In mammals, Toll-like receptors (TLR) recognize ligands, including pathogen-associated molecular patterns (PAMPs), and respond with ligand-specific induction of genes. In this study, we establish evolutionary conservation in teleost fish of key components of the TLR-signaling pathway that act as switches for differential gene induction, including MYD88, TIRAP, TRIF, TRAF6, IRF3, and IRF7. We further explore this conservation with a molecular phylogenetic analysis of MYD88. To the extent that current genomic analysis can establish, each vertebrate has one ortholog to each of these genes. For molecular tree construction and phylogeny inference, we demonstrate a methodology for including genes with only partial primary sequences without disrupting the topology provided by the high-confidence full-length sequences. Conservation of the TLR-signaling molecules suggests that the basic program of gene regulation by the TLR-signaling pathway is conserved across vertebrates. To test this hypothesis, leukocytes from a model fish, rainbow trout (Oncorhynchus mykiss), were stimulated with known mammalian TLR agonists including: diacylated and triacylated forms of lipoprotein, flagellin, two forms of LPS, synthetic double-stranded RNA, and two imidazoquinoline compounds (loxoribine and R848). Trout leukocytes responded in vitro to a number of these agonists with distinct patterns of cytokine expression that correspond to mammalian responses. Our results support the key prediction from our phylogenetic analyses that strong selective pressure of pathogenic microbes has preserved both TLR recognition and signaling functions during vertebrate evolution.
Keywords: pro-inflammatory cytokine, interferon, MYD88, TIRAP, TRIF, TRAF6, IRF3, phylogeny, molecular tree, PHYLIP
1. Introduction
The Toll-like receptor (TLR) family of genes encodes important recognition receptors of the innate immune system that have been conserved in both the invertebrate and vertebrate lineages (Medzhitov et al. 2000). The overall protein structure of a TLR has been conserved throughout deuterostome evolution (Xu et al., 2000). TLR genes have been identified in many vertebrates (Roach et al., 2005, and references therein). TLRs recognize a variety of endogenous and exogenous ligands. The exogenous ligands are often molecules characteristic of a class of pathogens or which are essential for pathogen survival; these ligands have been collectively termed “pathogen-associated molecular patterns” (PAMPs). The recognition of PAMPs by the TLRs allows the innate immune system to distinguish among classes of pathogens and orchestrate appropriate innate and adaptive immune responses. This orchestration is achieved by differential induction of cytokines and co-stimulatory molecules depending on which TLR is stimulated. The pattern of cytokine expression following stimulation depends on the type of agonist used, the TLR(s) recognizing the agonist, the cell types stimulated, and the repertoire of TLRs expressed by those cell types (Iwasaki et al., 2004).
The TLR signaling pathway in mammals is complex, but is characterized by central themes that are coordinated by highly conserved signaling proteins. The fundamentals of TLR signaling in mammals have been reviewed (Akira, 2003). The elucidation of all of the proteins and precise interactions of all the TLR signaling pathways is an area of active research (Beutler, 2004). Two major batteries of genes are induced by different TLR agonists: inflammatory genes and interferon responsive genes (Figure 1). A particular TLR agonist may activate one, the other, or both of these batteries. This simple model of two gene batteries, or any model utilizing the key components analyzed in this paper, suffices to illustrate the hypotheses tested in this study.
Figure 1.
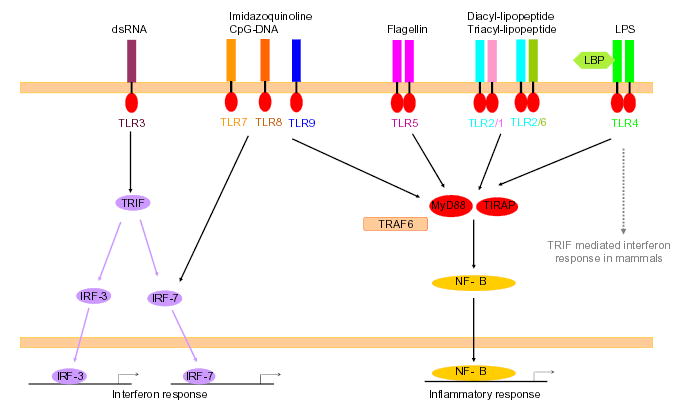
A cartoon of TLR signaling. This simplified cartoon illustrates the role key conserved signaling molecules might play in adapting the input from TLR agonists to produce conserved induction of specific batteries of genes. The topology of this cartoon is greatly simplified to facilitate discussion. For example, TLR3, TLR7, TLR8, and TLR9 typically interact with their ligands in endosomes. Citations for cartoons that more completely represent the current body of knowledge are provided in the text.
Key adapter proteins in TLR signaling pathways, like the receptors themselves, are conserved among vertebrates (Prothmann et al., 2000; Lynn et al., 2003). TLR receptors are composed of a leucine-rich region and a toll-interleukin-resistance (TIR) domain. Several TLR signaling molecules or TIR-domain containing genes have been identified in fish (Zhang et al., 2003; Jault et al., 2004; Meijer et al., 2004). In the work presented here, we extend the knowledge of conservation of several of these genes to the pufferfish Takifugu rubripes. Given the conservation of these elements, we predicted that cells from fish should be able to respond to many of the known agonists of the mammalian TLRs.
Functional studies using Takifugu are difficult, so to test this hypothesis we used another model teleost species, rainbow trout (Oncorhynchus mykiss). Leukocytes were isolated from the anterior kidney (the bone marrow equivalent in fish) and stimulated with known mammalian TLR agonists. Three classes of cytokine genes were examined in this study including: (i) type I interferon, (ii) genes encoding pro-inflammatory cytokines (interleukin 1 beta isoform 1, interleukin 8, and tumor necrosis factor alpha isoforms 1 and 2), and (iii) the immunoregulatory cytokine transforming growth factor beta1 (Hardie et al., 1998; Zou et al., 1999a; Zou et al., 1999b; Laing et al., 2001; Laing et al., 2002; Zou et al., 2002). Additionally, we examined expression of the rainbow trout MyD88 and IRF3 orthologs.
In this study, we report a molecular phylogenetic analysis of several key components of the TLR signaling cascade, and incorporate newly reported Takifugu sequences. These key molecules are highly conserved among vertebrates, and so follows the prediction that responses to TLR stimulation should be conserved between fish and mammals. This hypothesis was tested and we report that rainbow trout can functionally respond to a number of TLR agonists and that their differential patterns of cytokine expression are similar to those observed in mammals. Additionally, we present a method for including incomplete sequences in phylogenetic trees without disturbing the topology of the tree provided by high-confidence sequences. This methodology is particularly useful for phylogenetic analysis of genes from species, including many teleost fish, for which EST data is available but no genome has been sequenced.
2. Materials and Methods
2.1 Sequencing and assembly
A draft genome sequence of Takifugu rubripes was obtained by pairwise shotgun sequencing through the efforts of an international collaboration (Roach et al. 1995; Aparicio et al. 2002). All sequences used in the draft assembly were derived from a single fish. Thus, possibly one but probably two alleles were included in the assembly of each contig. Putative gene loci were identified with BLAST.
2.2 Bioinformatics
To be considered a MYD88 ortholog for our analysis, a sequence had to either (i) contain both a death domain and a C-terminal TIR domain, or (ii) have significant sequence identity and an unambiguous best reciprocal match to a previously identified MYD88. The second criterion allows the inclusion of ESTs and fragments from incomplete genomic pairwise assemblies. To form the basis of multiple alignments and molecular trees (our “core” analysis), vertebrate sequences from the non-redundant DDBJ/EMBL/NCBI database (Genbank) were identified no later than July 2005 by BLAST similarity to known MYD88s (Supplemental Table 1). Sequence data for TC8784 was obtained from The Institute for Genomic Research website at www.tigr.org. Supplemental Table 1 assigns short nicknames to sequences to simplify presentation of our results. In cases where multiple nearly identical sequences were present, some were excluded, with a preference for retaining NCBI’s reference sequences (RefSeqs).
A gene model is a prediction including the translation start, exon boundaries, and translation stop for a gene. Gene models in well-studied organisms are often supported by mRNA sequences. Gene models from other organisms are less reliable; their reliability increases when they are based on high-quality ungapped genomic sequence and with corroboration from comparison with sequences from related species. More than one gene model can exist for a gene, such as when alternative splicing occurs. In this paper, we use a single best or longest gene model for each gene. Gene models were constructed from available sequences of draft genome sequencing projects, and/or revised from Genbank gene models. The XP_516368 chimpanzee MYD88 gene model contains a string of inserted residues inconsistent with the intron/exon structure in related species; we made a corrected model. The CAG04257 Tetraodon MYD88 gene model contains a string of inserted residues inconsistent with the intron/exon structure in related species; we made a corrected model. The Xenopus tropicalis gene model is from scaffold identifier 318.1 of the draft Xenopus genome. We made a Takifugu MYD88 gene model. Our Takifugu gene model is missing approximately 32 residues from its C-terminus as there is a gap in the draft assembly. We constructed gene models for Takifugu TIRAP, TRIF, TRAF6, IRF3, and IRF7. All of our predicted protein sequences from our gene model corrections and predictions are provided in Supplemental Table 1.
Pairwise percent identity for TRIF is computed only at ungapped sites. Our region of “medium conservation” includes all such sites through residue 321 of the alignment; the region of “high conservation” includes all remaining sites. Footprinter 2.1 by (Blanchette et al. 2002) was employed for phylogenetic footprinting. MotifScanner was used as described by (Thijs et al. 2002), using TRANSFAC matrices (Wingender et al. 2001).
2.3 Semantics and nomenclature
In this paper, the term “fish” always refers to Actinopterygii. Unless specified otherwise, we use Xenopus as shorthand for Xenopus tropicalis, for which a draft genome sequence is available. We use HUGO gene names when they exist; in cases where the HUGO name for an ortholog varies between species, we use the name of the human ortholog when referring generally to a gene. Aliases for TIRAP include Mal, wyatt, and TLR4ap. Aliases for TRIF include TICAM1. A cryptochrome gene (DASH or alias cry-dash), lies upstream of MYD88 in many vertebrates but is absent in humans; thus this gene has no HUGO human gene symbol.
2.4 Molecular tree construction and multidimensional scaling
Amino-acid sequence alignments were generated with CLUSTALX (Thompson et al., 1997). Inspection of most of the resulting alignments suggested that little if any improvement could be made by manual adjustment, so the initial output of the alignment program was accepted (Supplemental Table 2). CLUSTALX could not align the clam TC8784 protein sequence properly (with the TIR domain aligned with all other TIR domains), so it was manually aligned with Se-Al using absolutely conserved residues as anchors (Rambaut, 1996). Molecular distances were computed using PROTDIST from the PHYLIP package (Felsenstein, 2004). We weighted the input to allow only alignment positions with at least 80% non-gap characters to contribute to molecular distances. Molecular trees were inferred with FITCH and portrayed with DRAWTREE. After the core tree derived from high-confidence sequences was created, additional leaves were added to the tree with the PERL script add_leaves_to_fixed_molecular_tree.pl, available from www.systemsbiology.org. This program searches all possible positions to place the additional leaf, and then places the leaf without altering the original core topology of the tree or the distances between the core leaves. The new leaf is placed to minimize the sum-of-squares difference between the distances displayed on the tree and the distances calculated for the input pairwise matrix. Multidimensional scaling (MDS) was performed as previously described (Roach et al., 1997). Sequence distances for MDS were computed only from the TIR domain, corresponding to residues 330 to 473 of the “TIR_adapters” alignment (Supplemental Table 2).
2.5 Culture of anterior kidney leukocytes
Rainbow trout fry were kindly donated by Clear Springs Food Inc. (Buhl, ID) and reared in sand-filtered and UV-treated fresh water at 14°C. Rainbow trout weighing approximately 100–150 g were given a lethal dose of tricaine methanesulfonate (MS222; Argent Laboratories) and the anterior kidney tissue was asceptically excised. Anterior kidney tissue was placed in a siliconized glass Petri dish containing 10 mL of leukocyte isolation medium (Leibovitz’s L-15 medium supplemented with 10% heat-inactivated fetal calf serum (FCS), 1.65 g/L glucose, 5 IU/mL ammonium heparin and 100 μg/mL penicillin and streptomycin). The tissue was pressed through a stainless steel screen and repeatedly drawn into a syringe to create a single cell suspension. The suspension was passed through glass wool to remove large tissue debris and layered over a 34%/51% Percoll (Sigma-Aldrich) discontinuous gradient (Braun-Nesje et al., 1982). The gradients were centrifuged at 500g for 45 minutes at 4°C and leukocytes were removed from the 34% and 51% interface. The leukocytes were washed once with Leibovitz L-15 medium with 20 IU/mL heparin and resuspended in L-15/heparin supplemented with 10% heat-inactivated FCS and 10% sterile-filtered conditioned medium from the murine aneuploid fibrosarcoma cell line (L929). The L929 cell line is a crude source of murine macrophage-colony stimulating factor (M-CSF) (Englen et al., 1995). The freshly isolated cells were transferred to 25 cm2 closed tissue culture flasks and incubated for three days at 15ºC. After three days, the cells were resuspended in fresh medium. Cell concentration and viability were determined using a hemocytometer and trypan blue dye exclusion.
2.6 TLR agonist stimulation
All the agonists used in this study with the exception of the flagellin protein were purchased commercially, including: poly I:C (Amersham Pharmacia Biotech), ultra-pure Salmonella minnesota LPS (List Laboratories), phenol-purified Escherichia coli O127:B8 LPS (Sigma-Aldrich, L-3129), loxoribine (Sigma-Aldrich), R848 (GL Synthesis), Pam2CSK4 (EMC microcollections) and Pam3CSK4 (EMC microcollections). Salmonella minnesota is a derivative of Salmonella choleraesuis, an intestinal pathogen of swine. Commercial availability dictated our choice of LPS preparations. Flagellar proteins were purified from two finfish pathogens, Vibrio anguillarum and Edwardsiella tarda. The V. anguillarum strain 775 was grown at 15ºC in tryptic soy broth (TSB) supplemented with 1.5% w/v sodium chloride. The Edwardsiella strain was kindly provided by D. Powell and cultured in TSB at 25ºC. Flagellar proteins were isolated and quantified as described previously (Smith et al., 2004).
Anterior kidney leukocytes were adjusted to 1×10⁷ cells/mL and 100 μL of cells were plated in triplicate into a 96-well flat bottom tissue culture plate containing 50 μL of either medium or a stimulant at varying concentrations. Each stimulant and concentration was initially screened at 15°C for 6 hours before harvest. Three of the agonists were additionally screened at 24 hours, including: Vibrio flagellin (1 μg/mL), poly I:C (5 μg/mL) and R848 (10 μg/mL). At the end of these time points, cultures were examined microscopically, centrifuged, medium removed and cells homogenized in buffer RLT (Qiagen). For each experiment, cells from four fish were cultured, stimulated and homogenized separately. Next, homogenates representing two different individual fish were pooled prior to extraction to make two pools for each experiment. Pooling of individuals was required to obtain sufficient RNA for experiments. The limited number of pools guided our choice of complete data reporting; the pools themselves summarize the mean population value (en.wikipedia.org/wiki/Law_of_large_numbers). RNA was extracted using the RNeasy RNA extraction kit with in-column DNAse treatment (Qiagen) following manufacturer’s instructions. RNA was eluted in 40 μL of RNAse-free water and stored at −80ºC until use.
2.7 Quantitative PCR of rainbow trout genes
The synthesis of cDNA and quantitative PCR were performed using previously described methods (Purcell et al. 2004). Controls lacking RNA and controls containing RNA but lacking reverse transcriptase were included in each round of cDNA synthesis. All samples from each experiment used a single reverse-transcriptase master mix to prevent variation in reverse transcriptase efficiency. The cDNA synthesis reactions were diluted to 1:10 and stored at −20ºC until use.
Rainbow trout quantitative PCR primer and probe sequences used in this study have been previously reported (Purcell et al. 2004) with the exception of IFN-α1 (AY788890; forward: CGGTGGCCTGAAGGACTTTC; reverse: ATTCAACAGGCTGACACCATGGA; probe: AGGACCAACGTGACTTTTCCAGACCCCG); MyD88 (TC84148, AJ878918; forward: TGGATGTCTGTCGCAGAAAACA; reverse CTTTGGCTCCGGGACAACG; probe: CAAGAATTACGAGGATTGCCAGGACCCAA) and IRF3 (TC91317; forward: AACAAGGCATGCAGGGTTCTAAAT; reverse: ACGTGTGCAATCAGTACCAGC; probe: ATGCTCCTTAATATTTTGCTGTGCGACCTGGATT). TIGR sequence contigs (TC) can be found at www.tigr.org. Primers and probes were designed using Primer Express v2.0. (Applied Biosystems) and purchased from Integrated DNA Technology (IDT). Quantitative PCR was performed on the ABI PRISM 7900HT using gene-specific dual-labeled probes, conjugated with 5′FAM and a 3′TAMRA. Wells contained 12 μL of 1x Universal PCR master mix (Applied Biosystems), 900 nM concentration of forward and reverse primers, 200 nM concentration of probe and 5 μL of cDNA. The cycling condition was 50ºC for 2 min, 95ºC for 10 min and 40 cycles of 95ºC for 15 sec and 61ºC for 1 min. Expression values were calculated using the relative standard curve method provided by the ABI Sequence Detection System software (v2.1.2). A standard cDNA sample containing high copy numbers of all the genes examined in this study was diluted in 10-fold increments to generate a standard curve. RNA quantity differences were assessed with reference to acidic ribosomal phosphoprotein P0 (ARP) (Pierce et al. 2004). Cells stimulated with only culture medium served as the control group for each experiment. All data are presented in units of mean fold increase relative to control. Fold increase was calculated as (Ss/Sn)/(Cs/Cn) where Ss equals the stimulated sample for the specific gene of interest (e.g. IL-8), Sn equals the stimulated sample for the normalizing gene (ARP) and Cs and Cn equals the medium control group for the specific and normalizing genes, respectively.
3. Results
3.1 Conservation of TLR-signaling molecules
We collated all known vertebrate sequences for several key proteins involved in TLR signaling. To help confirm that these sequences were highly conserved throughout vertebrate evolution, we identified each one in the draft genome of Takifugu rubripes. A percent-identity grid for MYD88 is shown in Table 1. The percent identity between tetrapod and fish MYD88 is around 60%. The percent identity grids and supporting alignments for TIRAP, TRIF, TRAF6, IRF3 and IRF7 are provided in Supplemental Table 2. The mean values for tetrapod-fish identity for each of these genes are distilled into Table 2. All of these proteins are highly conserved, but some more than others, with identity ranging from 33–60%. The interferon regulatory factors are the most divergent. For comparison, trypsin, another highly conserved gene, has an identity of around 72% (Roach et al. 1997). The ease of finding all of these orthologs in Takifugu supports the claim of high conservation; poorly conserved genes are seldom easy to find in draft genomes.
Table 1.
MYD88 percent identity from residues 9–289 of a 289 amino-acid alignment, corresponding to all except the initial eight residues of the human sequence. The initial few residues align ambiguously. Subjectively, this table shows a “high” level of conservation across a wide phylogenetic spectrum of species.
| mouse | rat | human | chimp | zebrafish | Tetraodon | X. laevis | |
|---|---|---|---|---|---|---|---|
| mouse | 100 | ||||||
| Rat | 94 | 100 | |||||
| Human | 83 | 82 | 100 | ||||
| Chimp | 83 | 82 | 99 | 100 | |||
| Zebrafish | 61 | 60 | 62 | 62 | 100 | ||
| Tetraodon | 62 | 61 | 62 | 62 | 69 | 100 | |
| X. laevis | 62 | 61 | 62 | 62 | 58 | 58 | 100 |
| X. tropicalis | 64 | 62 | 62 | 62 | 60 | 60 | 91 |
Table 2.
Percent identity between fish and tetrapod signaling proteins. The mean identity of all pairwise comparisons from our multiple alignments is shown. The percent identity for trypsin, a highly conserved compact proteolytic enzyme, is shown for reference. Identity computation excludes ambiguously aligned positions and positions for which more than half the sequences have a gap character. All of these proteins are highly conserved, evidenced by the ease of multiple alignment, but some are more conserved than others. The interferon regulatory factors are the most divergent. Pairwise percent identity for TRIF is computed only at ungapped sites. A region of “medium conservation” includes all such sites through residue 321 of the alignment (33% identical); a region of “high conservation” consists of all remaining sites (53% identical).
| Mean identity between fish and tetrapods | Length of human protein (amino-acid residues) | Length of gapped alignment | Number of alignment positions used to compute identity | |
|---|---|---|---|---|
| MYD88 | 60% | 296 | 297 | 296 |
| TIRAP | 48% | 221 | 262 | 215 |
| TRIF | 33%–53% | 546 | 667 | 480 |
| TRAF6 | 55% | 522 | 578 | 547 |
| IRF3 | 38% | 427 | 466 | 415 |
| IRF7 | 39% | 503 | 533 | 454 |
| PRSS1 (Trypsin) | 72% | 225 | 230 | 230 |
The choice of the range of the alignment to use to compute percent identity is subjective and affects the computed identity. Ideally, computation of identity should be restricted to unambiguously aligned residues. TRIF has regions of high, medium, and poor conservation. Alignment in the highly conserved region is sure, and in the poorly conserved region is impossible. Therefore we present two conservation statistics for TRIF: one derived from the region of high conservation alone, and the other derived from regions of both high and medium conservation.
3.2 MYD88 molecular tree
To further illustrate the conservation of TLR-signaling proteins, we proceeded with a detailed molecular analysis of MYD88. We began by constructing our molecular tree from all complete vertebrate MYD88 sequences in Genbank, including our high-confidence gene model from the draft genome of Xenopus. We then proceeded to place partial sequences on our core tree. We avoided placing partial sequences initially because we wanted to establish a high-confidence core topology for the tree. We derived partial sequences from ESTs for the red-tailed sheller (Haplochromis sp.) and Atlantic salmon. These sequences, as well as our genomic prediction for Takifugu, were placed on our tree by independently adding each one so that its position minimized the sum-of-squares difference in plotted and computed molecular distances to all the high-confidence sequences (Figure 2). We do not display the salmon sequence, as it is closely related to trout; inclusion would clutter the tree. The pig (Sus scrofa) sequence is not informative enough to estimate its position on the tree, as it contains only 42 amino-acid residues that are highly conserved and thus uninformative. The opossum (Monodelphis domestica) sequence has two large gaps and is also not informative enough to estimate its position on the tree.
Figure 2.
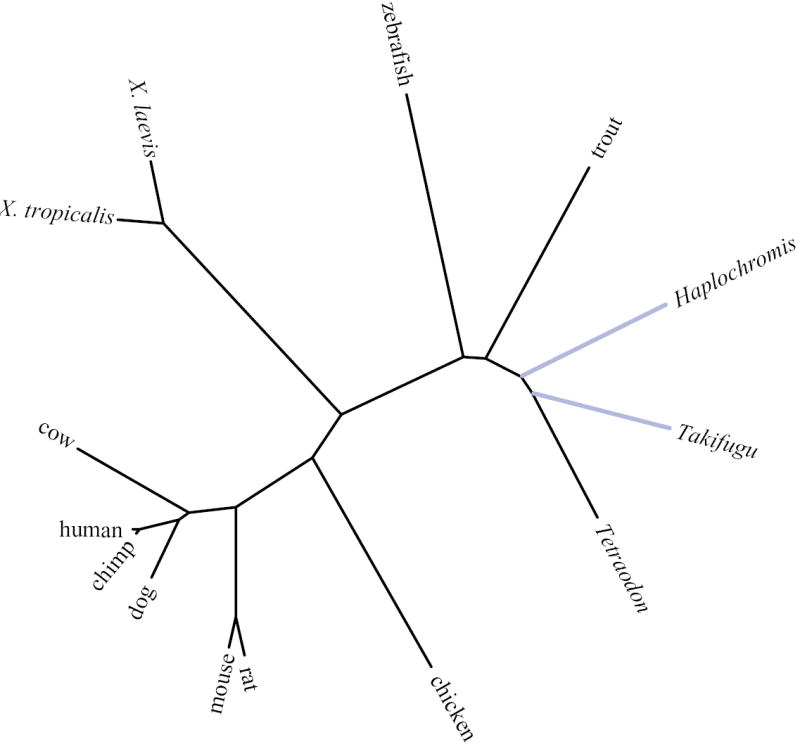
Molecular tree of MYD88. Sequences in black are full-length high-confidence gene predictions; branches in black form the core tree predicted from these sequences. Sequences in grey are partial sequences that have been placed without altering the core tree. Grey branch lengths are influenced by the length of the partial sequence.
This tree recapitulates the known phylogenetic history of vertebrates and indicates that each species possesses one copy of MYD88. Meijer et al. (2004) made this observation with a more limiting number of species. This finding would be strengthened if it is true, as it likely is, that sequenced genomes are representative of unsequenced genomes, and if second copies of MYD88 do not exist among gaps in known sequence. Similar analyses of TIRAP, TRIF, TRAF6, IRF3, and IRF7 support our conclusion: vertebrates appear to have one gene for each of these key signaling molecules. There are, however, no sequenced salmonid genomes; salmonids underwent a unique tetraploidization event not shared by other vertebrate genomes (Allendorf et al. 1984).
3.3 Early Chordate MYD88 Evolution
For the most part, we have focused our discussion on vertebrate genes. However, MYD88 certainly exists in invertebrates. Drosophila possess MYD88 (Horng et al. 2001) and BLAST analysis identifies AK113411 as a tunicate Ciona intestinalis MYD88 cDNA. The TIGR database also contains TC8784, a TIR-domain containing EST from the clam Spisula solidissima. This clam EST may represent an ortholog or a paralog to one of the TLR adapter proteins, such as MYD88, TRIF, or TIRAP. There are three hagfish MYD88 ESTs presumably all from the same gene, which we have combined to form a partial protein primary sequence prediction (Supplemental Table 1). We have not identified TLRs or MYD88 in elasmobranchs, perhaps due to the lack of extensive sequence data for cartilaginous fish.
Construction of molecular phylogenies that include both non-vertebrate and vertebrate sequences is seldom possible, and is fraught with peril (Roach et al. 1997). Great changes in selection pressure over time and between subphyla tend to invalidate most models of protein evolution that are used to compute molecular distances. Sequences diverge to an extent that reliable alignment is not possible. In cases where selection pressure is strong, molecular distances may saturate. Certainly, genes with different functions can be subject to very different selection pressures, and so it seldom makes sense to include non-orthologs in the same molecular tree. However, molecular distance between such sequences may provide hints as to relationships. We illustrate the relationships between the known TLR-adapter proteins MYD88, TIRAP, and TRIF from urochordates, cephalochordates, and vertebrates in Supplemental Figure 1. In this Figure we use multidimensional scaling to portray the relative molecular distances between genes. An oval of subjective dimensions is placed around each gene family to aid visualization. The distance between the gene families compared to the distances within the gene families is so great that portraying this information as a molecular tree could possibly be misleading. The large between-family distances are inclusively either due to extremely ancient divergence of the families or to significant selection pressure that has pulled the families apart.
We do not wish to over-interpret molecular distance data derived solely from the TIR-domain alignment. The clam TIR-adapter containing EST TC8784 is apparently a MYD88 by this MDS analysis of TIR domains. However, unlike all the other MYD88 proteins, TC8784 has a long C-terminal tail similar to the TRIFs. Therefore we feel that more information is required before this clam gene can be properly named.
3.4 Conservation of synteny
Many of the orthologous relationships of the TLR signaling pathway genes can be confirmed by observations of conserved syntenies. Figure 3 shows local genome gene synteny for the MYD88 locus. MYD88 is always followed by OSR1 and SLC22A13. MYD88 is preceded by genes that vary slightly on a theme most completely represented in the Xenopus genome: preservation of synteny adds confidence that a true orthologous relationship is being observed. Also, preservation between species of the order and orientation of orthologous genes adds confidence to selections of non-coding sequence in searches for regulatory and other conserved elements. Highly conserved genes also maintain syntenic relationships to the TRIF, TIRAP, TRAF6, IRF3, and IRF7 loci (Supplemental Table 3). The conservation of synteny in each case supports the assignment of orthology. For the case of TRAF6, synteny is maintained with respect to an ancestral vertebrate chromosome that duplicated to become the Tetraodon chromosomes 5 and 13, and then underwent selective gene loss, as described by Jaillon et al. (2004).
Figure 3.
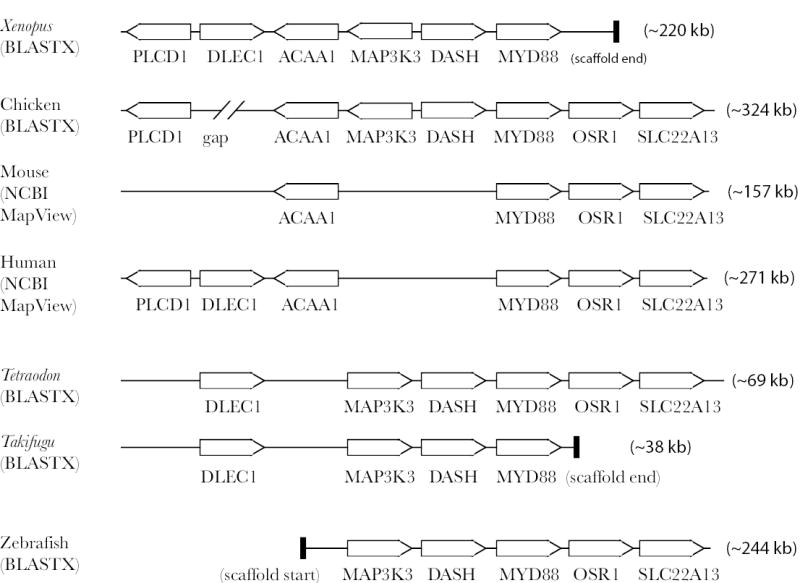
(not to scale). Order and orientation of genes syntenic to MYD88 in sequenced genomes. Since genomes are unfinished, a small possibility exits that any gene portrayed as absent is actually present. Orthologs are identified by the HUGO symbol of the human ortholog, with the exception of “DASH”, which identifies genes orthologous to the DASH cryptochrome (GeneID 402986). MYD88 is always followed by OSR1 and SLC22A13. MYD88 is preceded by genes that vary slightly on a theme most completely represented in the Xenopus genome. Genes are intentionally aligned in columns to facilitate visualization of synteny. Such alignments help guide the search for conserved regulatory elements. The methodology of identifying orthologs is indicated for each genome, as well as the approximate length in kilobases of the region portrayed. Order and orientation of genes syntenic to MYD88 in sequenced genomes. Since genomes are unfinished, a small possibility exits that any gene portrayed as absent is actually present. Orthologs are identified by the HUGO symbol of the human ortholog, with the exception of “DASH”, which identifies genes orthologous to the DASH cryptochrome (GeneID 402986). MYD88 is always followed by OSR1 and SLC22A13. MYD88 is preceded by genes that vary slightly on a theme most completely represented in the Xenopus genome. Genes are intentionally aligned in columns to facilitate visualization of synteny. Such alignments help guide the search for conserved regulatory elements. The methodology of identifying orthologs is indicated for each genome, as well as the approximate length in kilobases of the region portrayed.
The intergenic distances between MYD88 and the next upstream gene are rather short in all vertebrates for which we have analyzed sequences. The distance between DASH and MYD88 in fish, Xenopus, and chicken ranges from 890 bp to 3169 bp. The distance between ACAA1 and MYD88 in mouse and human is 1253 bp and 1537 bp respectively. It therefore seems plausible that cis-regulatory regions of the TLRs would be highly conserved. However, there remain gaps and uncertainties in the genome assemblies in these regions, particularly in the Xenopus sequence. Therefore our statistical power to detect conserved motifs is weak. Footprinter identified an 11 bp motif conserved in Takifugu, Tetraodon, and zebrafish (Table 3), for which a similar motif can be found in chicken but not human or mouse. Similarly two motifs were identified in the human, mouse, and chicken MYD88 upstream regions (Table 3). None of these motifs exactly match motifs of any known transcription-factors (Wingender et al. 2001). More high-confidence sequence from other species will be required before the significance of these motifs can be considered anything other than speculative. Since we do not detect a strong signal upstream of MYD88 it may be that some regulatory elements are embedded, for example, in the first exon. Indeed, MotifScanner detects NFκB binding motifs within the first 200 bp of the human, mouse, and Takifugu mRNAs, but it is difficult to evaluate the significance of these motifs.
Table 3.
Conserved non-coding motifs found upstream of the MYD88 gene. No motif is strongly conserved across all examined genomes. The significance of these motifs is speculative, but they may represent transcription-factor binding sites. All motifs were identified by Footprinter, with the exception of the chicken sequence in motif #2, which was found by comparison to the fish motif #2 sequences.
| Motif #1 | |
| Takifugu | TACCAAAGGAA |
| Tetraodon | CACCAAAGGAA |
| Zebrafish | CATCAAAGGAA |
| Motif #2 | |
| Takifugu | TTTGAGGAAAT |
| Tetraodon | TTTGAGGAAAT |
| Zebrafish | TTTGAACAAAT |
| Chicken | TTTGAAGAAAC |
| Motif #3 | |
| Human | TCTCGGAAAGC |
| Mouse | TCTCGGAAAGC |
| Chicken | TCTCTGAAAGC |
| Motif #4 | |
| Human | AAAGGCAGATT |
| Mouse | CAAGGCTGATT |
| Chicken | CAAGGCTGATT |
3.5 Stimulation of leukocytes with TLR agonists
Anterior kidney leukocyte preparations were stimulated with two doses of the TLR agonists for 6 hours (Table 4). Doses were selected to sample the dynamic range of action for each agonist. Stimulants that enhanced gene expression at 6 hrs were also analyzed at 24 hrs using a single dose. Only MyD88 and IRF-3 gene expression was examined at the 24 hour time point (Table 5). All cells appeared normal by microscopic examination after stimulation with the exception of cultures exposed to a high dose of loxoribine (1 mg/ml). These cells showed some clumping. Changes greater than 2-fold were considered induced and are discussed below.
Table 4.
Genes induced by TLR agonists in rainbow trout anterior kidney leukocytes after 6 hours stimulation. Data are presented as mean fold change relative to untreated control. Two pools of leukocytes representing a total of four individuals were evaluated and the observed fold change for each pool is presented in parentheses. Greater than twofold gene expression increases are highlighted in bold. For each experiment, cells from four fish were cultured and homogenized separately. Homogenates representing two different individual fish were combined prior to extraction to make two pools for each experiment.
| Cytokine Genes
|
|||||||
|---|---|---|---|---|---|---|---|
| Stimulant | Dose | IFN-α 1 | IL-1β 1 | IL8 | TNF-α 1 | TNF-α 2 | TGF-β 1 |
| Pam3CSK4 | 10 μg/mL | 0.3 (0 2;0 5) | 0.8 (0 7;1 0) | 0.6 (0 4;0 7) | 0.6 (0 5;0 8) | 0.7 (0 7;0 7) | 0.7 (0 6;0 8) |
| 100 μg/mL | 1.4 (2 2;0 6) | 1.0 (0 9;1 1) | 0.9 (0 5;1 4) | 0.8 (1 3;0 4) | 0.5 (0 5;0 5) | 0.8 (0 6;0 9) | |
| Pam2CSK4 | 10 μg/mL | 3.0 (2 4;3 5) | 2.0 (2 4;1 5) | 1.6 (1 2;2 0) | 1.2 (1 1;1 2) | 1.0 (0 7;1 2) | 0.8 (0 8;0 9) |
| 100 μg/mL | 2.8 (2 1;3 6) | 2.3 (2 0;2 7) | 1.8 (1 5;2 1) | 1.3 (1 4;1 2) | 0.8 (0 7;0 9) | 1.1 (1 1;1 1) | |
| Poly I:C | 5 μg/mL | 84.5 (92 0;76 9) | 0.8 (0 6;1 0) | 0.7 (0 9;0 5) | 1.0 (1 7;0 4) | 0.9 (0 6;1 1) | 0.5 (0 7;0 4) |
| 50 μg/mL | 366.6 (576;156) | 1.3 (1 1;1 4) | 2.1 (3 1;1 0) | 1.7 (0 8;2 6) | 1.6 (2 2;1 0) | 1.0 (1 5;0 5) | |
| LPS (Salmonella) | 10 μg/mL | 0.3 (0 5;0 2) | 1.7 (0 8;2 6) | 1.1 (0 5;1 6) | 1.7 (0 8;2 6) | 1.0 (1 3;0 7) | 1.1 (0 6;1 6) |
| 100 μg/mL | 1.1 (0 6/1 6) | 1.5 (1 0;2 1) | 1.3 (0 5;2 1) | 1.0 (0 3;1 7) | 0.7 (0 3;1 0) | 0.5 (0 3;0 8) | |
| LPS (E. coli) | 10 μg/mL | 1.2 (1 4;1 1) | 173.4 (85;261) | 37.9 (35 3;40 6) | 82.6 (49 6;115) | 28.1 (25 3;30 9) | 1.2 (0 8;1 5) |
| Flagellin (Vibrio) | 1 μg/mL | 1.3 (1 5;1 1) | 4.5 (4 8;4 2) | 4.5 (5 8;3 1) | 3.2 (1 4;4 9) | 1.3 (1 5;1 1) | 0.8 (1 0;0 7) |
| 10 μg/mL | 1.7 (1 8;1 7) | 5.7 (5 2;6 2) | 4.9 (6 2;3 7) | 4.4 (2 6;6 3) | 1.5 (1 6;1 5) | 0.8 (0 9;0 8) | |
| Flagellin (Edwardsiella) | 1 μg/mL | 0.8 (0 8;0 7) | 4.5 (5 1;3 9) | 2.5 (2 6;2 3) | 6.8 (5 7;7 8) | 3.0 (3 2;2 7) | 0.6 (0 5;0 7) |
| 10 μg/mL | 3.0 (3 4;2 6) | 9.1 (6 7;11 4) | 4.4 (4 8;4 0) | 4.0 (5 4;2 7) | 2.2 (2 8;1 6) | 0.9 (1 0;0 9) | |
| Loxoribine | 100 μg/mL | 0.5 (0 4;0 6) | 1.1 (1 3;0 9) | 1.0 (0 8;1 2) | 0.9 (0 9;1 0) | 0.9 (1 0;0 8) | 0.9 (0 8;1 0) |
| 1 mg/mL | 0.5 (0 2;0 8) | 1.1 (1 1;1 1) | 0.8 (0 8;0 9) | 0.9 (0 8;1 0) | 0.9 (0 8;1 0) | 1.0 (1 3;0 7) | |
| R848 | 1 μg/mL | 191.0 (107;274) | 23.0 (16 6;29 3) | 14.9 (24 6;5 3) | 16.6 (8 2;24 9) | 8.3 (10 0;6 6) | 1.1 (1 1;1 0) |
| 10 μg/mL | 146.5 (117;176) | 21.8 (13 7;29 8) | 15.3 (23 1;7 5) | 20.6 (33 6;7 6) | 6.4 (4 2;8 6) | 0.9 (1 0;0 7) | |
Table 5.
TLR signaling genes induced by TLR agonists in rainbow trout anterior kidney leukocytes after 6 and 24 hours stimulation. Data are presented as mean fold change relative to untreated control. Two pools of leukocytes representing a total of four individuals were evaluated and observed fold change for each pool is presented in parentheses. Greater than twofold gene expression increases are highlighted in bold.
| Gene Names
|
|||
|---|---|---|---|
| Stimulant | Hours | IRF3 | MyD88 |
| Poly I:C (5 μg/mL) | 6 hours | 11.2 (15.2;7.3) | 1.3 (1.0;1.6) |
| 24 hours | 10.8 (6.8;14.7) | 1.9 (1.6;2.2) | |
| Flagellin (Vibrio) (1 μg/mL) | 6 hours | 0.2 (0.3;0.2) | 1.6 (1.2;2.0) |
| 24 hours | 0.9 (1.0;0.8) | 0.9 (0.8;1.0) | |
| R848 (10 μg/mL) | 6 hours | 3.9 (4.6;3.2) | 1.0 (1.2;0.9) |
| 24 hours | 6.7 (7.6;5.8) | 1.1 (0.9;1.4) | |
Two doses (10 and 100 μg/ml) of the diacylated lipoprotein (Pam2CSK4) and triacylated lipopeptide (Pam3CSK4) were tested (Table 4). IFN-α 1 and IL-1β1 were moderately elevated in response to Pam2CSK4 (2.0 to 3.0-fold); similar results were obtained in an independent experiment. A slight down-regulation or no change of cytokine expression was observed after stimulation with Pam3CSK4.
Stimulation with synthetic double-stranded RNA poly I:C at two doses (5 and 50 μg/ml) induced high levels of IFN-α1 gene expression (84 to 366-fold) at 6 hours post-stimulation (Table 4). There was either no change or slight down-regulation in expression of the pro-inflammatory cytokine genes and TGF-β1. IRF3 was also up-regulated at 6 and 24 hrs (Table 5). MyD88 increased slightly at 24 hours post-treatment but this change was less than 2-fold (Table 5).
Two different forms of LPS were used in this study. First, ultra-pure LPS isolated from Salmonella minnesota R595 was used to stimulate anterior leukocytes. Several doses were tested including 1, 10 and 100 μg/ml; results from all doses were similar and those from the two highest doses are presented in Table 4. The higher doses are similar to those used in other studies that have examined stimulatory properties of E. coli LPS (Zou et al. 2002; MacKenzie et al. 2003; Goetz et al. 2004). In vivo experiments have suggested that fish are less sensitive to LPS toxicity than other species (Berczi et al. 1966). None of the genes examined were induced in expression greater than 2-fold (Table 4). Next we tested phenol-purified E. coli LPS and at only 10 μg/ml we observed dramatic up-regulation of the pro-inflammatory cytokine genes (28 to 173-fold) but not IFN-α1 or TGF-β1. Similar results were achieved in an independent experiment. However, the significance of this E. coli LPS response is uncertain, since phenol-purified LPS preparations are often contaminated with other bacterial cellular components that potentially bind to other TLRs and not just TLR4 (Hirschfeld et al. 2000).
Flagellar proteins were isolated from two finfish pathogens and used to stimulate rainbow trout leukocytes. Similar results were obtained with flagellin from either Vibrio or Edwardsiella at two different doses (1 and 10 μg/ml) (Table 4). At 6 hrs post stimulation, we observed up-regulation of gene expression for the pro-inflammatory cytokine genes (2.2 to 9.1-fold); TNF-α2 expression was not induced greater than 2-fold following stimulation with flagellin isolated from Vibrio. IFN-α1 and TGF-β1 had minimal change relative to controls with the exception of IFN-α expression in cells stimulated with the highest dose of Edwardsiella flagellin. Similar results were obtained in an independent experiment. Expression of IRF3 and MyD88 was relatively unchanged after flagellin stimulation (Table 5).
R848 stimulation of trout leukocytes enhanced gene expression of both the IFN-α1 gene as well as the genes encoding the pro-inflammatory cytokines at both 1 and 10 μg/ml (6.4 to 191-fold) (Table 4). In contrast, no response was observed to the guanosine analog loxoribine. When trout leukocytes were stimulated for 6 and 24 hrs with 10 μg/mL of R848, IRF3 was up-regulated in expression at both 6 and 24 hrs while MyD88 was relatively unchanged (Table 5).
4. Discussion
Phylogenetic analysis led us to propose that fish should be capable of responding to many of the known mammalian TLR agonists and that the fish response would induce differential cytokine production, as seen in mammals. We discuss ramifications of this hypothesis with reference to a simple cartoon of the TLR signaling network (Figure 1), keeping in mind that the actual network is more complex (Aderem et al. 2004).
Signaling through lipopeptide (TLR1/TLR2/TLR6) and flagellin receptors (TLR5) activates inflammatory response genes through a MYD88 and TIRAP dependent pathway. Both MYD88 and TIRAP are well conserved in vertebrate evolution (Figs. 1 and 2). Signaling through double-stranded RNA receptors (TLR3) activates interferon response genes utilizing the TRIF and IRF3 adaptor molecules for signaling; both TRIF and IRF3 genes have been identified in fish (Supplemental Figure 1 and Table 2). LPS-mediated signaling via TLR4 stimulates expression of the pro-inflammatory cytokines by a MYD88 dependent pathway but also stimulates IFN-β by utilizing the conserved TRIF and TRAM adaptor molecules to activate IRF3. Signaling through CpG (TLR9) and imidazoquinoline receptors (TLR7 and TLR8) activates both gene batteries: pro-inflammatory cytokines and interferon. Recently, it was proposed that a complex of MYD88, IRF7, and TRAF6 is responsible for the simultaneous activation of both branches (Kawai et al. 2004); all three of these molecules have been identified in fish (Table 2). We thus sought to establish these patterns of activation in fish.
Here, we demonstrate that anterior kidney leukocytes of rainbow trout are capable of responding in vitro to many of the mammalian TLR agonists. We indeed observed that different classes of ligands stimulated distinct patterns of cytokine expression. In our panel of genes, we used IFN-α1 to assay the induction of the interferon response. We used IL1-β, IL8, and TNF-α to assay induction of pro-inflammatory response. Consistent with studies in mammals (Akira 2003; Akira et al. 2003), poly I:C stimulated only the type I IFN gene (IFN-α1), flagellin stimulated only the pro-inflammatory cytokine genes, and the TLR7/8 agonist, resiquimod (R848), increased expression of both the interferon and pro-inflammatory cytokine genes. Thus three different PAMPs were capable of eliciting all three combinatorial possibilities for these two gene batteries. Additionally, we demonstrate that MyD88 and IRF3 were constitutively expressed in unstimulated leukocytes and IRF3 expression was up-regulated in response to poly I:C and R848 stimulation.
While this research was being conducted, the rainbow trout TLR5 was sequenced (Tsujita et al. 2004). The trout TLR5 was functionally characterized and shown to recognize flagellin from Vibrio anguillarum and respond with up-regulation the pro-inflammatory cytokine IL-1β2. Our results demonstrated that additional pro-inflammatory cytokines but not type I IFN are induced by flagellin. The rainbow trout TLR3 gene was recently identified (Rodriguez et al., in press). A number of studies have established that rainbow trout and Atlantic salmon respond to poly I:C with the increased expression of type I IFN or the IFN-inducible Mx gene (Trobridge et al. 1997; Purcell et al. 2004). Salmonid fish may not possess distinct IFN-α and IFN-β orthologs since the divergence of the mammalian IFN-α/β gene families arose after the evolutionary split between mammals and birds (Robertsen et al. 2003). It is not clear how many type I IFN genes salmonid fish possess. Previous researchers have established that synthetic oligodeoxynucleotides containing CpG motifs, TLR9 ligands, induce salmon and trout leukocytes to produce IL-1β and a type I interferon-like response (Jorgensen et al. 2001a; Jorgensen et al. 2001b). In our study, we examined two synthetic agonists of TLR7 and TLR8. Loxoribine is an agonist of both human and murine TLR7; resiquimod (R848) is an agonist of murine and human TLR7 and TLR8 (Hemmi et al. 2002; Heil et al. 2003). In our studies, we found no response in trout leukocytes to loxoribine stimulation. However, R848 induced both the pro-inflammatory cytokines and IFN-α1 genes in trout leukocytes. Together, our results using R848 and work by others using CpG containing oligonucleotides support the presence of the TLR7, TLR8 and TLR9 subfamilies in rainbow trout, although the trout TLR genes themselves have not been identified.
Using our culture conditions, trout leukocytes did not respond as expected to all the mammalian agonists examined. The trout responses to the synthetic diacylated (Pam2CSK4) and triacylated (Pam3CSK4) lipoproteins, agonists of TLR2/1 and 2/6 heterodimers, were mixed. Stimulation of trout leukocytes with LPS, the TLR4 agonist, also gave mixed results. Using an ultra-pure form of LPS from Salmonella, we found no convincing change in gene expression even at high concentrations; trout leukocytes did appear viable after these stimulations. However, when a crude preparation of E. coli LPS was used, we saw a dramatic increase in expression of the pro-inflammatory genes, but not IFN-α1. This is in contrast to mammals, where LPS stimulation up-regulates both the pro-inflammatory cytokines and IFN genes (Akira 2003; Akira et al. 2003). Our results with crude E. coli LPS stimulation were similar to previous studies that demonstrated up-regulation of rainbow trout pro-inflammatory cytokine genes (Zou et al. 1999b; Laing et al. 2002; MacKenzie et al. 2003; Goetz et al. 2004). However, in our study, since changes in expression profiles were seen only with the crude LPS preparation and not the highly purified LPS, it is possible that contamination with bacterial molecules contributed to the observed response, as has been reported in mammalian systems (Hirschfeld et al. 2000). LPS is also highly variable in structure and these structural changes are known to affect TLR4 recognition (Miller et al. 2005). It possible that the fish TLR4 has evolved to recognize LPS structures that are distinct from those of the terrestrial animal pathogen Salmonella minnesota, or that the cells expressing TLR4 were not present in our leukocyte preparations. In addition, serum factors, such as LPS binding protein (labeled “LBP” in Figure 1), may also be required for LPS recognition and may have been absent from our in vitro assay. A recent study in fish demonstrated that the response to LPS was not enhanced by the addition of homologous serum (Iliev et al. 2005).
In addition to these specific hypotheses for our observed variation in trout responses to LPS, there are additional hypotheses that might explain absence of or variability in response to particular ligands: (i) any given TLR protein may not be present in the set of cell types or tissues studied, (ii) the response may not have occurred within the timepoints analyzed, and (iii) dose effects may differ beyond the range used. Likewise, it is possible that observed cytokine responses in trout might be in response to a signaling pathway other than one initiated by TLRs. However, since TLRs tend to be expressed at low levels, it is not surprising that their cDNAs tend not to be found in current fish EST libraries (Zhong et al. 2005).
In this paper we have demonstrated that the components of the TLR signaling pathways were present as single copies in the vertebrate species sequenced to date. One hypothesis that may explain this observation is that there may be selection pressure to avoid excessive inflammatory states that might be associated with increased gene dosage. Gene dosage of TLR signaling molecules also appears to be important. Actinopterygii have undergone complete genome duplication since their divergence from tetrapods (Jaillon et al. 2004). In many cases, discussed by Jaillon et al., both copies of the genes from this duplication have been retained in fish with respect to tetrapods. However, for all of the Takifugu TLR-signaling genes we analyzed here, one of the duplicate copies has been lost. This could imply that it is disadvantageous to have two nearly identical signaling pathway genes in a genome.
In this paper, we also introduce a phylogenetic methodology that has broad utility. Our method allows the incorporation of molecular sequences that are incomplete or otherwise lower quality or uncertain into molecular trees composed of high quality sequences. We are aware of no other methodology that explicitly addresses such a merging. Our approach is to insulate the core algorithm from the influence of the lower confidence sequences, avoiding distortions that reflect sequence errors rather than evolutionary history. The approach is modular, allowing any tree-producing algorithm to be used as the core. Once a core tree is built, we place each additional sequence independently on the tree by an exhaustive search for the minimal sum-of-squares difference from pre-computed distances. The number of lower quality sequences in databases is growing rapidly, particularly including predictions from draft genomes and ESTs; the need for an algorithm such as ours is strong. Our algorithm is designed to be simple and convenient, and our implementation is designed to work with existing phylogeny programs such as PHYLIP. Several improvements are possible if the conceptual, algorithmic, and implementation difficulties can be overcome. For example, if a quantitative noise and error model for sequences can be developed, it may be possible to remove the need to isolate the core tree building by appropriately weighting the influence of each sequence or subseqeuence.
To summarize our results, we computationally demonstrated that the TLR-signaling genes are conserved among vertebrates. We were thus led to the hypothesis that all vertebrates should be capable not only of recognizing TLR ligands, but also responding with the induction of specific batteries of genes. We then verified this hypothesis by demonstrating that trout leukocytes responded differentially to ligands, inducing the same ligand-specific batteries of genes seen in mammals. We acknowledge that the full complexity of the TLR signaling network will not be revealed by comparative genomics and comparative biology alone. However, we hope to have illustrated the power of this approach to contribute synergistically with other techniques, including those of systems biology, to unveil the structure of this network.
Supplementary Material
Multidimensional scaling of the molecular distances between the TIR domains of the TLR-adapter proteins. An oval of subjective dimensions is placed around each gene family to aid visualization. The distance between the gene families compared to the distances within the gene families is so great that it is possible that portraying this information as a molecular tree could be misleading. The clam TIR-adapter containing EST is apparently a MYD88 by this MDS analysis of TIR domains. However, unlike all the other MYD88 proteins, it has a long C-terminal tail similar to the TRIFs; more information is required for definitive assignment.
Descriptions of and references for all sequences used in this study. [provided as a separate tab-delimited text file suitable for viewing in a spreadsheet program]
(i) alignments used in this study, (ii) a tree used to confirm assignment of Takifugu IRF3 and IRF7, and (iii) percent identity grids. [provided as a separate text file]
Positions of highly conserved genes near the TRIF, TIRAP, TRAF6, IRF3, and IRF7 loci. The conservation of synteny in each case supports the assignment of orthology. For the case of TRAF6, synteny is maintained with respect to an ancestral vertebrate chromosome that duplicated to become the Tetraodon chromosomes 3 and 5, and then underwent selective gene loss, as described by Jaillon et al. (2004).
Acknowledgments
Sydney Brenner inspired and led the Fugu Finishing Consortium. JCR is supported by a grant from NIAID (5K08AI056092). Bin Li helped craft Figure 1. Alistair Rust facilitated the use of MotifScanner. Scott LaPatra from Clear Spring Foods Inc. donated the rainbow trout used in this study and Ron Pascho and Stewart Alcorn contributed to experimental design.
Footnotes
Author Contributions
Paper Drafting: Maureen Purcell, Jared Roach
Trout Leukocyte Experiments and Analysis: Maureen Purcell
Sequence Bioinformatics and Comparative Genomics: Jared Roach
Experimental Design: Maureen Purcell, Jared Roach, Kelly Smith
Funding, Manuscript Editing, and Data Interpretation: Leroy Hood, James Winton
References
- Aderem A, Smith KD. A systems approach to dissecting immunity and inflammation. Sem Immunol. 2004;16:55–67. doi: 10.1016/j.smim.2003.10.002. [DOI] [PubMed] [Google Scholar]
- Akira S. Toll-like receptor signaling. J Biol Chem. 2003;278:38105–38108. doi: 10.1074/jbc.R300028200. [DOI] [PubMed] [Google Scholar]
- Akira S, Yamamoto M, Takeda K. Role of adapters in Toll-like receptor signalling. Biochem Soc Trans. 2003;31:637–642. doi: 10.1042/bst0310637. [DOI] [PubMed] [Google Scholar]
- Allendorf, F.W., Thorgaard, G. 1984. Tetraploidy and the evolution of salmonid fishes. In: Turner, B.J. (Ed.) The Evolutionary Genetics of Fishes, Plenum Press, New York, pp. 1–53
- Aparicio S, Chapman J, Stupka E, Putnam N, Chia J, Dehal P, Christoffels A, Rash S, Hoon S, Smit A, Gelpke MDS, Roach J, Oh T, Ho IY, Wong M, Detter C, Verhoef F, Predki P, Tay A, Lucas S, Richardson P, Smith SF, Clark MS, Edwards YJK, Doggett N, Zharkikh A, Tavtigian SV, Pruss D, Barnstead M, Evans C, Baden H, Powell J, Glusman G, Rowen L, Hood L, Tan YH, Elgar G, Hawkins T, Venkatesh B, Rokhsar D, Brenner S. Whole-genome shotgun assembly and analysis of the genome of Fugu rubripes. Science. 2002;297:1301–1310. doi: 10.1126/science.1072104. [DOI] [PubMed] [Google Scholar]
- Berczi I, Bertok L, Bereznai T. Comparative studies on the toxicity of Escherichia coli lipopolysaccharide endotoxin in various animal species. Can J Microbiol. 1966;12:1070–1071. doi: 10.1139/m66-143. [DOI] [PubMed] [Google Scholar]
- Beutler B. Inferences, questions and possibilities in Toll-like receptor signalling. Nature. 2004;430:257. doi: 10.1038/nature02761. [DOI] [PubMed] [Google Scholar]
- Blanchette M, Schwikowski B, Tompa M. Algorithms for phylogenetic footprinting. J Computat Biol. 2002;9:211–223. doi: 10.1089/10665270252935421. [DOI] [PubMed] [Google Scholar]
- Braun-Nesje R, Kaplan G, Seljelid R. Rainbow trout macrophages in vitro: morphology and phagocytic activity. Dev Comp Immunol. 1982;6:281–291. doi: 10.1016/s0145-305x(82)80011-6. [DOI] [PubMed] [Google Scholar]
- Englen MD, Valdez YE, Lehnert NM, Lehnert BE. Granulocyte/macrophage colony-stimulating factor is expressed and secreted in cultures of murine L929 cells. J Immunol Meths. 1995;184:281–283. doi: 10.1016/0022-1759(95)00136-x. [DOI] [PubMed] [Google Scholar]
- Felsenstein, J. 2004. PHYLIP (Phylogeny Inference Package). In: Department of Genome Sciences, University of Washington, Seattle,
- Goetz FW, Iliev DB, McCauley LA, Liarte CQ, Tort LB, Planas JV, Mackenzie S. Analysis of genes isolated from lipopolysaccharide-stimulated rainbow trout (Oncorhynchus mykiss) macrophages. Mol Immunol. 2004;41:1199–1210. doi: 10.1016/j.molimm.2004.06.005. [DOI] [PubMed] [Google Scholar]
- Hardie LJ, Laing KJ, Daniels GD, Grabowski PS, Cunningham C, Secombes CJ. Isolation of the first piscine transforming growth factor beta gene: analysis reveals tissue specific expression and a potential regulatory sequence in rainbow trout (Oncorhynchus mykiss) Cytokine. 1998;10:555–563. doi: 10.1006/cyto.1997.0334. [DOI] [PubMed] [Google Scholar]
- Heil F, Ahmad-Nejad P, Hemmi H, Hochrein H, Ampenberger F, Gellert T, Dietrich H, Lipford G, Takeda K, Akira S, Wagner H, Bauer S. The toll-like receptor 7 (TLR7)-specific stimulus loxoribine uncovers a strong relationship within the TLR7, 8 and 9 subfamily. Eur J Immunol. 2003;33:2987–2997. doi: 10.1002/eji.200324238. [DOI] [PubMed] [Google Scholar]
- Hemmi H, Kaisho T, Takeuchi O, Sato S, Sanjo H, Hoshino K, Horiuchi T, Tomizawa H, Takeda K, Akira S. Small anti-viral compounds activate immune cells via the TLR7 MyD88-dependent signaling pathway. Nat Immunol. 2002;3:196–200. doi: 10.1038/ni758. [DOI] [PubMed] [Google Scholar]
- Hirschfeld M, Ma Y, Weis JH, Vogel SN, Weis JJ. Cutting edge: Repurification of lipopolysaccharide eliminates signaling through both human and murine toll-like receptor 2. J Immunol. 2000;165:618–622. doi: 10.4049/jimmunol.165.2.618. [DOI] [PubMed] [Google Scholar]
- Horng T, Medzhitov R. Drosophila MyD88 is an adapter in the Toll signaling pathway. Proc Natl Acad Sci USA. 2001;98:12654–12658. doi: 10.1073/pnas.231471798. [DOI] [PMC free article] [PubMed] [Google Scholar]
- Iliev DB, Liarte CQ, MacKenzie S, Goetz FW. Activation of rainbow trout (Oncorhynchus mykiss) mononuclear phagocytes by different pathogen associated molecular pattern (PAMP) bearing agents. Mol Immunol. 2005;42:1215. doi: 10.1016/j.molimm.2004.11.023. [DOI] [PubMed] [Google Scholar]
- Iwasaki A, Medzhitov R. Toll-like receptor control of the adaptive immune responses. Nat Immunol. 2004;5:987–995. doi: 10.1038/ni1112. [DOI] [PubMed] [Google Scholar]
- Jaillon O, Aury JM, Brunet F, Petit JL, Stange-Thomann N, Mauceli E, Bouneau L, Fischer C, Ozouf-Costaz C, Bernot A, Nicaud S, Jaffe D, Fisher S, Lutfalla G, Dossat C, Segurens B, Dasilva C, Salanoubat M, Levy M, Boudet N, Castellano S, Anthouard R, Jubin C, Castelli V, Katinka M, Vacherie B, Biemont C, Skalli Z, Cattolico L, Poulain J, de Berardinis V, Cruaud C, Duprat S, Brottier P, Coutanceau JP, Gouzy J, Parra G, Lardier G, Chapple C, McKernan KJ, McEwan P, Bosak S, Kellis M, Volff JN, Guigo R, Zody MC, Mesirov J, Lindblad-Toh K, Birren B, Nusbaum C, Kahn D, Robinson-Rechavi M, Laudet V, Schachter V, Quetier F, Saurin W, Scarpelli C, Wincker P, Lander ES, Weissenbach J, Crollius HR. Genome duplication in the teleost fish Tetraodon nigroviridis reveals the early vertebrate proto-karyotype. Nature. 2004;431:946–957. doi: 10.1038/nature03025. [DOI] [PubMed] [Google Scholar]
- Jault C, Pichon L, Chluba J. Toll-like receptor gene family and TIR-domain adapters in Danio rerio. Mol Immunol. 2004;40:759–771. doi: 10.1016/j.molimm.2003.10.001. [DOI] [PubMed] [Google Scholar]
- Jorgensen JB, Johansen A, Stenersen B, Sommer AI. CpG oligodeoxynucleotides and plasmid DNA stimulate Atlantic salmon (Salmo salar L.) leucocytes to produce supernatants with antiviral activity. Dev Comp Immunol. 2001a;25:313–321. doi: 10.1016/s0145-305x(00)00068-9. [DOI] [PubMed] [Google Scholar]
- Jorgensen JB, Zou J, Johansen A, Secombes CJ. Immunostimulatory CpG oligodeoxynucleotides stimulate expression of IL-1beta and interferon-like cytokines in rainbow trout macrophages via a chloroquine-sensitive mechanism. Fish Shellf Immunol. 2001b;11:673–682. doi: 10.1006/fsim.2001.0344. [DOI] [PubMed] [Google Scholar]
- Kawai T, Sato S, Ishii KJ, Coban C, Hemmi H, Yamamoto M, Terai K, Matsuda M, Inoue J, Uematsu S, Takeuchi O, Akira S. Interferon-alpha induction through Toll-like receptors involves direct interaction of IRF7 with MyD88 and TRAF6. Nat Immunol. 2004;5:1061–1068. doi: 10.1038/ni1118. [DOI] [PubMed] [Google Scholar]
- Laing KJ, Wang T, Zou J, Holland J, Hong S, Bols N, Hirono I, Aoki T, Secombes CJ. Cloning and expression analysis of rainbow trout Oncorhynchus mykiss tumour necrosis factor alpha. Eur J Biochem. 2001;268:1315–1322. doi: 10.1046/j.1432-1327.2001.01996.x. [DOI] [PubMed] [Google Scholar]
- Laing KJ, Zou JJ, Wang T, Bols N, Hirono I, Aoki T, Secombes CJ. Identification and analysis of an interleukin 8-like molecule in rainbow trout Oncorhynchus mykiss. Dev Comp Immunol. 2002;26:433–444. doi: 10.1016/s0145-305x(01)00092-1. [DOI] [PubMed] [Google Scholar]
- Lynn DJ, Lloyd AT, O’Farrelly C. In silico identification of components of the Toll-like receptor (TLR) signaling pathway in clustered chicken expressed sequence tags (ESTs) Vet Immunol Immunopathol. 2003;93:177–184. doi: 10.1016/s0165-2427(03)00058-8. [DOI] [PubMed] [Google Scholar]
- MacKenzie S, Planas JV, Goetz FW. LPS-stimulated expression of tumor necrosis factor-alpha mRNA in primary trout monocytes and in vitro differentiated macrophages. Dev Comp Immunol. 2003;27:393–400. doi: 10.1016/s0145-305x(02)00135-0. [DOI] [PubMed] [Google Scholar]
- Medzhitov R, Janeway CA. Innate immune recognition: mechanisms and pathways. Immunol Revs. 2000;173:89–97. doi: 10.1034/j.1600-065x.2000.917309.x. [DOI] [PubMed] [Google Scholar]
- Meijer AH, Krens SFG, Rodriguez IAM, He SN, Bitter W, Snaar-Jagalska BE, Spaink HP. Expression analysis of the Toll-like receptor and TIR domain adaptor families of zebrafish. Mol Immunol. 2004;40:773–783. doi: 10.1016/j.molimm.2003.10.003. [DOI] [PubMed] [Google Scholar]
- Miller SI, Ernst RK, Bader MW. LPS, TLR4 and Infectious Disease Diversity. Nat Revs Microbiol. 2005;3:36–46. doi: 10.1038/nrmicro1068. [DOI] [PubMed] [Google Scholar]
- Pierce AL, Dickey JT, Larsen DL, Fukada H, Swanson P, Dickhoff WW. A quantitative real-time RT-PCR assay for salmon IGF-I mRNA and its application in the study of GH regulation of IGF-I gene expression in primary culture of salmon hepatocytes. Gen Comp Endocrinol. 2004;135:401–411. doi: 10.1016/j.ygcen.2003.10.010. [DOI] [PubMed] [Google Scholar]
- Prothmann C, Armstrong NJ, Rupp RAW. The Toll/IL-1 receptor binding protein MyD88 is required for Xenopus axis formation. Mech Dev. 2000;97:85–92. doi: 10.1016/s0925-4773(00)00447-0. [DOI] [PubMed] [Google Scholar]
- Purcell MK, Kurath G, Garver KA, Herwig RP, Winton JR. Quantitative expression profiling of immune response genes in rainbow trout following infectious haematopoietic necrosis virus (IHNV) infection of DNA vaccination. Fish Shellf Immunol. 2004;17:447–462. doi: 10.1016/j.fsi.2004.04.017. [DOI] [PubMed] [Google Scholar]
- Rambaut, A. 1996. Se-Al: Sequence Alignment Editor. In: http://evolve.zoo.ox.ac.uk/,
- Roach JC, Boysen C, Wang K, Hood L. Pairwise end sequencing - A unified approach to genomic mapping and sequencing. Genomics. 1995;26:345–353. doi: 10.1016/0888-7543(95)80219-c. [DOI] [PubMed] [Google Scholar]
- Roach JC, Glusman G, Rowen L, Kaur A, Purcell MK, Smith KD, Hood L, Aderem A. The evolution of vertebrate toll-like receptors. Proc Natl Acad Sci USA. 2005;102:9577–82. doi: 10.1073/pnas.0502272102. [DOI] [PMC free article] [PubMed] [Google Scholar]
- Roach JC, Wang K, Gan L, Hood L. The molecular evolution of the vertebrate trypsinogens. J Mol Evol. 1997;45:640–652. doi: 10.1007/pl00006268. [DOI] [PubMed] [Google Scholar]
- Robertsen B, Bergan V, Rokenes T, Larsen R, Albuquerque A. Atlantic salmon interferon genes: cloning, sequence analysis, expression, and biological activity. J Interferon Cytokine Res. 2003;10:601–612. doi: 10.1089/107999003322485107. [DOI] [PubMed] [Google Scholar]
- Rodriguez, M.F., Wiens, G., Purcell, M.K., Palti, Y. Characterization of Toll-like receptor 3 gene in rainbow trout (Oncorhynchus mykiss). Immunogenetics. (in press) [DOI] [PubMed]
- Smith KD, Andersen-Nissen E, Hayashi F, Strobe K, Bergman MA, Barrett SLR, Cookson BT, Aderem A. Toll-like receptor 5 recognizes a conserved site on flagellin required for protofilament formation and bacterial motility. Nat Immunol. 2004;5:1247–1253. doi: 10.1038/ni1011. [DOI] [PubMed] [Google Scholar]
- Thijs G, Marchal K, Lescot M, Rombauts S, De Moor B, Rouze P, Moreau Y. A Gibbs sampling method to detect overrepresented motifs in the upstream regions of coexpressed genes. J Comput Biol. 2002;9:447–464. doi: 10.1089/10665270252935566. [DOI] [PubMed] [Google Scholar]
- Thompson JD, Gibson TJ, Plewniak F, Jeanmougin F, Higgins DG. The CLUSTAL_X windows interface: flexible strategies for multiple sequence alignment aided by quality analysis tools. Nucleic Acids Res. 1997;25:4876–4882. doi: 10.1093/nar/25.24.4876. [DOI] [PMC free article] [PubMed] [Google Scholar]
- Trobridge GD, Chiou PP, Kim CH, Leong JC. Induction of the Mx protein of rainbow trout Oncorhynchus mykiss in vitro and in vivo with poly I:C dsRNA and infectious hematopoietic necrosis virus. Dis Aquat Org. 1997;30:91–98. [Google Scholar]
- Tsujita T, Tsukada H, Nakao M, Oshiumi H, Matsumoto M, Seya T. Sensing bacterial flagellin by membrane and soluble orthologs of toll-like receptor 5 in rainbow trout (Oncorhynchus mykiss) J Biol Chem. 2004;279:48588–48597. doi: 10.1074/jbc.M407634200. [DOI] [PubMed] [Google Scholar]
- Wingender E, Chen X, Fricke E, Geffers R, Hehl R, Liebich I, Krull M, Matys V, Michael H, Ohnhauser R, Pruss M, Schacherer F, Thiele S, Urbach S. The TRANSFAC system on gene expression regulation. Nucleic Acids Res. 2001;29:281–283. doi: 10.1093/nar/29.1.281. [DOI] [PMC free article] [PubMed] [Google Scholar]
- Xu YW, Tao X, Shen BH, Horng T, Medzhitov R, Manley JL, Tong L. Structural basis for signal transduction by the Toll/interleukin-1 receptor domains. Nature. 2000;408:111–115. doi: 10.1038/35040600. [DOI] [PubMed] [Google Scholar]
- Zhang YB, Hu CY, Zhang J, Huang GP, Wei LH, Zhang QY, Gui JF. Molecular cloning and characterization of crucian carp (Carassius auratus L.) interferon regulatory factor 7. Fish & Shellf Immunol. 2003;15:453–466. doi: 10.1016/s1050-4648(03)00025-1. [DOI] [PubMed] [Google Scholar]
- Zhong F, Cao W, Chan E, Tay PN, Cahya FF, Zhang H, Lu J. Deviation from major codons in the Toll-like receptor genes is associated with low Toll-like receptor expression. Immunology. 2005;114:83–93. doi: 10.1111/j.1365-2567.2004.02007.x. [DOI] [PMC free article] [PubMed] [Google Scholar]
- Zou J, Cunningham C, Secombes CJ. The rainbow trout Oncorhynchus mykiss interleukin-1 beta gene has a differ organization to mammals and undergoes incomplete splicing. Eur J Biochem. 1999a;259:901–908. doi: 10.1046/j.1432-1327.1999.00121.x. [DOI] [PubMed] [Google Scholar]
- Zou J, Grabowski PS, Cunningham C, Secombes CJ. Molecular cloning of interleukin 1beta from rainbow trout Oncorhynchus mykiss reveals no evidence of an ice cut site. Cytokine. 1999b;11:552–560. doi: 10.1006/cyto.1998.0470. [DOI] [PubMed] [Google Scholar]
- Zou J, Wang T, Hirono I, Aoki T, Inagawa H, Honda T, Soma GI, Ototake M, Nakanishi T, Ellis AE, Secombes CJ. Differential expression of two tumor necrosis factor genes in rainbow trout, Oncorhynchus mykiss. Dev Comp Immunol. 2002;26:161–172. doi: 10.1016/s0145-305x(01)00058-1. [DOI] [PubMed] [Google Scholar]
Associated Data
This section collects any data citations, data availability statements, or supplementary materials included in this article.
Supplementary Materials
Multidimensional scaling of the molecular distances between the TIR domains of the TLR-adapter proteins. An oval of subjective dimensions is placed around each gene family to aid visualization. The distance between the gene families compared to the distances within the gene families is so great that it is possible that portraying this information as a molecular tree could be misleading. The clam TIR-adapter containing EST is apparently a MYD88 by this MDS analysis of TIR domains. However, unlike all the other MYD88 proteins, it has a long C-terminal tail similar to the TRIFs; more information is required for definitive assignment.
Descriptions of and references for all sequences used in this study. [provided as a separate tab-delimited text file suitable for viewing in a spreadsheet program]
(i) alignments used in this study, (ii) a tree used to confirm assignment of Takifugu IRF3 and IRF7, and (iii) percent identity grids. [provided as a separate text file]
Positions of highly conserved genes near the TRIF, TIRAP, TRAF6, IRF3, and IRF7 loci. The conservation of synteny in each case supports the assignment of orthology. For the case of TRAF6, synteny is maintained with respect to an ancestral vertebrate chromosome that duplicated to become the Tetraodon chromosomes 3 and 5, and then underwent selective gene loss, as described by Jaillon et al. (2004).