

Abstract
We developed a microarray platform for PCR amplification-independent expression profiling of minute samples. A novel scanning system combined with specialized biochips enables detection down to individual fluorescent oligonucleotide molecules specifically hybridized to their complementary sequence over the entire biochip surface of cm2 size. A detection limit of 1.3 fM target oligonucleotide concentration—corresponding to only 39,000 molecules in the sample solution—and a dynamic range of 4.7 orders of magnitude have been achieved. The applicability of the system to PCR amplification-independent gene-expression profiling of minute samples was demonstrated by complex hybridization of cDNA derived from the equivalent of only 104 cells, which matches results obtained in ensemble studies on large samples. By counting each hybridized molecule on the microarray, the method is insusceptible to gene-specific variations of the labeling, thereby representing a principle advance to conventional ensemble-based microarray analysis.
Microarray analysis of the global transcriptional state of a small cell number represents a major target for both medical diagnostics and basic research. In particular, precise characterization of minute patient’s samples such as malignant and multidrug-resistant cancer stem cells is decisive for a detailed molecular understanding of the oncogenic mechanisms driving tumor growth as well as for diagnosis and individualized therapy; furthermore, global molecular characterization of small subregions within heterogeneous tissues or of tiny biological units such as stem-cell niches is of fundamental importance for a more defined understanding of key biological processes such as tissue homeostasis in normal and diseased states.
Recent technological advances allow for routine isolation of small, yet defined subpopulations of cells such as cancer stem cells from heterogeneous fluid or tissue samples using Fluorescence Activated Cell Sorting (FACS) and Laser Capture Microdissection (LCM). Subsequent purification and biochemical processing can be performed with minimum loss of material via microfluidic devices (Paegel et al. 2003; Hong et al. 2004). Still, there is an urgent need for a robust technology to determine the global expression profiles of such minute samples. Current protocols include an amplification step for RNA/DNA, with linear amplification being the preferred method over PCR-based approaches. While linear amplification is less prone to distortions of the relative abundance of mRNA species in the original sample, the method is time consuming and requires sophisticated protocols that are difficult to establish (Van Gelder et al. 1990; Kacharmina et al. 1999; Mahadevappa and Warrington 1999; Wang et al. 2000; Baugh et al. 2001; Hu et al. 2002; Taylor et al. 2004). These problems could be avoided by direct hybridization of unamplified labeled DNA and readout with a highly sensitive detection system.
In conventional DNA microarray readout, the sensitivity is limited by standard formats of biochip substrates. Their thickness of ∼1 mm requires the implementation of imaging optics with a long working distance, at the expense of detection efficiency. Moreover, impurities within the substrate material typically generate a strong fluorescence background, which impedes ultrasensitive fluorescence detection on such biochips.
Setting up a robust scanning technology for cm2 areas with single-molecule sensitivity is a challenging task. To reliably identify single dye molecules, imaging at the resolution limit is inevitable; the concomitant short depth of focus of ∼400 nm demands precise adjustment of the focal plane. A high-precision scanning stage operating at the resolution limit, a robust focus-hold system, and a thin biochip with a surface of high purity over large areas must therefore be regarded as major requirements for DNA microarray analysis at the single molecule level.
We report here the development of a system for PCR amplification-independent DNA microarray analysis down to the single-molecule level, which includes an ultrasensitive detection device and accessory biochips. Hybridization of fluorescent oligonucleotides was used to characterize the platform in terms of sensitivity and dynamic range. Complex hybridization of biological material corresponding to only 104 cells demonstrates the applicability of the system for biomedical diagnostics.
Results and Discussion
Biochip surfaces of arbitrary size were imaged at the sensitivity of single-dye molecules using a home-built scanning system (Hesse et al. 2004; Sonnleitner et al. 2005). All images were recorded with a pixel size of 200 nm, which yields best performance for single-molecule identification at the given optical resolution limit of 450 nm (full width at half maximum of the point spread function); 40 min scanning time was required to record an area of 1 cm2 on the chip surface. To enable imaging at high-detection efficiency, DNA microarrays were established on the basis of 150-μm thick aldehyde-functionalized glass coverslips, which were selected for low autofluorescence (Schlapak et al. 2005).
We first tested the binding specificity by hybridizing a Cy5-labeled 60mer target oligonucleotide (c = 100 fM) to its complementary sequence (probe oligonucleotide) bound to the biochip surface (Fig. 1). Homogenously distributed diffraction-limited peaks were observed over the entire image; the corresponding surface density was 1000-fold higher when compared with a surface functionalized with control oligonucleotide. To ascertain whether each fluorescence peak corresponds to a single Cy5-oligonucleotide molecule, we determined the brightness of individual peaks as a measure of the number of colocalized dye molecules; fitting with a two-dimensional Gaussian profile (Schmidt et al. 1996) yielded a mean value of B = 2600 counts, which is in good agreement with the single-molecule brightness of Cy5 determined in a supported lipid bilayer doped with low amounts of Cy5-labeled lipids (2400 counts). The high single-molecule brightness and the low background noise within a diffraction limited region (σ = 34 counts) obtained on the biochip surface allow for reliable (signal-to-background noise ratio >10) detection of more than 99% of all fluorescent oligonucleotide molecules.
Figure 1.

Single-fluorescent oligonucleotide molecules hybridized to functionalized biochips. (A) Surface functionalized with probe oligonucleotide upon hybridization with 100 fM of Cy5-labeled target oligonucleotide. Individual diffraction-limited peaks, corresponding to single oligonucleotide molecules, can be resolved at a surface density of 0.8 μm−2. (B) Surface functionalized with control sequence yielded a 1000-fold lower signal compared with specific hybridization. We ensured that the control can bind to a complementary strand by hybridizing with 60-pM complementary fluorescent (Cy5-labeled) Xenopus XAG2-cDNA (Supplemental Fig. S1). (C) The high single-molecule brightness of 2600 counts and the low background noise of 34 counts allow reliable detection of more than 99% of all surface-bound dye molecules.
To determine the detection limit and the dynamic range of the platform, we varied the target concentration c from 100 aM to 1 nM. Hybridization experiments were performed on microarrays with a regular checkerboard pattern of probe and control oligonucleotides using a spot size of 100 × 100 μm2. Figure 2A shows a microarray hybridized with 100 fM Cy5-labeled target oligonucleotide. Binding efficiency was homogenous over the chip surface, characterized by a spot-to-spot signal variation of only 13%. Single oligonucleotide molecules bound to the chip surface become visible when the data are plotted at higher magnification (Fig. 2B). At low surface densities of N ≤ 1000 molecules per spot, more than 95% of all molecules are well separated in the image and were counted via automated algorithms. At higher surface densities, peaks begin to overlap; in such cases, the number of hybridized molecules per spot was inferred from the corresponding integrated fluorescence signal and the single molecule brightness B. Residual signals due to unspecific adsorption (Nunspec) on control spots were subtracted for calculating the specific signal Nspec. A constant concentration of Cy3-labeled target oligonucleotide (c = 10 fM) was included in all experiments; the fluorescence signal SCy3 is a measure of the binding capacity of each spot and was used to correct for chip-to-chip variations with (SCy3(c)/〈SCy3〉all conc.) as linear normalization. Figure 2C shows the binding curve for specific hybridization (red) and unspecific adsorption (black). A linear relation between specifically hybridized oligonucleotides and sample concentration was found over six orders of magnitude. At all applied concentrations, the average distance between two neighboring molecules is >30 nm; therefore, fluorescence quenching has no significant effect on the molecular brightness.
Figure 2.

Validation of the system. (A) 60mer probe (red squares) and target (yellow squares) oligonucleotides were spotted. Specific signals after hybridization with 100 fM Cy5-labeled target oligonucleotide show a spot-to-spot variation of only 13%. For illustration, data were software-binned (10 × 10). (B) Fluorescence images of spots hybridized with different concentrations of Cy5-labeled target-oligonucleotide. Individual Cy5-labeled oligonucleotide molecules can be detected in the range of from 100 aM to10 fM; at higher concentrations, single molecule signals begin to overlap. (Insets) Details within the spots at 3.5-fold higher magnification. In the second row, the corresponding images of control spots are shown. A constant concentration of Cy3-labeled target-oligonucleotide was included in all experiments (third row). (see Supplemental Fig. S2 for images of higher target concentrations). (C) Number of specifically hybridized (red) and unspecifically adsorbed (black) oligonucleotide molecules per spot vs. sample concentration. Three independent experiments, each containing 16 replicate spots, were performed for each concentration. The surface density increases linearly with c over six orders of magnitude (surface-density ∝ c0.86). Assuming a minimum signal-to-noise ratio of 10 as criterion for reliable analysis (dashed line), a detection-limit of c = 1.3 fM can be specified. Error bars indicate the standard deviations of the signals. Note that due to the logarithmic scaling, the error bars are only visible at low concentrations (see also Supplemental Table S1).
A constant unspecific signal of Nunspec = 13.2 molecules per spot was observed for c < 1 pM, due to residual surface and buffer impurities. At sample concentrations c ≥ 1 pM unspecific oligonucleotide binding resulted in a linear increase of the unspecific signal, approximately four orders of magnitude below the specific signal.
For the definition of the detection limit, two major noise contributions have to be considered; first, the signal noise, which includes variations in the brightness of the fluorophore and of the background; and second, variations due to the stochastic nature of the binding process. While for conventional microarray analysis the first term is dominant and limits the accuracy of signal quantification, its influence on single-molecule counting is negligible due to the high-detection reliability. Here, the ultimate statistical limit of the binding process defines the sensitivity of the system. Assuming Poissonian-binding statistics, the signal-to-noise ratio (SNR) is described by SNR = Nspec/√N. We find that Nspec = 112 molecules specifically hybridized to one spot are sufficient for data analysis with a SNR of 10. For the given experimental conditions, this number corresponds to a sample concentration of 1.3 fM (∼39,000 target molecules in the sample volume of 50 μL), defining the limit of detection of the system.
The high instrumental dynamic range of the developed system enables signal quantification in a range of from 1.3 fM to 1 nM. The operational dynamic range, however, is currently limited by unspecific adsorption of fluorescent oligonucleotides to the target control spots. At c = 67 pM, the unspecific signal equals the specific signal recorded at the detection limit of c = 1.3 fM, yielding an operational dynamic range of 4.7 orders of magnitude.
To demonstrate the applicability of the system to gene-expression profiling, we used arrays of 125 distinct 67–70mer oligonucleotides spotted in eight replicates (1000 probe features per array). Complex cDNA was synthesized from 200 ng of total RNA from the equivalent of only 104 cells of a human keratinocyte cell line (HaCaT) and used for hybridization (Fig. 3A). Samples were scanned at a speed of 2.4 sec/spot; in total, the analysis took ∼6 sec/spot. Spots indicated by arrows (1, 2, and 3) are shown below at high magnification. Well-separated peaks were detected, e.g., for BCL2 (1) and S100A8 (3), and counted for determination of N, yielding 450 ± 100 and 890 ± 31-bound molecules per spot, respectively. Interestingly, the two cDNA species show differences in the single-molecule brightness. This result points out a potential bias in conventional microarray analysis; variations in the brightness of the target molecules affect the spot signal in ensemble measurements, hampering a precise determination of relative mRNA abundances. In this example, ensemble analysis would even yield a reversed expression ratio of the two genes.
Figure 3.

Hybridization of cDNA synthesized from 200 ng total RNA. (A) The microarray was scanned with a pixel size of 200 nm and plotted after software-binning (25 × 25). Details 1–3 show hybridized cDNA molecules at full 200-nm resolution. Binding of low-abundant cDNAs, e.g., BCL2 (1) and S100A8 (3), was quantified by molecule counting, high-abundant, e.g., VAV1 (2), by conventional ensemble analysis. (B) Due to differences in the labeling, the brightness of individual cDNA molecules was found to vary significantly. The histogram shows the brightness of individual cDNA molecules detected on the microarray shown in A for BCL2 (red) and S100A8 (blue). To determine the degree of labeling we measured the brightness of single fluorophores by repeatedly scanning the same area on the chip surface. Due to the multiple labeling of the cDNA, photobleaching occurred in multiple steps. From the magnitude of the last step, the single fluorophore brightness was calculated. For BCL2 and S100A8, a respective average labeling degree of 4.6 and 1.6 dyes per cDNA molecule was found. (C) Comparison with a commercial platform. Data obtained on 200 ng of total RNA using the presented platform were analyzed by measuring the mean fluorescence per pixel (blue dots) and by counting individual molecules per spot for surface densities smaller than 1000 molecules per spot (green circles). When both types of analysis were feasible, the method yielding less variation in eight replicates was selected. For comparison, mean fluorescence intensity values are plotted in units of molecules per spot, by normalizing with the average brightness of individual cDNA molecules. A 100-fold higher concentration of the same sample was analyzed using a commercial system (substrate: Schott Nexterion; confocal reader: ScanArray 4000, Perkin Elmer). For each gene, the result of the ultrasensitive system (x-axis) is plotted against the result of the commercial system (y-axis). The data were found to correlate well, yielding a linear Pearson correlation coefficient of 0.85. (see Supplemental Tables S2 and S3, which contain a list of all results).
For validation, we compared the expression profiles obtained with the platform described above to those of a conventional microarray platform. A 100-fold higher amount of cDNA from the same RNA preparation was hybridized to commercially available aldehyde substrates (Schott Nexterion) under identical conditions and scanned with a conventional confocal microarray scanner (ScanArray 4000, Perkin Elmer). The signals derived from both measurements are in good agreement, yielding a Pearson correlation coefficient of 0.85. The high consistency of the data obtained here using different microarray platforms and different sample amounts appears remarkable, as typically a considerable divergence of gene-expression results has been observed when comparing commercial products (Tan et al. 2003; Irizarry et al. 2005). Tan et al. (2003) find hardly any correlation when comparing hybridization on different platforms (coefficients ranging from 0.5 to 0.6). However, differences in the capture sequences of the commercial microarrays may dominate the measured signal differences. Irizarry et al. (2005) have therefore used a refined comparison method, which analyzes whether different laboratories can identify differential gene expression on the same sample. As identical platforms were used for comparison, a higher correlation coefficient has been obtained (∼0.91–0.98). The intermediate result revealed in our study reflects the fact that different platforms containing the same oligoset have been investigated.
The system presented enables expression profiling of minute amounts of sample material. Material from the equivalent of only 104 cells can be reliably analyzed without prior PCR amplification steps. Connection to sample isolation and microfluidic purification techniques offers the exciting perspective to directly analyze minute cell populations in biomedical applications. In addition to sensitivity, 4.7 orders of magnitude dynamic range significantly exceeds specifications of conventional microarray platforms and approaches the complete biological range of mRNA expression levels of up to six orders of magnitude (Holland 2002).
Methods
Single molecule biochip reader
The detection system was set up on an epifluorescence microscope (Axiovert 200, Zeiss) (Hesse et al. 2004). Ar+- and Kr+-ion lasers (Innova, Coherent) were used for selective fluorescence excitation of Cy3 at 514 nm and Cy5/Alexa647 at 647 nm, respectively. Samples were illuminated in objective-type total internal reflection (TIR) configuration using a 100× oil immersion objective (NA = 1.45, α-Fluar, Zeiss). After appropriate filtering using standard Cy3 and Cy5 filter sets (Chroma Technology Corp.), fluorescence was imaged onto a back-illuminated CCD camera (SPEC10:100B, Princeton Instruments; quantum efficiency = 90%, gain = 0.77counts/e-). Biochip readout was performed in time-delay and integration (TDI) mode. For this, samples were shifted using a motorized xy-stage (Scan IM 120 × 100, Märzhäuser) synchronized to the line-shift of the camera. During the TDI-scan, data were streamed into the RAM of the PC and stored on the hard disk in the course of repositioning for the next scan. The reader was equipped with an automated focus hold system operating during the scanning process; the back-reflected laser beam is imaged on a two-segment photodiode, and the differential signal is used to control a z-piezo (PIFOC, Physik Instrumente) for fast refocusing.
Microarray preparation
Aldehyde-derivatized glass coverslips were prepared as described (Schlapak et al. 2005). For evaluation of sensitivity and dynamic range, probe oligonucleotide ([NH2-C12]ATAGAAATGCA GCGTGGATCTCTTAGCAGATTGAAACCGAGCTGTAGC GCTTGTGCCACC) (VBC-Genomics) and control oligonucleotides with a sequence identical to the target ([NH2-C12] GGTG GCACAAGCGCTACAGCTCGGTTTCAATCTGCTAAGAGAT CCACGCTGCATTTCTAT) were spotted with a MicroGridII arrayer (Genomic Solutions) using Stealth SMP3 Microarray Spotting Pins (TeleChem International, Inc.) onto 150-μm aldehyde coated coverslips (Schlapak et al. 2005).
Target oligonucleotides labeled with Cy3 or Cy5 at the 5′ end (Cy3/Cy5-GGTGGCACAAGCGCTACAGCTCGGTTTC AATCTGCTAAGAGATCCACGCTGCATTTCTAT) (VBC Genomics) were used for evaluation of sensitivity and dynamic range of the developed platform.
For RNA profiling, 96 oligonucleotides of the Human Genome Oligo Set V3 (Operon) and 29 oligonucleotides designed using OligoWiz 1.0 (http://www.cbs.dtu.dk/services/OligoWiz/) were printed. Oligonucleotides were dissolved in 3×SSC/1.5 M betaine to a final concentration of 20 μM.
After printing, the slides were stored under dry conditions for 1 d at room temperature. Stable covalent coupling to the chip surface and removal of unbound probe oligonucleotides was achieved by extensive washing (1 h) with blocking buffer (0.1 M Na-carbonate, 0.1 M 4-aminobutanoic acid, 10 μM NaBH3CN at pH 8.0), followed by a washing step with 1×SSC buffer. Directly after washing, slides were used for hybridization experiments.
RNA preparation
Total RNA from HaCaT cells was extracted with TRI reagent (Molecular Research Center) according to the manufacturer’s instructions, followed by precipitation with 3 M LiCl. cDNA labeling was carried out according to manufacturer’s instructions (Molecular Probes, Invitrogen). In brief, 20 μg of total RNA was reverse transcribed with Superscript II (Invitrogen Life Technologies) in the presence of Alexa Fluor 647-aha-dUTP (Molecular Probes, Invitrogen). Labeled cDNA was purified with CyScribeTM GFXTM purification columns (Amersham Biosciences) and vacuum dried using a Centrivap Concentrator (Labconco).
Hybridization
Hybridization of 60mer Cy3 and Cy5 oligonucleotides was carried out for 60 min at 24°C in 4×SSC/0.1% SDS. Identical subarrays on the same biochip were separated by an adhesive silicone mask (Secure Seal, Schleicher & Schuell), creating six hybridization chambers with 50 μL of sample volume and incubated with target oligonucleotides at different concentrations. cDNA was dissolved in 3×SSC/0.1% SDS, heated to 96°C for 3 min, and hybridized under LifterSlip (Erie Scientific Company) at 50°C for 16 h in 3×SSC/0.1% SDS using a semiautomated hybridization station (SlideBooster, Advalytix AG; mixing to pause ratio: 3:7, mixing power: 27). In all experiments, hybridization was followed by sequential washes in 1×SSC/0.1% SDS; 0.1×SSC/0.1% SDS, and 0.1×SSC. Directly after washing, the microarray was covered with 0.1×SSC buffer and LifterSlip, and scanned.
Conventional microarrays were hybridized with labeled cDNA synthesized from 20 μg of total RNA. Following precipitation with EtOH, cDNA was dissolved in 3×SSC/0.1% SDS, heated to 96°C for 3 min, and hybridized overnight at 50°C in a semiautomated hybridization station (SlideBooster, Advalytix AG) at a mixing:pause ratio of 3:7, mixing power: 27. Slides were washed at 30°C in a semiautomated wash station (Advalytix AG) two times for 10 min in 2×SSC/0.1% SDS, two times for 10 min in 0.2×SSC/0.1%SDS, and two times for 5 min in 0.2×SSC. Slides were dried by spinning for 3 min at 250g and subsequently scanned on a ScanArray 4000 confocal microarray scanner (Perkin Elmer).
Data analysis
To increase analysis speed, the grid-fitting step was performed on a software-binned (10 × 10) image. After application of a global threshold by the Otsu method and removal of features smaller than the expected spot size, spot diameter and separation were computed from the remaining features. Based on these values, a grid was constructed and aligned to the brightest spots. For subsequent analysis, subimages (1000 × 1000 pixel) were loaded at full resolution.
Diffraction-limited peaks are small, approximately symmetric features over the background noise. For counting the total number of peaks per spot, N, we used the à trous wavelet filter bank method as described previously (Starck et al. 1998; Olivo-Marin 2002). We apply the Anscombe transform
 |
to convert the Poisson noise present in the images I to Gaussian noise as required by the à trous wavelet filter bank method. The resulting image A is decomposed via a sequence of low-pass and band-pass filters. For low-pass filtering, we convolve the image A with B-spline kernels of order 3, b'0⊗b0, where b0 = [1⁄16,1⁄4,3⁄8,1⁄4,1⁄16]. Low-pass filtering is iterated with kernels bj, where bj+1 is obtained by inserting lines and columns of zeros between the lines and columns of bj, yielding
 |
The high-pass filter is obtained as the difference of two consecutive low-pass filtered images
 |
Each wavelet plane Wj contains information on feature of scale j and Gaussian noise σj. We estimate the variance of the noise via robust statistics methods σj2 = (x,ymedian|Wj(x,y) − m|)2, where m is the median of Wj(x, y). σj allows separation of the significant wavelet coefficients from those due to noise:
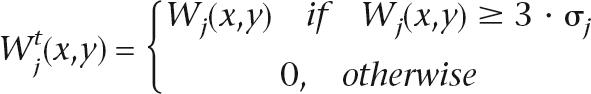 |
Due to the redundancy of the wavelet planes Wj, salient features tend to produce significant coefficients across scales. A good way to detect salient features is by computing the multiscale product of the denoised wavelet planes, where non-zero values correspond to the position of the peaks:
 |
Optimal detection was achieved with J = 4. Finally, the number of peaks, N, is determined as the number of points (x,y) for which PJ(x, y) > 0 holds and A(x,y) is a local maximum (in the original image). The intensity of diffraction-limited peaks was determined by fitting with a two-dimensional Gaussian profile as described (Schmidt et al. 1996).
Acknowledgments
This study was supported by the GEN-AU program of the Austrian Federal Ministry of Education, Science, and Culture, by the Austrian Research Fund, by the state of Upper Austria, and by the Priority Program “Life Sciences and Health” of the University of Salzburg.
Footnotes
[Supplemental material is available online at www.genome.org.]
Article published online before print. Article and publication date are at http://www.genome.org/cgi/doi/10.1101/gr.4999906
References
- Baugh L.R., Hill A.A., Brown E.L., Hunter C.P., Hill A.A., Brown E.L., Hunter C.P., Brown E.L., Hunter C.P., Hunter C.P. Quantitative analysis of mRNA amplification by in vitro transcription. Nucleic Acids Res. 2001;29:E29. doi: 10.1093/nar/29.5.e29. [DOI] [PMC free article] [PubMed] [Google Scholar]
- Hesse J., Sonnleitner M., Sonnleitner A., Freudenthaler G., Jacak J., Höglinger O., Schindler H., Schutz G.J., Sonnleitner M., Sonnleitner A., Freudenthaler G., Jacak J., Höglinger O., Schindler H., Schutz G.J., Sonnleitner A., Freudenthaler G., Jacak J., Höglinger O., Schindler H., Schutz G.J., Freudenthaler G., Jacak J., Höglinger O., Schindler H., Schutz G.J., Jacak J., Höglinger O., Schindler H., Schutz G.J., Höglinger O., Schindler H., Schutz G.J., Schindler H., Schutz G.J., Schutz G.J. Single-molecule reader for high-throughput bioanalysis. Anal. Chem. 2004;76:5960–5964. doi: 10.1021/ac049300f. [DOI] [PubMed] [Google Scholar]
- Holland M.J. Transcript abundance in yeast varies over six orders of magnitude. J. Biol. Chem. 2002;277:14363–14366. doi: 10.1074/jbc.C200101200. [DOI] [PubMed] [Google Scholar]
- Hong J.W., Studer V., Hang G., Anderson W.F., Quake S.R., Studer V., Hang G., Anderson W.F., Quake S.R., Hang G., Anderson W.F., Quake S.R., Anderson W.F., Quake S.R., Quake S.R. A nanoliter-scale nucleic acid processor with parallel architecture. Nat. Biotechnol. 2004;22:435–439. doi: 10.1038/nbt951. [DOI] [PubMed] [Google Scholar]
- Hu L., Wang J., Baggerly K., Wang H., Fuller G.N., Hamilton S.R., Coombes K.R., Zhang W., Wang J., Baggerly K., Wang H., Fuller G.N., Hamilton S.R., Coombes K.R., Zhang W., Baggerly K., Wang H., Fuller G.N., Hamilton S.R., Coombes K.R., Zhang W., Wang H., Fuller G.N., Hamilton S.R., Coombes K.R., Zhang W., Fuller G.N., Hamilton S.R., Coombes K.R., Zhang W., Hamilton S.R., Coombes K.R., Zhang W., Coombes K.R., Zhang W., Zhang W. Obtaining reliable information from minute amounts of RNA using cDNA microarrays. BMC Genomics. 2002;3:16. doi: 10.1186/1471-2164-3-16. [DOI] [PMC free article] [PubMed] [Google Scholar]
- Irizarry R.A., Warren D., Spencer F., Kim I.F., Biswal S., Frank B.C., Gabrielson E., Garcia J.G.N., Geoghegan J., Germino G., Warren D., Spencer F., Kim I.F., Biswal S., Frank B.C., Gabrielson E., Garcia J.G.N., Geoghegan J., Germino G., Spencer F., Kim I.F., Biswal S., Frank B.C., Gabrielson E., Garcia J.G.N., Geoghegan J., Germino G., Kim I.F., Biswal S., Frank B.C., Gabrielson E., Garcia J.G.N., Geoghegan J., Germino G., Biswal S., Frank B.C., Gabrielson E., Garcia J.G.N., Geoghegan J., Germino G., Frank B.C., Gabrielson E., Garcia J.G.N., Geoghegan J., Germino G., Gabrielson E., Garcia J.G.N., Geoghegan J., Germino G., Garcia J.G.N., Geoghegan J., Germino G., Geoghegan J., Germino G., Germino G., et al. Multiple-laboratory comparison of microarray platforms. Nat. Methods. 2005;2:345–349. doi: 10.1038/nmeth756. [DOI] [PubMed] [Google Scholar]
- Kacharmina J.E., Crino P.B., Eberwine J., Crino P.B., Eberwine J., Eberwine J. Preparation of cDNA from single cells and subcellular regions. Methods Enzymol. 1999;303:3–18. doi: 10.1016/s0076-6879(99)03003-7. [DOI] [PubMed] [Google Scholar]
- Mahadevappa M., Warrington J.A., Warrington J.A. A high-density probe array sample preparation method using 10- to 100-fold fewer cells. Nat. Biotechnol. 1999;17:1134–1136. doi: 10.1038/15124. [DOI] [PubMed] [Google Scholar]
- Olivo-Marin J.C. Extraction of spots in biological images using multiscale products. Pattern Recognit. 2002;35:1989–1996. [Google Scholar]
- Paegel B.M., Blazej R.G., Mathies R.A., Blazej R.G., Mathies R.A., Mathies R.A. Microfluidic devices for DNA sequencing: Sample preparation and electrophoretic analysis. Curr. Opin. Biotechnol. 2003;14:42–50. doi: 10.1016/s0958-1669(02)00004-6. [DOI] [PubMed] [Google Scholar]
- Schlapak R., Pammer P., Armitage D., Zhu R., Hinterdorfer P., Vaupel M., Frühwirt T., Howorka S., Pammer P., Armitage D., Zhu R., Hinterdorfer P., Vaupel M., Frühwirt T., Howorka S., Armitage D., Zhu R., Hinterdorfer P., Vaupel M., Frühwirt T., Howorka S., Zhu R., Hinterdorfer P., Vaupel M., Frühwirt T., Howorka S., Hinterdorfer P., Vaupel M., Frühwirt T., Howorka S., Vaupel M., Frühwirt T., Howorka S., Frühwirt T., Howorka S., Howorka S. Glass surfaces grafted with high-density poly(ethylene glycol) as substrates for DNA oligonucleotide microarrays. Langmuir. 2005;22:277–285. doi: 10.1021/la0521793. [DOI] [PubMed] [Google Scholar]
- Schmidt T., Schutz G.J., Baumgartner W., Gruber H.J., Schindler H., Schutz G.J., Baumgartner W., Gruber H.J., Schindler H., Baumgartner W., Gruber H.J., Schindler H., Gruber H.J., Schindler H., Schindler H. Imaging of single molecule diffusion. Proc. Natl. Acad. Sci. 1996;93:2926–2929. doi: 10.1073/pnas.93.7.2926. [DOI] [PMC free article] [PubMed] [Google Scholar]
- Sonnleitner M., Freudenthaler G., Hesse J., Schütz G.J., Freudenthaler G., Hesse J., Schütz G.J., Hesse J., Schütz G.J., Schütz G.J. High-throughput scanning with single-molecule sensitivity. Proc. SPIE. 2005;5699:202–210. [Google Scholar]
- Starck J.-L., Murtagh F., Bijaoui A., Murtagh F., Bijaoui A., Bijaoui A. Cambridge University Press; Cambridge, UK: 1998. Image processing and data analysis—The multiscale approach. [Google Scholar]
- Tan P.K., Downey T.J., Spitznagel E.L., Xu P., Fu D., Dimitrov D.S., Lempicki R.A., Raaka B.M., Cam M.C., Downey T.J., Spitznagel E.L., Xu P., Fu D., Dimitrov D.S., Lempicki R.A., Raaka B.M., Cam M.C., Spitznagel E.L., Xu P., Fu D., Dimitrov D.S., Lempicki R.A., Raaka B.M., Cam M.C., Xu P., Fu D., Dimitrov D.S., Lempicki R.A., Raaka B.M., Cam M.C., Fu D., Dimitrov D.S., Lempicki R.A., Raaka B.M., Cam M.C., Dimitrov D.S., Lempicki R.A., Raaka B.M., Cam M.C., Lempicki R.A., Raaka B.M., Cam M.C., Raaka B.M., Cam M.C., Cam M.C. Evaluation of gene expression measurements from commercial microarray platforms. Nucleic Acids Res. 2003;31:5676–5684. doi: 10.1093/nar/gkg763. [DOI] [PMC free article] [PubMed] [Google Scholar]
- Taylor B.T., Nambiar P.R., Raja R., Cheung E., Rosenberg D.W., Anderegg B., Nambiar P.R., Raja R., Cheung E., Rosenberg D.W., Anderegg B., Raja R., Cheung E., Rosenberg D.W., Anderegg B., Cheung E., Rosenberg D.W., Anderegg B., Rosenberg D.W., Anderegg B., Anderegg B. Microgenomics: Identification of new expression profiles via small and single-cell sample analyses. Cytometry A. 2004;59A:254–261. doi: 10.1002/cyto.a.20051. [DOI] [PubMed] [Google Scholar]
- Van Gelder R.N., von Zastrow M.E., Yool A., Dement W.C., Barchas J.D., Eberwine J.H., von Zastrow M.E., Yool A., Dement W.C., Barchas J.D., Eberwine J.H., Yool A., Dement W.C., Barchas J.D., Eberwine J.H., Dement W.C., Barchas J.D., Eberwine J.H., Barchas J.D., Eberwine J.H., Eberwine J.H. Amplified RNA synthesized from limited quantities of heterogeneous cDNA. Proc. Natl. Acad. Sci. 1990;87:1663–1667. doi: 10.1073/pnas.87.5.1663. [DOI] [PMC free article] [PubMed] [Google Scholar]
- Wang E., Miller L.D., Ohnmacht G.A., Liu E.T., Marincola F.M., Miller L.D., Ohnmacht G.A., Liu E.T., Marincola F.M., Ohnmacht G.A., Liu E.T., Marincola F.M., Liu E.T., Marincola F.M., Marincola F.M. High-fidelity mRNA amplification for gene profiling. Nat. Biotechnol. 2000;18:457–459. doi: 10.1038/74546. [DOI] [PubMed] [Google Scholar]