

Abstract
Highly efficient separation techniques, laser-induced fluorescence (LIF) detection, and different mass-spectrometric (MS) measurements were combined in a multimethodological scheme to perform a comprehensive structural characterization of N-linked oligosaccharides in a murine monoclonal antibody (immunoglobulin G (IgGk)). Monosaccharide compositional analysis was carried out through a capillary electrophoresis (CE)-LIF method, in which the chemically and enzymatically released sugars were fluorescently labeled. This analysis provides a preliminary assessment of certain structures, being followed by CE-LIF and matrix-assisted laser desorption/ionization (MALDI)-MS profiling of the intact glycan structures. Linkages and monosaccharide residues were confirmed by MALDI-MS in conjunction with exoglycosidase digestion. MALDI-MS and CE data were effectively combined to reveal the overall structural diversity of both acidic and neutral glycans. Finally, the sites of glycosylation and site occupancies were deduced through the measurements performed with microcolumn liquid chromatography coupled via electrospray to a quadrupole/time-of-flight instrument.
Keywords: Glycoproteins, Glycosylation sites, N-Glycans, Recombinant monoclonal antibody
1 Introduction
Glycosylated recombinant proteins, in general, and monoclonal antibodies in particular, have received considerable attention during the last several years due to their potential as new therapeutics and diagnostic reagents [1, 2]. To document their structural attributes, biochemical analysis of recombinant glycoproteins is necessary from the point of discovery until the production process monitoring steps, including the early stages of expression. The demands of such analyses become particularly crucial during production, as monitoring batch-to-batch consistency is needed to illustrate a constant and reliable biological activity of glycoproteins.
Unlike with the protein backbone, which is genetically coded in a direct way, the cDNA sequence can only predict the position of potential glycosylation sites (N- or O-linked glycans), but provides no information on the actual glycan structures that might be attached. Moreover, the process of glycosylation can be largely influenced by a particular cell-line, a specific protein conformation, and the general cell culture conditions, i.e., the effect of environment [3]. The fact that the biosynthetic pathway associated with a correct buildup of glycan moieties in a glycoprotein is controlled by enzymes present in limited quantities prompts a variable microheterogeneity of all glycosylation sites. It has been shown repeatedly [4-7] that alteration in protein glycosylation, through varying the heterogeneity of glycosylation site or changing glycan structures, can influence profoundly the biological activities of recombinant monoclonal antibodies. For example, glycosylation of immunoglobulin G (IgG) will affect both its physicochemical properties and, more significantly, its biological roles, such as complement binding and activation [8-11]. Accordingly, the manufacturing of therapeutic recombinant monoclonal antibodies demands a full, accurate, and sensitive assessment of a product's microheterogeneity and its batch-to-batch consistency.
In general terms, a detailed structural analysis of a glycoprotein demands multimethodological approach [12]. While the analytical demands become more challenging for large glycoproteins with multiple glycosylation sites and extensive site heterogeneities, these challenges have been continuously met with evolving methodologies of greater component resolution and higher sensitivity. The current status of these methodological advances is being demonstrated in this publication with an example of murine monoclonal antibody, IgGk, which was available to us in a very minute quantity.
Mass spectrometry (MS) has been widely recognized as the ultimate analytical technique utilized for the characterization of glycan structures derived from glycoproteins. In most cases, the monosaccharide composition of a glycan structure can be directly deduced from the m/z values observed in a mass spectrum. This is facilitated by the fact that these structures consist of a very limited set of residues including galactose (Gal), mannose (Man), fucose (Fuc), N-acetylglucosamine (GlcNAc), N-acetyl- and N-glycolylneuraminic acid (NeuAc and NeuGc). Accordingly, the identification of various glycan structures observed as ions in a mass spectrum is fairly straightforward. However, more sophisticated approaches are required to differentiate unresolved isobaric glycan structures, including (but not limited to) Gal(1–3)GlcNAc versus Gal(1–4)GlcNAC, and NeuAc(2–3)Gal versus NeuAc(2–6)Gal. These approaches include methylation analysis [13], tandem mass spectrometry (MS/MS) experiments [14-19], and MS combined with enzymatic digestion [20]. In addition, various chromatographic and electrophoretic methods have been developed to assess the distribution of glycans derived from glycoproteins. Both approaches rely on the derivatization of glycans with fluorophores to ensure sensitive detection. 2-Aminobenzamide [21], 2-aminobenzoic acid [21,22], and 2-aminopyridine [23] are the most commonly used labeling fluorophores with chromatographically based methods, while 8-aminopyrene-1,3,6-trisulfonic acid [24, 25] has become the most common fluorophore used with electrophoretically-based methods.
The basic aim of this communication is to demonstrate the power of combining the best evolving capillary separation techniques and the state-of-the-art MS technologies in a detailed structural characterization of a small amount of a biological sample. First, qualitative and quantitative profiling of the N-glycan structures was attained through a combined use of data from the matrix-assisted laser desorption/ionization (MALDI)-MS and capillary electrophoresis/laser-induced fluorescence (CE-LIF) methodologies. The monosaccharide compositional analysis, based on another CE-LIF methodology (modified to meet submicrogram sample demands), was needed to verify the results of MS investigations. Finally, the sites of glycosylation and their heterogeneity were assessed through the use of a hybride quadrupole/time-of-flight (Q-TOF)-MS instrument. Through the combination of these highly efficient and sensitive techniques, a comprehensive glycosylation necessitated, collectively, less than 20 μg of a glycoprotein, which is consistent with the general needs of drug discovery and biochemical research.
2 Materials and methods
2.1 Materials
Murine monoclonal antibody (mAb) (IgG1K) was kindly provided by Eli Lilly and Company (Indianapolis, IN, USA). This mAb has a potential glycosylation site in the VH domain in addition to the preserved glycosylation site of the Fc region. The sample was provided in PBS buffer, pH 7.4, at 3.97 mg/mL concentration. High-purity 8-aminopyrene-1,3,6-trisulfonate (APTS) was purchased from Beckman Coulter (Fullerton, CA, USA). Recombinant neuraminidase III from Arthrobacter ureafaciens (EC 3.2.1.18), N-acetylneuraminic acid aldolase from Escherichia coli (EC 4.1.3.3), recombinant β-N-acetylglucosaminidase I from Streptococcus pneumoniae (EC 3.2.1.52), recombinant β-galactosidase III from Streptococcus pneumoniae (EC 3.2.1.23), and monosaccharide standards (fucose, galactose, lactose, mannose, N-acetylglucosamine, N-acetylmannosamine, N-acetylgalactosamine and N-glycolymannosamine) were obtained from Sigma (St. Louis, MO, USA). Recombinant N-glycanase (peptide-N-glycosidase F) from Chryseobacterium meningosepticum (EC 3.5.1.52), α-fucosidases II and III from Xanthomonas manihotis, and standard glycans were purchased from Prozyme/Glyko (San Leandro, CA, USA).
2.2 Methods
2.2.1 Glycoprotein desalting
Due to a high salt concentration in the sample which could adversely influence the analyses, the sample was first desalted using Microcon YM-10 centrifugal filtering device (Millipore, Bedford, MA, USA). This device employs Amicon's low-binding, anisotropic, hydrophilic regenerated cellulose membrane, and has a nominal molecular mass limit of 10 000 Da. The desalted sample was then lyophilized and resuspended in deionized water to a 1 mg/mL concentration.
2.2.2 CE-LIF N-glycan profiling
N-Glycan profiles were acquired by CE-LIF technique using coated capillaries with suppressed electroosmotic flow. Electroosmotic flow suppression is needed to facilitate the analysis of negatively charged analytes in a reasonable analysis time. Inner capillary walls were coated with a linear polyacrylamide using a modified version of Hjertén's procedure [26, 27]. Briefly, the capillaries were rinsed with 1.0 m sodium hydroxide aqueous solution for 1 h, and then with water and methanol for 15 min each. The capillaries were then reacted with the binding silane, γ-methacryloxypropyltrimethoxysilane (45 μL dissolved in 1.5 mL methyl dichloride containing 0.02 m acetic acid), for 45 min. Again, the capillaries were flushed with methanol and then water for 15 min each. Subsequently, the capillaries were coated with 2.4% w/w acrylamide aqueous solution containing 1 μL/mL N,N,N′,N′-tetramethylethylenediamine and 1.0 mg/mL ammonium persulfate for 120 min. Finally, the surfaces were rinsed with distilled water for 20 min and dried under a stream of nitrogen for another 20 min. For all steps, the inlet pressure of approximately 40–60 psi was applied. Enzymatically released glycans were labeled with APTS according to a modified version of a previously reported procedure [24]. Briefly, dried glycoprotein sample (∼2 μg) was resuspended in 2.5 μL phosphate buffer (pH 6) with 1% β-mercaptoethanol and thermally denatured at 95°C for 5 min. A 0.5 μL aliquot of N-glycanase was added to the cooled sample and the mixture was incubated overnight at 37°C. Released glycans were vacuum-dried and resuspended in 2 μL 100 mm APTS (prepared in 0.9 m citric acid) and 1 μL aliquot of 1 m sodium cyanoborohydride solution prepared in dimethylsulfoxide. The mixture was then incubated at 55°C for 2 h. Next, the derivatization mixture was dialyzed overnight at ambient temperature on 1000 Da cut-off cellulose membrane to reduce/eliminate the excess of the derivatizing reagent. Finally, the dialyzed mixture was lyophilized and resuspended in 15 μL water prior to its CE-LIF analysis.
2.2.3 Monosaccharide compositional analysis
Compositional analysis of monosaccharides was performed with a CE-LIF technique, using bare fused-silica capillaries and the cathodic electroosmotic flow. This approach was mainly adopted from the procedure of Chen and Evangelista [25] with modifications that were necessary to permit the analysis at low microgram level. The compositional analysis was performed in two steps. The first step involved the analysis of acid-hydrolyzed neutral monosaccharide residues, while the second step involved the analysis of enzymatically released sialic acid residues. First, the known amount of a dried glycoprotein (μ 5 μg) was hydrolyzed in 100 μL 4m TFA (2 h at 95°C); after drying, re-acetylation of amino monosaccharides was performed for 30 min, at ambient temperature using 2 μL acetic anhydride in 5 μL 25 mm ammonium carbonate (pH 9.5). The mixture was then dried and the released neutral monosaccharides with an added internal standard (lactose) were resuspended in 2 μL 0.1 m APTS (prepared in 0.9 m citric acid) and 1 μL 1 m sodium cyanoborohydride dissolved in dimethyl sulfoxide (DMSO). The mixture was then incubated at 55°C for 2 h. The reaction was stopped by the addition of 197 μL distilled water. The labeled mixture was diluted 50-fold prior to its CE-LIF analysis. Second, a dried glycoprotein sample was resuspended in 2.5 μL 10 mm phosphate buffer (pH 6) prepared in 1% β-mercaptoethanol aqueous solution. The sample was thermally denatured prior to the addition of a 1 μL aliquot of neuraminidase III. The reaction mixture was then incubated for 4 h at 37°C. Next, the sample was dried, while neuraminic acids were converted to their respective mannosamines through the incubation in 1 μL N-acetylneuraminic acid aldolase for 45 min (ambient temperature). The sample was finally derivatized with APTS and diluted, as described above, prior to a CE-LIF analysis.
2.2.4 Structural analysis of N-glycans
Structural characterization of N-glycans derived from the antibody was achieved by MALDI-TOF-MS in conjunction with specific exoglycosidases, as previously described [20]. Briefly, thermally denatured protein was incubated with N-glycanase (3 h at 37°C) and two aliquots were used to obtain MALDI-TOF-MS profiles in both the negative and positive ion mode. Sample was then sequentially treated with neuraminidase I (NANase I), neuraminidase III (NANase III), galactosidase I (GALase I), N-acetylglucosaminidase I (HEXase I), α-fucosidase II and III (FUCase II and III). Subsequent to each enzymatic addition, an aliquot was spotted with the appropriate matrix on a MALDI plate and a spectrum was acquired. An observed mass shift, which was a result of the enzymatic incubation, indicated a positive action of the enzyme, thus suggesting the presence of a certain monosaccharide moiety with a specific linkage associated with the specificity of the exoglycosidases used. Positive-ion mode MALDI-TOF mass spectrum was acquired using 2,5-dihydroxybenzoic acid (DHB) matrix prepared in 50/50 v/v water/methanol solution at 10 mg/mL concentration, while a saturated DHB matrix prepared in 300 mm spermine aqueous solution was used to acquire negative ion MALDI mass spectrum, as we have previously reported [28].
2.2.5 Tryptic digestion of glycoproteins
A 1 μg aliquot of the glycoprotein resuspended in 100 mm ammonium bicarbonate, pH 8.6, was thermally denatured. A trypsin stock solution was prepared by dissolving 20 mg of the enzyme in 1 mm hydrochloric acid aqueous solution to a 1 mg/mL final concentration. Next, an aliquot of this solution was diluted 50-fold. Finally, a 1 μL aliquot of the diluted trypsin solution was added to the thermally denatured glycoprotein and incubated overnight at 37°C.
2.2.6 Determination of the sites of glycosylation
Glycoprotein glycosylation sites were assessed utilizing nano-LC interfaced to a Micromass QTOF Global (Waters, Milford, MA, USA). A 0.1 μg amount of the tryptically digested sample was introduced using the Micromass CapLC (Waters) system. The stream select module, attached directly to the nano-spray source, was configured with a trapping column (0.3 × 5 mm, C18) where the sample was first loaded via the autosampler and desalted. The 10-port valve was switched after ca. 5 min, after which a 60 min gradient (0–40% B (97% acetonitrile and 0.1% formic acid)) was initiated to elute the sample from the trapping column and separate the analytes on a capillary column (LC Packings, Amsterdam, The Netherlands; 15 × 0.075 mm, C18 PepMap). A 250 nL/min flow through the column was achieved using a precolumn splitter. Parent ion discovery (PID) experiment was performed on the tryptic digest. In this experiment, the voltage on the gas collision cell was switched between high (35 V) and low (8 V) every second. This provided both a standard low-energy MS spectrum and a high-energy MS spectrum of all product ions generated from the precursorions seen in the normal scan (low-energy scan). Upon detection of the carbohydrate-characteristic oxonium ions (i.e., m/z 204, 366, 290, and 308), the QTOF instrument switched to MS/MS mode and selected the most intense, triply or quadruply charged ion for fragmentation. MS/MS analysis was performed for 6 s at 1 s scan rate. This process is repeated until the eight most intense precursor ions during a single scan become selected for MS/MS experiments. During the MS/MS experiment, a collision energy ramp from 20–40 V was applied to yield a diverse range of fragment ions, thus providing as much structural information as possible. Accordingly, the MS/MS spectra provided the information pertaining to both the site of glycosylation and the glycan structures attached.
2.3 Instrumentation
P/ACEO™ MDQ Capillary Electrophoresis System equipped with 488 nm laser and LIF detector modules (Beckman Coulter) was employed for both N-glycan profiling and monosaccharide analysis. Voyager-DE™ RP Biospectrometry™ Workstation (PerSeptive Biosystems, Framingham, MA, USA), controlled by Version 5.1 of Voyager™ software was used for profiling and enzymatic sequencing of N-linked glycans derived from the monoclonal antibody. CapLC System interfaced to a Micromass Q-TOF Global Mass Spectrometer (Waters, Milford, MA) equipped with the nanoESI source was utilized for assessing the sites of glycosylation and their microheterogeneity.
3 Results and discussion
3.1 Monosaccharide compositional analysis
Monosaccharide compositional analysis reflects the amount of each monosaccharide residue attached to a protein and consequently allows the absolute determination of the extent of protein glycosylation. Although several approaches have been developed over the years for the compositional analysis of monosaccharides including gas chromatography (GC) [29], high-pH anio-exchange chromatography (HPAEC) [30] and CE [31], CE with LIF detection is considered to be the most sensitive and efficient approach eliminating the need for a large amount of sample which is commonly necessary in such analysis, but may not be readily available in some biochemical investigations.
Although the approach described by Chen an Evangelista [25] has been employed for monosaccharide composition analysis of small quantities of glycoproteins, we did not find it satisfactory for the analysis of low-microgram and lesser quantities. This was mainly attributed to reaction byproducts with the migration times comparable to those of the labeled monosaccharides, thus creating substantial interference. Several attempts were made to overcome this problem, including reduction of the reaction temperature, and amount of the labeling reagent, and smaller reaction volumes. However, none of these potential remedies were successful. The presence of the byproduct peaks was significantly reduced (in some cases eliminated) using DMSO as the reaction solvent, thus permitting monosaccharide compositional analysis down to submicrogram levels.
A total of 6 μg of the mAb was consumed to determine the amount of each monosaccharide residue attached. The neutral monosaccharide residues were determined separately from the sialic acid residues (which were cleaved enzymatically). The CE-LIF electropherograms of the monosaccharide compositional analysis are depicted in Figs. 1a and b, while the quantitative information derived from the electropherograms is summarized in Table 1. These data revealed the absence of N-acetylgalactosamine (GalNAc), the essential building block of O-linked glycans in the sample, confirming a lack of O-linked glycans which are not commonly observed in mAb [32]. It was also suggested from the data that all the N-linked glycans attached to this mAb are fucosylated, as indicated by the Man/Fuc ratio of 3/1. The Man/GlcNAc ratio of 3/4.8 also indicated the possibility of having some triantennary structures in addition to the biantennary structures which are commonly associated with mAb. Theoretically the presence of only bi- and triantennary structures, as suggested by the previous finding, should result in having a Man/Gal ratio between 3/2 and 3/3. However, the fact that the Man/Gal ratio was approximately 3/2 indicated the possibility of having some of the glycans with partially completed antennas. The determination of sialic acid at low amounts suggested the presence of some sialylated structures, with their abundance to be less than that of the asialylated structures. In general, antibodies are expected to possess only monosialylated structures on their constant domain site of glycosylation. The determination of sialic acid residue suggests the possibility of having an additional site of glycosylation associated with the variable domain, which is true for the mAb analyzed here. A slight shift in the migration time of the sialic acid residue determined in mAb (relative to the N-acetylneuraminic acid standard initially used) suggested the sialylation of the glycan structures derived from this mAb to be associated with N-glycolylneuraminic acid residue (NeuGc). This was eventually confirmed by spiking the sample with the NeuGc standard.
Figure 1.
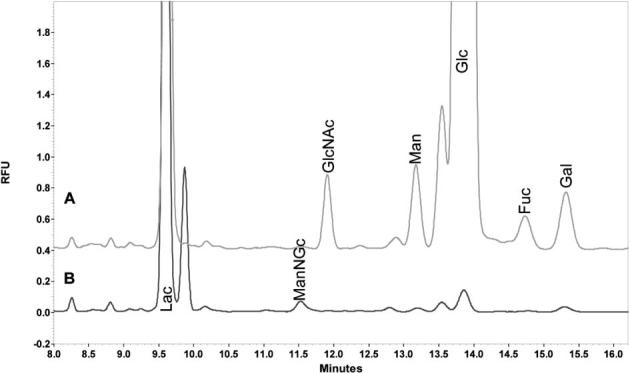
CE profile of (A) neutral and (B) sialic acid APTS-labeled monosaccharides derived from mAb. Conditions: Column, bare fused silica 50/365 μm ID/OD; length, 50.5 cm total, 40.5 cm effective length; temperature, 25°C; injection pressure, 0.5 psi for 5.0 s; voltage, 8.5 kV cathodic electroosmotic flow; λex 488 nm, λem 520.
Table 1.
Abundance of monosaccharides in the antibody based on CE-LIF analysis
| Ratio (mol/mol)a) | Ratio normalized to three mannose residues | Mass (ng) | |
|---|---|---|---|
| Gal | 4.87 ± 0.1 | 1.99 | 11.7 ± 0.3 |
| Fuc | 3.24 ± 0.3 | 1.32 | 7.1 ± 0.7 |
| Man | 7.33 ± 0.3 | 3 | 17.6 ± 0.8 |
| GlcNAc | 11.83 ± 0.4 | 4.84 | 35.0 ± 1.3 |
| ManNAc | 0 | 0 | 0 |
| ManNGc | 0.52 ± 0.1 | 0.21 | 1.5 ± 0.3 |
| GalNAc | 0 | 0 | 0 |
| Total mass of monosaccharides (ng) | 73 ± 3.4 | ||
| % glycans in glycoprotein | 3.6 ± 0.2 |
150 kDa is used as mAb molecular mass.
Uncertainty is calculated at 95% confidence level (N = 6).
A degree of glycosylation for an antibody is commonly expected to be very low due to the large molecular weight of such antibodies and the limited number of glycosylation sites. This was the case of the mAb analyzed here. As listed in Table 1, the amount of oligosaccharide found on this mAb is only 3.6% w/w.
Thus far, the monosaccharide compositional analysis suggested the presence of fucosylated bi- and triantennary glycans. Some of these structures were possibly sialylated with NeuGc. Moreover, some of these structures are also incomplete and could lack terminal galactose residues or an antenna. Next, CE-LIF and MALDI-MS profiling was performed which was expected to furnish additional information that could aid in the comprehensive characterization of the N-glycans attached to the mAb under investigation.
3.2 Structural analysis of N-glycans
3.2.1 CE-LIF N-glycans profile
Our commonly employed N-glycan characterization approach involves CE-LIF and/or MALDI-TOF-MS profiling to attain information on the oligosaccharide structures existing within a glycoprotein. This approach furnishes valuable qualitative and quantitative data on the different glycan structures associated with the analyzed sample. A moderate microheterogeneity of typical glycan structures associated with the antibodies similar to the one investigated here adds to the practicality of this approach.
CE-LIF electropherograms of standard oligosaccharides and N-glycans derived from the mAb investigated here are depicted in Figs. 2a and b, respectively. The CE-LIF trace (Fig. 2a) of the labeled standards (core-fucosylated biantennary asialylated, and mono- and disialylated glycans) illustrates the ability of this technique to separate structural isomers. Monosialylated structures which differ only in the attachment of a terminal sialic acid residue to 1–6 or 1–3 antenna were partially resolved by CE-LIF analysis (see Fig. 2a). The CE-LIF analysis of N-glycans derived from mAb revealed the presence of seven major components (numerically labeled in Fig. 2b) in addition to many minor components. Based on comparing these two profiles, and while considering the monosaccharide data and the previous knowledge of the N-glycans observed in mAb, it is possible to conclude that the glycans attached to this mAb are mainly complete core-fucosylated biantennary structures and partially incomplete core-fucosylated biantennary structures lacking either some monosaccharide moieties, or one antenna, or both antennas. Moreover, the peak areas of the seven major components observed in Fig. 2b (and their migration times) suggested that 70% of the glycans associated with this mAb are not sialylated, while the other 30% are sialylated to various degrees. These findings complement the monosaccharide analysis. The relative abundances of the major components observed in Fig. 2b are listed in Table 2. It is also apparent from this table that the most abundant structure for this mAb is peak 4, which from its migration time and comparison to the standard CE trace is expected to be a core-fucosylated biantennary glycan lacking both terminal galactose residues.
Figure 2.
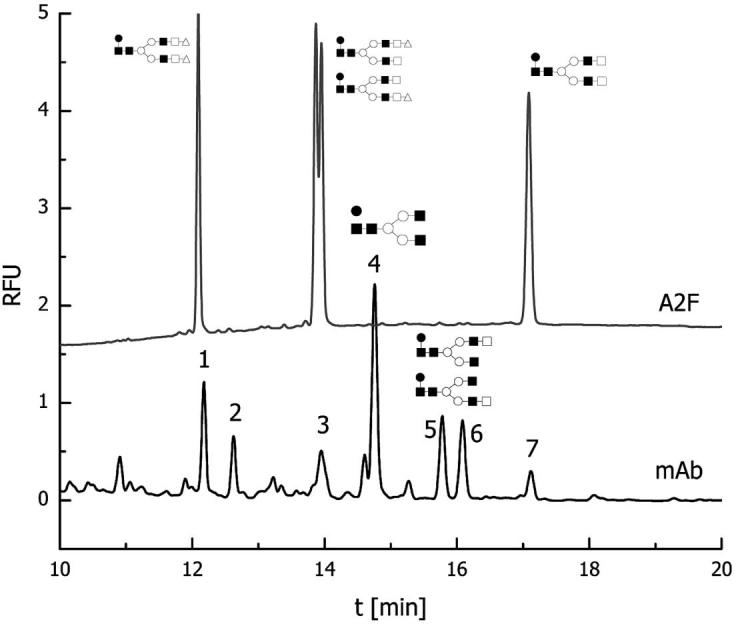
CE profile of APTS-labeled glycans derived from mAb. The upper trace represents standard core-fucosylated biantennary/disialylated, monosialylated, and asialylated glycans. Conditions: column, polyacrylamide-coated 50/365 μm ID/OD; length, 50.5 cm total, 40.5 cm effective length; temperature, 25°C; injection pressure, 0.5 psi for 5.0 s; voltage, 15 kV anodic electroosmotic flow; λex 488 nm, λem 520.
Table 2.
Relative abundance of N-glycans based on CE-LIF profile
| Peak | Normalized % relative abundance |
|---|---|
| 1 | 12.9 ± 1.1 |
| 2 | 8.1 ± 0.5 |
| 3 | 10.7 ± 1.8 |
| 4 | 35.2 ± 3.1 |
| 5 | 13.7 ± 1.1 |
| 6 | 13.9 ± 1.3 |
| 7 | 5.5 ± 1.2 |
Uncertainty is calculated at 95% confidence level (N = 3).
Although the structures were associated with the peaks in the CE-LIF electropherogram, it was not possible to draw a conclusion about a presence or absence of triantennary glycans whose occurance was suggested by the monosaccharide data. Moreover, CE-LIF data did not provide any information pertaining to linkages and branching because of the lack of appropriate standardsa. Accordingly, the use of other techniques, such as MALDI-TOF-MS in conjunction with enzymatic digestion, was needed to attain a complete characterization of all N-glycans.
3.2.2 MALDI-TOF negative ion mode profiling
The negative-ion mode MALDI-TOF-MS spectrum of mAb treated with PNGase F is shown in Fig. 3. Five major sialylated ions were identified in the spectrum with m/z values of 1729.0, 1932.8, 2093.8, 2255.8, and 2401.3. The m/z value of 3073.4 matches that of a triantennary trisialylated structure which is present here only at a trace level. Tentative structures of the major glycans observed in Fig. 3 are included in the figure, based on matching the m/z values. Moreover, using a larger amount of the antibody allowed detection of additional peaks in the m/z range of 2700–3000 (see inset of Fig. 3). All observed m/z values and their matching structures are summarized in Table 3. It should be noted that the sialic acid residues were of the NeuGc type, as was previously found in rodents [33]. This mAb was raised in a murine cell culture and, with the shift in the migration time of the peak corresponding to sialic acid residue in the monosaccharide compositional analysis (shown above), the data indicate NeuGc.
Figure 3.
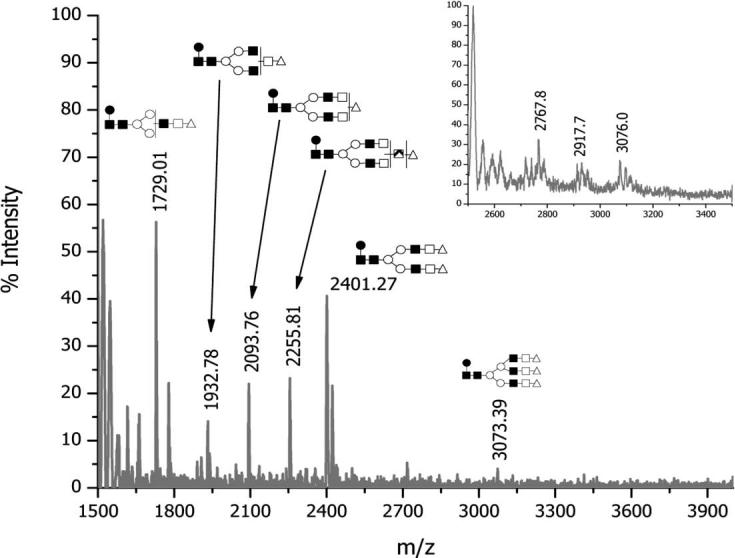
MALDI-TOF spectrum of N-glycans released from mAb; negative ion mode. The inset represents a mass spectrum acquired while setting the ion-gate cutoff at 2000.
Table 3.
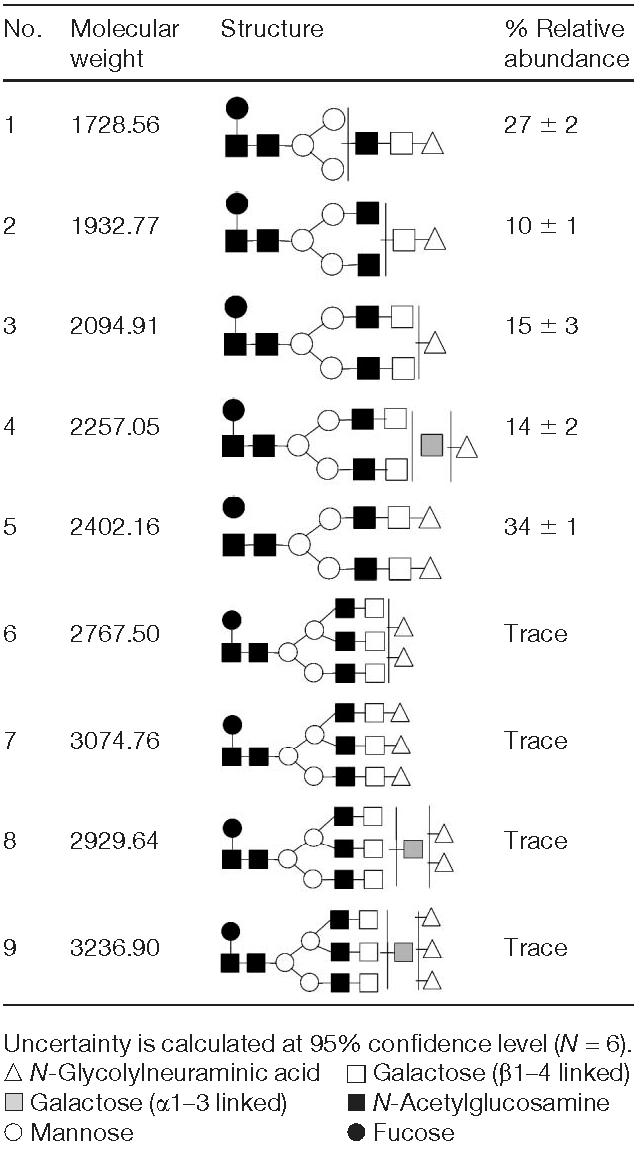
Structures of sialylated N-glycans determined in mAb
The structures included in Fig. 3 and Table 3 were further confirmed by employing our standard enzymatic sequencing (see Section 2.2.4 for details). Enzymatic sequencing indicated that all fucose residues were attached to the pentasaccharide core with an α1–6 linkage (data not shown). Enzymatic sequencing confirmed that most galactose residues were β1–4 linked. Those structures possessing additional galactose residues had terminal α1–3 linked galactose residues (data not shown). Although the α1–3 linked galactose residue of the glycans is known to be terminal in any glycan structures, they are depicted in Table 3 to reflect the uncertainty of antenna attachment and not the possibility of their attachment to a sialic acid residue. Relative abundances of the most intense ions are also listed in Table 3. According to these data, the fucosylated monosialylated bianntennary structure lacking an antenna and a fucosylated disialylated bianntennary were the most abundant among all sialylated structures derived from mAb. Relative abundances only reflect those of sialylated structures and do not account for asialylated entities.
3.2.3 MALDI-TOF positive ion mode profiling
The positive ion mode MALDI-TOF-MS spectrum of mAb treated with PNGase F is shown in Fig. 4. In this spectrum, it was possible to recognize five major structures with m/z values of 1283.6, 1446.4, 1487.6, 1649.9, and 1812.6. A minor structure at m/z 1977.4 was observed, corresponding to a fucosylated biantennary with and extra galactose residue linked via α1–3 glycosidic bond. Tentative structures of the glycans listed in Fig. 4 and Table 4 were further confirmed through the enzymatic sequencing. The relative abundances of the observed structures are summarized in Table 4. As already mentioned for the case of sialylated structures, the relative abundances only reflect those of asialylated moieties and do not account for sialylated structures. In this case, among the asialylated structures, a core-fucosylated biantennary structure lacking terminal galactose residues was the most abundant. Interestingly, no asialylated triantennary structures were observed in Fig. 4, thus indicating that all triantennary structures attached to this mAb were sialylated.
Figure 4.
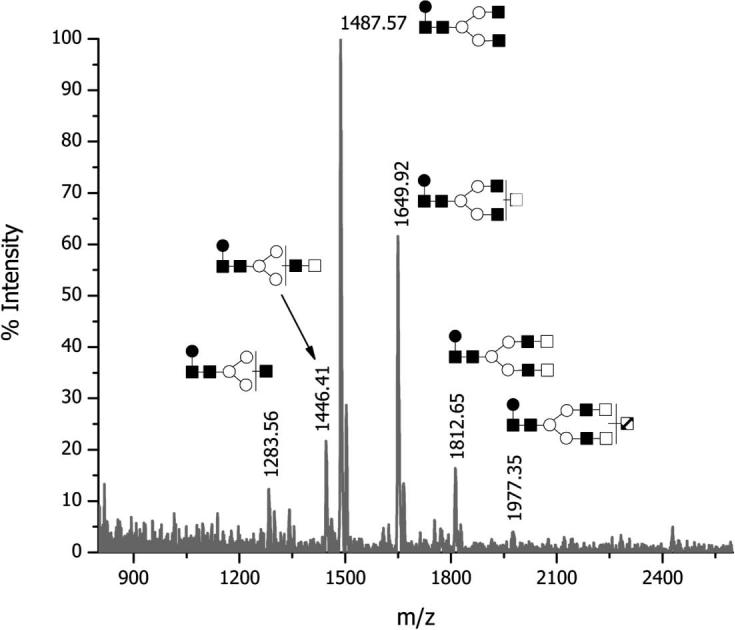
MALDI-TOF spectrum of N-glycans released from mAb; positive ion mode.
Table 4.
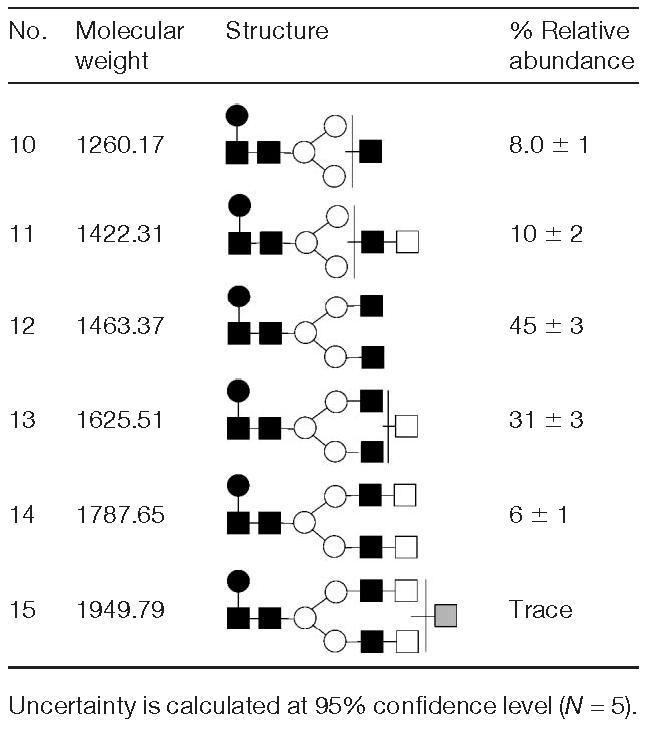
Asialylated N-glycan structures determined in mAb
Although our MALDI-MS data do not permit the abundance comparison between sialylated and asialylated structures, this comparison can be readily obtained from the CE-LIF electropherogram. Accordingly, among all N-glycans derived from mAb, core-fucosylated biantennary structure lacking terminal galactose residues was the most abundant oligosaccharide followed by the core-fucosylated biantennary disialylated structure.
3.2.4 Sites of glycosylation and microheterogeneity
It is a most common practice that glycosylation of a particular protein is investigated through a chemical or enzymatic release of glycans and their subsequent characterization, such as sequencing and linkage analysis. While this information is significant, there are additional structural aspects that must be addressed. For each site of glycosylation, there are possible structural variations, including the extent of substitution, site-specific microheterogeneities, site-specific accessibility for particular glycosyltransferases, which can all have important biochemical consequences. Investigating protein glycosylation at the level of glycopeptide is at least as important as the investigation of released glycan structures.
It is difficult to directly identify glycopeptides in a complex protein digest by MS. This is partly due to the low sensitivity for the detection of glycopeptides caused by site heterogeneity and/or ion adduct formation. Glycopeptide signals are often suppressed in the presence of other peptides, especially if the glycans are terminated with the negatively charged sialic acid moiety. Due to a glycan heterogeneity and a frequent multiple adduct formation, the overall glycopeptide signal distributes into several peaks, resulting in weak signals detected by MS. Consequently, it appears necessary to use multiple analytical techniques, either in parallel, or sequentially. Interfacing MS with different separation techniques is particularly appealing, as this strategy offers the combination of orthogonal principles. In this context, microcolumn liquid chromatography (μLC) is exceptionally attractive due to a low sample reguirement, different selectivity modes, and high separation efficiency.
The most effective approach for the analysis of glycosylation sites is based on the use of μLC and ESI-MS. The method involves observation of the diagnostic sugar oxonium ion fragments, particularly the HexNAc1 fragment at m/z 204, originating from collisionally excited glycopeptides (Hex = hexose). Such determinations can be performed on a single- or a triple-quadrupole mass spectrometer equipped with an ESI source and, more recently, on Q-TOF mass spectrometer [34-36].
The sites of glycosylation and their microheterogeneity in this study were assessed using Q-TOF-MS. This analysis revealed the presence of two sites of glycosylation associated with this glycoprotein as was revealed by LC-MS/MS analysis (Fig. 5). One site was associated with the conserved domain of the mAb, while the other was on the variable domain. As mentioned previously, only monosialylated structures have been commonly associated with the glycan structures of the conserved domain. This fact was also true for the mAb under investigation. Asialylated and monosialylated glycans were only associated with this site of glycosylation. The sialylation of the glycan structures present on the Fc region glycosylation site is evident from Fig. 6. Three glycopeptides are depicted in Fig. 6 for which the charge states and MS/MS experiments are illustrated in the insets. The depicted glycopeptides are triply charged and their tandem mass spectra reveal the presence of ions at m/z values of 204, 290, 308, and 366, corresponding to GlcNAc, NeuGc-H2O, NeuGc, and Gal-GlcNAc oxonium ions, respectively. In addition, peptide backbone with only GlcNAc and GlcNAc-Fuc is observed in the spectrum of each glycopeptides. Accordingly, the sialylation of the N-glycans attached to the Fc region glycosylation site is evident from Fig. 6 together with the presence of Fuc residue on the reducing-end GlcNAc residue, which we have also concluded through the enzymatic treatment.
Figure 5.
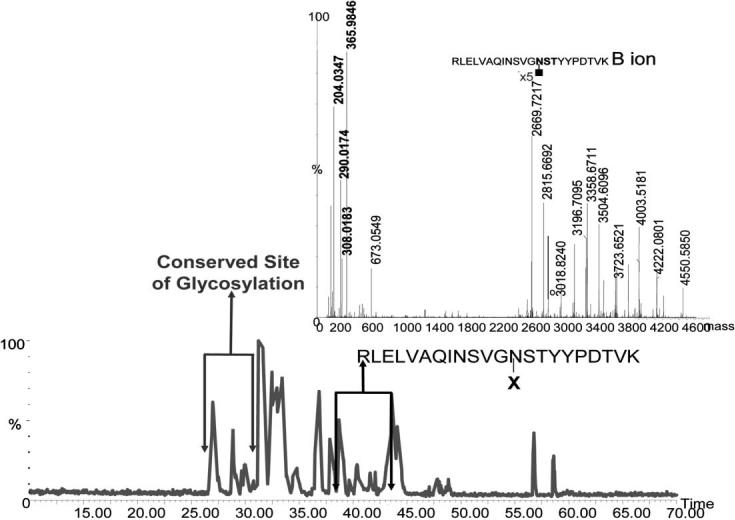
Base peak intensity chromatogram of tryptically digested mAb. Inset, MS/MS spectrum of a glycopeptide in which the glycan-diagnostic product ions with m/z values of 204, 290, 308, and 366 are depicted with blue lines. The signal labeled in the inset represent the B ion of this glycopeptide resulting from the loss of all monosaccharides residues, except the GlcNAc residue attached to the peptide backbone. This ion is commonly the most intense ion observed in the tandem MS spectrum of a glycopeptide.
Figure 6.

MS spectrum of sialylated glycopeptides associated with the Fc region of the antibody. The lower inset represent the charge state of different glycopeptides, while the upper inset represent the tandem MS spectra of each of the glycopeptides. Structures of the glycan attached to the peptide backbones are represented by the following symbols: (■) GlcNAc; ([unk]) fucose; ([unk]) mannose; (□) galactose; (▲) N-acetylglycolylneuraminic acid.
All the other sialylated structures were solely associated with the glycosylation site of the variable domain. The inset of Fig. 5 depicts an MS/MS spectrum of a glycopeptide possessing a sialylated structure. It should be noted that the ions at m/z values of 204, 290, 308, and 366 correspond to GlcNAc, NeuGc-H2O, NeuGc, and Gal-GlcNAc oxonium ions, respectively. The most intense ion observed at high m/z values is that of the peptide backbone with one GlcNAc residue attached. This ion is known as the B ions. All ions preceeding the B ions result from the loss of one or more sugar residues (i.e., the ion at 2815.6692 is that of the peptide backbone with GlcNAc and Fuc attached to it, while another at 3018.8240 is corresponding to the peptide backbone with GlcNAc, Fuc and GlcNAc attached). The detection of NeuGc is expected from the cellular source of this mAb. The selective ion-extracted chromatograms of the different glycopeptides are depicted in Fig. 7. Seven sialylated structures are associated with the variable site of glycosylation, as suggested by the data presented in Fig. 7. Moreover, the microheterogeneities of both glycosylation sites of this monoclonal antibody are summarized in Table 5.
Figure 7.

Selective ion extraction chromatograms of the glycopeptides associated with the variable region. The structures of the different glycan attached to this glycosylation site are represented by the same symbols as in Fig. 6.
Table 5.
Microheterogeneity of the glycosylation sites
| Structurea) | Variable region | Preserved region |
|---|---|---|
| 1 | √ | |
| 2 | √ | |
| 3 | √ | √ |
| 4 | √ | |
| 5 | √ | |
| 6 | √ | |
| 7 | √ | |
| 8 | √ | |
| 9 | √ | |
| 10 | √ | |
| 11 | √ | |
| 12 | √ | |
| 13 | √ | |
| 14 | √ | |
| 15 |
4 Concluding remarks
Through the use of highly sensitive and efficient analytical techniques, we have been able to demonstrate assessment of mAb (IgGk) glycosylation using, in total, less than 20 μg of glycoprotein. Glycosylation was determined at two sites, one residing in the conserved domain, the other in the variable domain. The microheterogeneity of the two sites was found to be different. Only core-fucosylated, monosialylated biantennary structure was common at both sites. The site of glycosylation in the conserved domain featured core-fucosylated biantennary, which was mainly asialylated. Some structures lacked one or both terminal galactose residues, while others lacked one or both antennas. The monosialylated structures were only associated with the site of glycosylation residing in the conserved domain. N-Glycolylneuraminic acid residue was the acidic moiety associated with all sialylated glycan structures derived from the sample. Qualitative and quantitative data were acquired through MALDI-MS and CE-LIF. Among the sialylated structures, a core-fucosylated biantennary disialylated structure was the most abundant species, while core-fucosylated biantennary lacking both terminal galactose residues was the most abundant among asialylated structures. The latter was also concluded to be the most abundant among all structures (sialylated and asialylated), as supported by the CE-LIF data. The low microheterogeneity of glycans derived from the sample permitted the assignment of the structures to the peaks observed in CE-LIF. Trace levels of the glycan structures with terminal 1–3 linked galactose residues were also observed. In addition, the high resolution of the CE technique permitted a baseline separation of the core-fucosylated biantennary structures with one terminal galactose residue attached to a (1–6)- or (1–3)-linked antenna. These structures were in almost equal abundance.
Although the multimethodological approach to the structural assessment in this work deals with a particular recombinant glycoprotein, it is generally applicable to high-sensitivity structural investigations of any proteins isolated through conventional chromatographic and gel-based techniques.
Acknowledgments
This work was supported by Inproteo (Indianapolis, IN, USA) (formerly, Indiana Proteomics Consortium) and partially by Grant No. (GM24349) from the National Institute of General Medical Sciences, U.S. Department of Health and Human Services. We thank Drs. Rick Ludwig, John Hale, and Mr. Michael Knierman, Eli Lilly and Company, (Indianapolis, IN, USA) for the antibody sample and their interest in our research activities.
Abbreviations
- APTS
8-aminopyrene-1,3,6-trisulfonate
- GalNAc
N-acetylgalactosamine
- GlcNAc
N-acetylglucosamine
- IgG
immunoglobulin G
- MAb
monoclonal antibody
- NeuGc
N-glycolylneuraminic acid
5 References
- 1.Drew J. Science. 2000;287:1960–1964. doi: 10.1126/science.287.5460.1960. [DOI] [PubMed] [Google Scholar]
- 2.Drew J. Drug Discovery Today. 2003;8:411–420. doi: 10.1016/s1359-6446(03)02690-4. [DOI] [PubMed] [Google Scholar]
- 3.Patel T, Parekh R, Moellering B, Prior C. Biochem. J. 1992;285:839–845. doi: 10.1042/bj2850839. [DOI] [PMC free article] [PubMed] [Google Scholar]
- 4.Parekh RB, Dwek RA, Sutton BJ, Fernandes DL, Leung A, Stanworth D, Rademacher TW, Mizuochi T, Taniguchi T, Matsuta K, Takeuchi F, Nagano Y, Miyanato T, Kotata A. Nature. 1985;316:452–457. doi: 10.1038/316452a0. [DOI] [PubMed] [Google Scholar]
- 5.Rasmussen JR. Curr. Opin. Struct. Biol. 1992;2:682–686. [Google Scholar]
- 6.Lis H, Sharon N. Eur. J. Biochem. 1993;218:1–27. doi: 10.1111/j.1432-1033.1993.tb18347.x. [DOI] [PubMed] [Google Scholar]
- 7.Varki A. Glycobiology. 1993;3:97–130. doi: 10.1093/glycob/3.2.97. [DOI] [PMC free article] [PubMed] [Google Scholar]
- 8.Winkelhake JL. Immunochemistry. 1978;15:695–714. doi: 10.1016/0161-5890(78)90044-5. [DOI] [PubMed] [Google Scholar]
- 9.Rademacher TW, Parekh RB, Dwek RA. Glycobiology. 1988;57:785–838. doi: 10.1146/annurev.bi.57.070188.004033. [DOI] [PubMed] [Google Scholar]
- 10.Tsuchiya N, Endo T, Matsuta K, Yoshinoya S, Aikawa T, Kosuge E, Takeuchi F, Miyamoto S, Kobata A. J. Rheumatol. 1989;16:285–290. [PubMed] [Google Scholar]
- 11.Wright A, Morrison S. Trends Biotechnol. 1997;15:26–32. doi: 10.1016/S0167-7799(96)10062-7. [DOI] [PubMed] [Google Scholar]
- 12.Mechref Y, Novotny MV. Chem. Rev. 2002;102:321–369. doi: 10.1021/cr0103017. [DOI] [PubMed] [Google Scholar]
- 13.Hellerqvist CG. Methods Enzymol. 1990;193:554–573. doi: 10.1016/0076-6879(90)93438-q. [DOI] [PubMed] [Google Scholar]
- 14.Gillece-Castro BE, Burlingame AL. Methods Enzymol. 1990;193:689–712. doi: 10.1016/0076-6879(90)93445-q. [DOI] [PubMed] [Google Scholar]
- 15.Harvey DJ, Bateman RH, Green MR. J. Mass Spectrom. 1997;32:167–187. doi: 10.1002/(SICI)1096-9888(199702)32:2<167::AID-JMS472>3.0.CO;2-Q. [DOI] [PubMed] [Google Scholar]
- 16.Viseux N, de Hoffmann E, Domon B. Anal. Chem. 1998;70:4951–4959. doi: 10.1021/ac980443+. [DOI] [PubMed] [Google Scholar]
- 17.Sheeley DM, Reinhold VN. Anal. Chem. 1998;70:3053–3059. doi: 10.1021/ac9713058. [DOI] [PubMed] [Google Scholar]
- 18.von Seggern CE, Zarek PE, Cotter RJ. Anal. Chem. 2003;75:6523–6530. doi: 10.1021/ac0348367. [DOI] [PubMed] [Google Scholar]
- 19.Mechref Y, Novotny MV, Krishnan C. Anal. Chem. 2003;75:4895–4903. doi: 10.1021/ac0341968. [DOI] [PubMed] [Google Scholar]
- 20.Mechref Y, Novotny MV. Anal. Chem. 1998;70:455–463. doi: 10.1021/ac970947s. [DOI] [PubMed] [Google Scholar]
- 21.Bigge JC, Patel TP, Bruce JA, Coulding PN, Charles SM, Parekh RB. Anal. Biochem. 1995;230:229–238. doi: 10.1006/abio.1995.1468. [DOI] [PubMed] [Google Scholar]
- 22.Anumula KR. Anal. Biochem. 2000;283:17–26. doi: 10.1006/abio.2000.4645. [DOI] [PubMed] [Google Scholar]
- 23.Hase S, Hara S, Matsushima Y. J. Biochem (Tokyo) 1979;85:217–220. doi: 10.1093/oxfordjournals.jbchem.a132314. [DOI] [PubMed] [Google Scholar]
- 24.Evangelista RA, Liu M-S, Chen F-TA. Anal. Chem. 1995;67:2239–2245. [Google Scholar]
- 25.Chen F-TA, Evangelista RA. Anal. Biochem. 1995;230:273–280. doi: 10.1006/abio.1995.1474. [DOI] [PubMed] [Google Scholar]
- 26.Hjertén S. J. Chromatogr. 1985;347:191–198. [Google Scholar]
- 27.Cifuentes A, Canalejas P, Diez-Masa JC. J. Chromatogr. A. 1999;830:423–438. doi: 10.1016/s0021-9673(98)00875-9. [DOI] [PubMed] [Google Scholar]
- 28.Mechref Y, Novotny MV. J. Am. Soc. Mass Spectrom. 1998;9:1293–1302. doi: 10.1016/S1044-0305(98)00106-8. [DOI] [PubMed] [Google Scholar]
- 29.Hounsell EF, Davies MJ, Smith KD. In: Protein Protocols Handbook. Walker JM, editor. Humana Press; Totowa, NJ: 2002. pp. 809–810. [Google Scholar]
- 30.Hounsell EF, Davies MJ, Smith KD. In: Protein Protocols Handbook. Walker JM, editor. Humana Press; Totowa, NJ: 2002. pp. 805–807. [Google Scholar]
- 31.Honda S. Methods Mol. Biol. 2003;213:81–92. doi: 10.1385/1-59259-294-5:81. [DOI] [PubMed] [Google Scholar]
- 32.Jefferis R. Biotechnol. Progr. 2005 in press. [Google Scholar]
- 33.Kawano T, Koyama S, Takematsu H, Kozutsumi Y, Kawasaki H, Kawashima S, Kawasaki T, Suzuki A. J. Biol. Chem. 1995;270:16458–16463. doi: 10.1074/jbc.270.27.16458. [DOI] [PubMed] [Google Scholar]
- 34.Carr SA, Huddleston MJ, Bean MF. Prot. Sci. 1993;2:183–196. doi: 10.1002/pro.5560020207. [DOI] [PMC free article] [PubMed] [Google Scholar]
- 35.Huddleston MJ, Bean MF, Carr SA. Anal. Chem. 1993;65:877–884. doi: 10.1021/ac00055a009. [DOI] [PubMed] [Google Scholar]
- 36.Koller A, Khandurina J, Li J, Kreps J, Schieltz D, Guttman A. Electrophoresis. 2004;25:2003–2009. doi: 10.1002/elps.200305837. [DOI] [PubMed] [Google Scholar]