


Abstract
Two collections of oligonucleotides have been designed for preparing pangenomic human and mouse microarrays. A total of 148 993 and 121 703 oligonucleotides were designed against human and mouse transcripts. Quality scores were created in order to select 25 342 human and 24 109 mouse oligonucleotides. They correspond to: (i) a BLAST-specificity score; (ii) the number of expressed sequence tags matching each probe; (iii) the distance to the 3′ end of the target mRNA. Scores were also used to compare in silico the two microarrays with commercial microarrays. The sets described here, called RNG/MRC collections, appear at least as specific and sensitive as those from the commercial platforms. The RNG/MRC collections have now been used by an Anglo-French consortium to distribute more than 3500 microarrays to the academic community. Ad hoc identification of tissue-specific transcripts and a ∼80% correlation with hybridizations performed on Affymetrix GeneChip™ suggest that the RNG/MRC microarrays perform well. This work provides a comprehensive open resource for investigators working on human and mouse transcriptomes, as well as a generic method to generate new microarray collections in other organisms. All information related to these probes, as well as additional information about commercial microarrays have been stored in a freely-accessible database called MEDIANTE.
INTRODUCTION
Microarray technologies for expression profiling may be split into two broad categories, platforms that are based on in situ synthesis of oligonucleotide probes and those that are based of the deposition of preassembled DNA probes. The first class of array platforms is dominated by the commercial sector with a number of companies, e.g. Affymetrix (1), Nimblegen (2), Agilent (3), offering a range of off-the-shelf or custom arrays to their customers. Microarrays fabricated using preassembled probes have traditionally been favoured by many academic laboratories and are also available from a number of commercial sources e.g. GE Healthcare's Codelink platform (4), Illumina's ‘BeadChip’ arrays (5). Primarily for reasons of flexibility and cost, many academic laboratories still favour the use of spotted arrays made in-house for their research.
For a number of years the fabrication of spotted microarrays largely relied on the attachment of gene fragments amplified from cDNA libraries (6). Whilst this approach clearly works and can provide useable tools for expression analysis, it suffers from several fundamental limitations: gene representation within cDNA libraries is incomplete; there is often a significant degree of redundancy within clone collections; annotation of clones can be flawed and cDNA libraries often come with legal restrictions on their distribution and use. Furthermore, the relatively large size of the cDNA amplicons can be associated with the presence of repeat sequences or homology to related genes, which can compromise the specificity of the probes in an unpredictable way (7). An alternative approach that addresses this issue involves the production of gene-specific DNA fragments by PCR amplification using specific primers (8–10). Existence of a significant fraction of genes where a specific PCR amplicon cannot be designed or generated, as well as the high costs and technical difficulty of DNA production, makes this approach impractical for the fabrication of mammalian whole genome expression microarrays.
An alternative approach for probe synthesis for spotted microarray production has come through the use of long (50–70mers) oligonucleotides (11,12). A significant reduction in the cost of production of the synthetic oligonucleotides, an improvement of the quality control provided by the different suppliers and the ability to design one or several specific probes to any given target sequence, has made the use of long oligonucleotides for the fabrication of microarrays a very attractive option. As a result, the last few years have seen a number of companies offering aliquots of oligonucleotide libraries for array fabrication. Transcript coverage has then increasing alongside our knowledge of transcript diversity. However, these sets have been relatively expensive to purchase and the small aliquots provided can severely limit the utility of the resource. In addition, though less of an issue now, the design criteria and the sequence of the oligonucleotides often remained proprietary. Finally, the use of a diverse range of probe sets by different laboratories has made comparison of data between groups difficult (13–19).
In order to address the need for improved access and standardization of microarray resources within the academic biomedical research community, a programme to develop long-oligonucleotide resources for every human and mouse gene was created. Specifically, a collaboration was launched between the French Genopole Network (RNG), a consortium of French laboratories involved in functional genomics, and the Microarray Programme of the MRC Rosalind Franklin Centre for Genomics Research, which had a remit to provide spotted microarrays for human and mouse expression analysis to the UK academic community. The primary objective of the project was to develop an open-access probe resource that would support the fabrication of high quality cost effective microarrays in UK and French academic laboratories. To ensure that probe design was open, dynamic and that annotation of the resources was kept up to date and available to the wider community, the creation of ad hoc bioinformatics tools was also central to the project.
Here we describe the bioinformatic pipeline that has been used in the design of two pangenomic oligonucleotide collections for study the expression profiling of human and mouse systems. This includes in silico validation steps and benchmark comparisons with commercial human and mouse oligonucleotide probe collections, and the creation of an open-access database called MEDIANTE, which integrates information about the RNG/MRC, Affymetrix, Agilent and Illumina probe sets. Lastly, we present experimental validation data obtained after hybridizing distinct RNAs originating from human or mouse tissues on microarrays spotted with the RNG/MRC probe collections.
MATERIALS AND METHODS
Oligonucleotide design
Transcript selection
Two non-redundant sets of mRNA sequences (one for human and one for mouse) were assembled from RefSeq, a database derived from GenBank. These were subjected to BLAST sequence analysis (20) against UniGene. Out of the 105 680 representative sequences from human UniGene clusters (build #167), 87 386 did not match this first RefSeq selection (build #33 for human). When UniGene clusters corresponding to less than 4 sequences were excluded, there were 2979 UniGene clusters of more than 4 sequences associated with at least 1 RNA sequence, which did not match any RefSeq transcript. The representative RNA from each of these UniGene clusters was then introduced into the list of transcripts selected for oligo design. Sequences defined in Affymetrix and Agilent human microarray annotations were then compared to this second list in order to identify sequences which were not represented. Following this selection the final number of human transcripts selected for oligo design was 29 894. BLAT analyses (21) ensured that each sequence was correctly positioned on to the genome sequence. Similar analysis were performed for the mouse, based on RefSeq (build #32) and the 86 213 Unigene clusters (build #125) and resulted in the selection of 25 002 mouse transcripts.
Calculation of oligonucleotide probes
After transcript selection, OligoArray2.0 (22,23) was used to calculate probes. This software integrates BLAST analysis against a non-redundant set of sequences and probe secondary structure analyses (24). Oligonucleotide calculation parameters were set as follows: oligo length from 50 to 52mers; GC percentage from 40 to 60%; maximum distance to 3′ end of transcript less than 1500 bases; melting temperature from 84 to 94°C. OligoArray 2.0 selected probes with the lowest cross-hybridization, the absence of secondary structure and balanced the set of probes in terms of melting temperature. After the OligoArray2.0 calculation, all oligonucleotides matching with splice variants were grouped by transcript. Oligonucleotides containing five consecutive A, C, G or T's were discarded.
Sub-selection of an oligonucleotide library for synthesis
Following the calculation of all potential probes, there were approximately five oligos designed against each transcript. An automatic procedure was then set up to select the ‘optimal’ probe from these. To this end, three distinct criteria were integrated: (i) the specificity of the probe, (ii) the number of EST's matching the probe and (iii) the position of the probe from the 3′ end of the target transcript.
1. Specificity. Whilst a specificity analysis is integral to OligoArray, it was necessary to set up an additional specificity check outside the program in order to re-evaluate the design of the probe sets when new releases of Ensembl or RefSeq became available. To this end, each oligonucleotide was compared to three distinct BLAST formatted databases: the first database was composed of the 29 894 human transcripts selected for this study (or 25 002 mouse transcripts), the second database corresponded to the current release of RefSeq protein-encoding transcripts, and the third to the current Ensembl collections of transcripts. Evaluation of the specificity of each oligo probe against these three databases was adopted in order to minimize biases caused by the process of transcript selection. A perfect-match between a 50mer and the corresponding transcript is associated with a BLAST expect-value of ∼10−20. However, any 50mer can perfectly match more than one transcript, for instance when the probe sequence is shared by several splice variants, or when it matches distinct members of a same gene family. Furthermore, a 50mer can also match imperfectly other transcripts. In this case, the number of hits is not constant, but increases along with the BLAST expect-value. We set up a decimal score, called X_HYBRID, where the integer part depicts the Blast-specificity of the probe, and the decimal part depicts the number of Blast hits. In that context, the most specific probe available for a transcript will correspond to the one associated with the lowest X_HYBRID value. This definition is explained in detail in Figure 1, which shows the number of hits obtained for a 50mer at different levels of the BLAST expect-values. According to the definition of the X_HYBRID, oligonucleotides with no cross-hybridization at a BLAST expect-value equal to 1 have a X_HYBRID equal to 0. The higher the X_HYBRID score, the lower the specificity of the oligonucleotide. Table 1 shows the relationship existing between X_HYBRID scores and the number of matching nucleotides. Typically, oligonucleotides with X_HYBRID equal to 1,x (where x is any integer from 1 to 9) can match 16 consecutive bases with a homologous sequence, or 19 bases out of 20 (Table 1). Experimental data support the fact that such probes are still specific (data not shown). Oligos with a X_HYBRID value superior to 2.0 can perfectly match with sequences of more than 18 bases, but can also match 21 bases out of 22, or 27 bases out of 30. Most probes with X_HYBRID > 2 were removed from the final selection. In the rare cases where they were selected, this was only when no better probes were available for the corresponding transcript.
Figure 1.

Definition of the X_HYBRID specificity score. Typical picture of a probe specificity analysis, as available from the MEDIANTE interface (http://www.microarray.fr). Each column represents the number of BLAST hits in the MEDIANTE database (blue), Ensembl database (green), RefSeq database (red) for the BLAST expect-value indicated at bottom. The X_HYBRID score for a probe was calculated as the maximal x_hybrid scores among the three databases. Based on expect-values equal to 10, 1, 10−1, 10−2, 10−3, 10−4, 10−15, 10−20, a ‘rank’ was defined, ranging from 0 for an expect-value equal to 10 to 6 for an expect-value equal to 10−15. For instance, the oligonucleotide depicted in Figure 1 has an extra hit in RefSeq for an expect-value of 10−1, thus defining a rank equal to 2. The number of extra hits between the rank and the lowest expect-value is called delta (Δ). In the example shown in Figure 1, Δ is equal to 1. Δ is always kept in the interval from 1 to 9, meaning that when there are more than 9 extra hits, Δ is kept to 9. A x_hybrid score is defined for each BLAST database (i.e. MEDIANTE, RefSeq, Ensembl) as a decimal number, where the integer part corresponds to the rank, and the leftovers to Δ. The final X_HYBRID score for a probe is defined as the maximal x_hybrid score obtained against the 3 BLAST databases.
Table 1.
Relationship existing between the X_HYBRID scores and the number of matching nucleotides in Blast hits
| Number of Mismatchs | 0 | 1 | 2 | 3 | 4 |
|---|---|---|---|---|---|
| X_HYBRID = 0 | 14/14 | 17/18 | 20/22 | 23/26 | 26/30 |
| X_HYBRID = 1.x | 16/16 | 19/20 | 22/24 | 25/28 | 28/32 |
| X_HYBRID = 2.x | 18/18 | 21/22 | 24/26 | 27/30 | 30/34 |
| X_HYBRID = 3.x | 20/20 | 22/23 | 25/27 | 28/31 | 31/35 |
| X_HYBRID = 4.x | 21/21 | 24/25 | 27/29 | 30/33 | 33/37 |
| X_HYBRID = 5.x | 23/23 | 26/27 | 29/31 | 31/34 | 35/39 |
| X_HYBRID = 6.x | 41/41 | 44/45 | 47/49 | — | — |
For instance, a probe with a X_HYBRID score equal to 2.1 can match its BLAST hit by 18 identical bases out of 18 (no mismatch), or 21 out of 22 (one mismatch) or 24 out of 26 (two mismatches).
2. Comparison with expressed sequence tags. mRNA species derived from a single loci can vary in exon usage (splice variants) or the length of the 3′ end due to the use of alternative poly-adenylation sites (25). In order to select oligonucleotides that hybridized to the most invariant part of each transcript we counted the number of EST hits for each probe, as probes designed against alternatively spliced exons or 5′ end sequences are likely to hit fewer 3′ EST's. We used the LASSAP (26) implementation of BLAST to compare all oligos probes against dbEST databases (27). The number of EST's matching (95% identity) each oligonucleotide in the database (called EST_NUMBER) was counted. Additional information, such as the tissue of origin of the EST was also recorded. All information was stored in the MEDIANTE database. LASSAP has been optimized for such an intensive task, where 270 700 oligos had to be compared against 7 057 754 human and 4 688 047 mouse EST's.
3. ‘Optimal’ probe selection and synthesis. After having defined the X_HYBRID, EST_NUMBER and DIST_TO_3′ scores (the latter corresponding to the distance to the 3′ end of the transcript) for every couple of probe and transcript, selection of the ‘optimal’ human and mouse sets was performed using these three criteria. In order to select highly specific probes, the first criterion selected for each transcript the probes exhibiting the lowest X_HYBRID scores. The second criterion selected into this subset the probe(s) with the highest EST_NUMBER values. Probes from the first subset having an EST_NUMBER superior or equal to 60% of this maximal value were rescued and stored in a second subset (this cut-off is explained in Supplementary Figure 1). For each transcript, the optimal probe was defined as the most 3′ probe belonging to the second subset. After this first selection, which favours the selection of Blast-specific oligonucleotides, we checked whether probes characterized by an intermediate X_HYBRID score (X_HYBRID < 2) and by an EST_NUMBER score at least five times superior to the EST_NUMBER score of the selected probe, were available. This step allowed the selection of probes with minimal cross-hybridizations, but matching a much larger number of ESTs. Such situations may happen due to alternative splicing, leading to the existence of two transcripts with different levels of expression. Among such probes, the most 3′ sequence was selected.
For several transcripts, we selected several additional oligonucleotides to analyse the variations of the ratios and/or intensities between probes targeting a same transcript.
Based on these criteria a subset of 25 342 human and 24 109 mouse oligonucleotides were selected for synthesis. A total of 100 μmoles of each probe were ordered from Sigma–Proligo (Paris, FRANCE) as a 5′ amino modified oligonucleotide. Oligonucleotide stocks were aliquoted and distributed to participating laboratories for use in microarray fabrication.
Comparison of the probes sets with commercial probe sets
In order to compare our oligonucleotide selection with other probe collections, we performed an in silico comparison between the human and mouse RNG/MRC probe sets with probes present on Affymetrix (human U133Plus2 and mouse MG-U74), Agilent (HumanGenome and MouseGenome), and Illumina (Illumina_human and Oligator_MEEBO_mouse) microarrays. The analysis of the Affymetrix GeneChips probes was restricted to the first and last perfect-match probes of each probe set. Three comparisons were carried out, for each of the three scores: X_HYBRID, EST_NUMBER, and DIST_TO_3′. These comparisons took place within a subset of probes of 16 303 human and 13 073 mouse transcripts represented on all four microarray platforms. For each of the three commercial platforms the same approach was taken to calculate X_HYBRID, EST_NUMBER and DIST_TO_3′ scores for each probe.
However, a direct comparison of BLAST scores was not possible, due to the different lengths of the probes (25 bases for Affymetrix, 50 for RNG/MRC, 60 for Agilent and 70 for Illumina). Several analyses were therefore performed, where sub-sequences were randomly selected within RNG/MRC, Agilent and Illumina probes in order to generate BLAST queries of uniform length. Libraries of 25mers derived from RNG/MRC, Agilent and Illumina collections were constructed, as well as libraries of 50mers derived from Agilent and Illumina collections. In order to reduce the bias caused by the selection of ‘random’ 25mers, the procedure was independently repeated three times for each set, and these scores were only used for global descriptive statistics. The three independent measurements indeed led to the same results, therefore demonstrating that shortening the length of the probes had no impact on the results of our analyses.
Mediante web application
The development of the project has required the creation of a dedicated database, aimed at storing all oligonucleotide sequences. This database has been called MEDIANTE. MEDIANTE is a J2EE platform deployed under a Tomcat web server. It is based on a PostgreSQL relational database. This database contains annotations pertaining to transcripts and oligonucleotides in 45 distinct tables. Thirty additional tables are used to store the information about hybridizations (K. Le Brigand and P. Barbry, manuscript in preparation). The human and mouse RNG/MRC probe collections and all associated information can be directly downloaded from the MEDIANTE home page (http://www.microarray.fr). Subscription is managed by the French National Genopole™ Network, and provides access to some additional tools, such as customized selection of oligonucleotides, or storage of microarray data.
Probe update and evaluation
The current MEDIANTE database has now gone through six different iterations as updated versions of Ensembl, RefSeq and Unigene have been released (Supplementary Figure 2). Upon each new RefSeq release, an automatic process is launched in order to update the ‘optimal’ RNG/MRC oligonucleotide collections. This process integrates: (i) an update of transcripts with an altered sequence, (ii) the identification of transcripts absent from the current set, (iii) the design of new oligonucleotides and the construction of ad hoc relationships between all oligonucleotides and all transcripts, (iv) an update of the oligonucleotides ‘optimal’ selection. The aim of this automatic process is for each transcript to check whether the oligonucleotide currently selected is always the ‘optimal’ probe available. The whole process makes possible the re-use of collections of oligonucleotides that were selected in a previous version of the collections, with no need to re-calculate whole collections with OligoArray.
Annotation of the probe sets
Transcript annotations were derived from several public databases. All information is currently accessible and can also be freely downloaded within the framework of MEDIANTE. A search tool allows the user to browse according to GenBank accession numbers, LocusLink ID, Unigene ID, gene symbol, within sequence descriptors, exact Gene Ontology terms (28,29), chromosomal localization. Each query is built dynamically after collection of the information and is returned via a web form. The list of relevant transcripts is identified, and then visualized. An important feature is the publication of information about several commercial platforms (Affymetrix, Agilent and Illumina). BLAST analyses have been used to position all probes in the RNG/MRC and commercial sets on each transcript included in MEDIANTE. This makes it possible to compare probes belonging to any of these four distinct platforms (see Figure 5). This information appears particularly useful to highlight differences existing between probes from different platforms, especially when conflicting data are collected from different platforms or probes.
Personal project manager
One of the initial remits of MEDIANTE was to provide the possibility for a distant user to participate to the improvement of the oligonucleotide collection. A typical scenario corresponds to the selection of a subset of probes for specific transcripts, for instance to allow the design of bespoke microarrays. The user can either upload FASTA-formatted (30) sequences or query in MEDIANTE sequences of interest. When all sequences have been collected, the user can compare their sequences with all the oligonucleotides. This BLAST analysis allows the determination of oligonucleotides that match with the query sequences. A pre-selection of the ‘optimal’ probe is performed according to the method explained above, but the user can still change these parameters according to their preferred criteria. The selection of probes is very similar to a ‘shopping basket’, where the user collects progressively the list of probes needed for their project. At the end of the selection process, all information about the selected oligonucleotides and their associated annotation (transcript information, chromosomal localization, probe sequence, etc.) can be either downloaded, or stored in the database for subsequent analysis. This virtual microarray can also be transferred to another collaborator registered to MEDIANTE, so that several users can cross-check the selection of probes. This method has been very useful during the development of the RNG/MRC collection, and has then been used for creating a custom-made human microarray, which is currently used by several laboratories. Information about this microarray is also available on the entry page of MEDIANTE.
Experimental evaluation
Array preparation
Oligonucleotides were diluted to a final concentration of 35–50 μM in 35% dimethyl sulfoxide (DMSO), 100 mM potassium phosphate (pH 8.0). Pangenomic microarrays were printed using human RNG/MRC oligonucleotide collection with a ChipWriterProarrayer (Bio-Rad, 1000 Alfred Nobel Drive Hercules, CA) on commercial HydroGel slides (Schott, Hattenbergstr 10 55122 Mainz, Germany), and processed according to the manufacturer's instructions.
RNA labelling and hybridization
RNAs were labelled using an amplification protocol, as described in Moreilhon et al. (9). Briefly, 1 μg of total RNA was amplified with the Amino Allyl MessageAmp aRNA kit (Ambion, 2130 Woodward Austin TX) according to manufacturer's instructions. Cy3 and Cy5 labelled aRNA was fragmented with the Ambion aRNA Fragmentation Reagents, purified and made up in Agilent hybridization buffer. Labelled cRNAs were then hybridized to RNG/MRC human pangenomic microarrays in an oven at 62°C for 16 h. Microarrays were washed and scanned with a Genepix scanner (Axon Instruments, Molecular Devices Corporation 3280 Whipple Road Union City, CA). Hybridization of Affymetrix GeneChip™ was performed according to standard protocols, as suggested by the supplier.
Microarray analysis
TIF images containing the data from each fluorescence channel were quantified with the Genepix pro 5.0 program (Axon Instruments). Data were log-transformed, mean-centered and reduced for an equal standard deviation between each slide (Z-score), using the GeneANOVA software (31). Normalization was performed using the limma package available in Bioconductor (http://www.bioconductor.org). Tissue-specific probes were defined as probes with a Z-score superior to 100 times the average Z-scores in the other three conditions. Clustering was performed using Bioconductor (32,33) and TM4 (34). GeneChip One-Cycle Target Labeling (Affymetrix) and the recommended protocols from the Affymetrix Eukaryotic Sample Analysis Technical Manual, revision 5 (Affymetrix SOP) were used for the experiment shown on Figure 6.
RESULTS
Oligonucleotide design process
Statistics on RNG/MRC and several commercial probe collections are summarized in Table 2. The X_HYBRID score defines the specificity of the set. A total of 68.9% (17 457 probes) and 23.4% (5921) of the 25 342 RNG/MRC human probes have a X_HYBRID score equal to zero, or below 2, respectively. A total of 7.7% (1964 probes) have a X_HYBRID score above 2 indicating a possible cross-hybridization with other transcripts (as assessed by Blast analyses). They were nevertheless selected as no better probe could be identified. A very similar picture was obtained for the RNG/MRC mouse probes (24 109 probes) with 69.6% (16 767) probes with a X_HYBRID equal to zero, 23.1% (5563) probes with a X_HYBRID below 2, and 7.4% (1779) probes with a X_HYBRID above 2. Comparison of the probes with EST databases (dbESTs), demonstrated that the 25 342 oligonucleotides of the final human selection matched 1 282 376 distinct EST's (>95% identity). The 24 109 mouse probes collection matched 926 311 distinct EST's. On average, 53 EST's were hit by each human and 39 for each mouse probe.
Table 2.
Descriptive statistics for RNG/MRC, Affymetrix, Agilent and Illumina probe collections
| Human | Mouse | |||
|---|---|---|---|---|
| Probes | Transcripts | Probes | Transcripts | |
| Number of distinct RNG/MRC sequences | 148 993 | 29 894 | 121 703 | 26 058 |
| Number of distinct gene symbols | — | 21 043 | — | 22 740 |
| Total number of RNG/MRC probes | 25 342 | 29 894 | 24 109 | 25 002 |
| Number of RNG/MRC probes with x_hyb = 0 | 17 457 | — | 16 767 | — |
| Number of RNG/MRC probes with x_hyb = 1,x | 5921 | — | 5563 | — |
| Number of RNG/MRC probes with x_hyb > 1,y | 1964 | — | 1779 | — |
| Average EST_NUMBER per RNG/MRC probe | 53 | — | 39 | — |
| Average DIST_TO_3′score per RNG/MRC probe | 692 | — | 488 | — |
| Affymetrix U133Plus2 / MG-U74 | 108 371a | 27 588b | 89 502a | 20 624b |
| Agilent whole genome | 40 990 | 25 627b | 20 865 | 18 087b |
| Illumina human / MEEBO | 22 548 | 21 271b | 36 362 | 22 463b |
Oligonucleotides with X_HYBRID equal to 0 or to 1,x are considered ‘BLAST-specific’ probes; oligonucleotides with a X_HYBRID equal to x,y (x > 1) can possibly cross-hybridize with other transcripts. They were selected only when no better probe was available for a given transcript. For Affymetrix, comparison was performed for the first and last 25mer probes of each perfect-match Affymetrix probe sets (a probe set is specific to a gene and is composed of an average of ten 25mer probes). A total of 90% of the transcripts have a majority of their associated oligonucleotides characterized by a X_HYBRID score below 2. Less than 5% of the transcripts are only associated with oligonucleotides characterized by a X_HYBRID score above 2.
aOnly the first and last probes from each Affymetrix probe set were used for analysis.
bNumber of transcripts matched by probes from the RNG/MRC transcript selection set.
Probe update and evaluation
The current MEDIANTE database has now gone through six successive versions, as updates of Ensembl and RefSeq have been released. The fourth version of the human probes selection was used for the design of the synthetized human oligonucleotide collection, the so called RNG/MRC human probe set. Similarly, the second version of the mouse probes selection corresponds to the version used for the synthesis of the mouse collection, the so called RNG/MRC mouse probe set. Supplementary Figure 2 indicates the evolution of the probes collection during several successive versions of the databases.
Comparison of the probes sets with commercial probe sets
Comparison of the RNG/MRC probe sets with commercial platforms i.e. Affymetrix, Agilent and Illumina was performed on 16 303 human transcripts represented in all four collections of human probes and on 13 073 mouse transcripts represented in all four collections of mouse probes.
Figure 2 summarizes the comparison of the X_HYBRID scores between probes from RNG/MRC, Affymetrix, Agilent and Illumina platforms. As explained in the ‘Materials and Methods’ section, a direct comparison of the four platforms was not possible due to the different probe sizes used by the different platforms: from 25 bases (Affymetrix), 50 bases (RNG/MRC), 60 bases (Agilent) to 70 bases (Illumina). To circumvent this problem, three independent calculations were made with three randomly shortened probes, in order to work with BLAST queries of the same length between the different collections. Figure 2 values represent averages of the three resulting values. Figure 2B shows the percentage of probes with a X_HYBRID superior to 2 as a function of the length of the BLAST query, according to the source of the oligonucleotide. A total of 10–15% of the 148 993 human and of the 121 703 mouse oligonucleotides selected with OligoArray (entitled ALL in Figures 2–3) have a X_HYBRID score above 2. A similar percentage is observed for the oligonucleotides from Agilent and Illumina. This percentage decreases below 5% for the probes derived from the RNG/MRC or Affymetrix collections. A similar trend is observed in Figure 2A for the average X_HYBRID score of each set. Based on this in silico analysis the RNG/MRC probe resources would appear to be more specific than the two commercial long-oligonucleotide probe collections.
Figure 2.

Blast-specificities of the different probe collections. (A) Average X_HYBRID scores for the different human and mouse collections. (B) Percentage of probes in each set associated with a X_HYBRID above 2, i.e. less ‘BLAST-specific’. This comparison has been performed on a subset of 16,303 human and 13,073 mouse transcripts, common to all platforms. ALL represents the collection of all probes calculated with OligoArray2.0. RNG/MRC represents the selection of probes used for the fabrication of the microarrays.
Figure 3.

Matches with human and mouse EST databases for the different probe collections. (A) Average EST_NUMBER scores for the different human and mouse collections. (B) Percentage of probes matching no ESTs for All MEDIANTE probes, for the RNG/MRC, Agilent, Illumina and Affymetrix probe sets. For human, the comparison was performed on a subset of 7,325 transcripts having ‘BLAST-specific’ probes in all sets, i.e. X_HYBRID lower than 2.0. For mouse, the comparison was performed on a subset of 6,358 such transcripts. A matching EST was defined by a 95% identity between one probe and an EST.
Figure 3 summarizes the comparison of the EST_NUMBER scores among platforms. Figure 3B shows the percentage of probes in each set that do not match any ESTs. More than 12% of the 148 993 human and of the 121 703 mouse oligonucleotides selected with OligoArray (ALL) do not recognize any EST. A large difference can be noticed between the 5′ and 3′ oligonucleotides from Affymetrix. In that case, the difference in EST_NUMBER can clearly be explained by their relative distance to the 3′ end of the transcript (see also Figure 4). Figure 3A indicates the average EST_NUMBER score per set. As for the X_HYBRID score, we randomly shortened RNG/MRC, Agilent and Illumina probes to 25 bases, so that their size did not differ with the size of Affymetrix probes. This sampling was performed three times, and gave identical results (data not shown). While the average EST_NUMBER led to similar scores for all platforms, the RNG/MRC probes mapped to a slightly larger number of EST's in both human and mouse than the other platforms.
Figure 4.

Distribution of the probes according to their DIST_TO_3′ score. (A) human. (B) mouse. More than 90% of probes for the human sets and 98% of probes for the mouse sets are located within 1,500 bases from the 3′-end of target mRNAs. Legend indicates the average DIST_TO_3′ score for each collection. This comparison has been performed on a subset of 16,303 human and 13,073 mouse transcripts, common to all sets.
The position of the probe with regard to the 3′ end of the transcript, represented by the DIST_TO_3′ score, was then analysed. The distribution of the distance for the RNG/MRC probes and the three other sets is shown on Figure 4. As might be expected the Affymetrix probe sets show distinct peaks associated with the 5′ and 3′ oligonucleotides. Agilent, Illumina and the RNG/MRC probe collections display a similar pattern of distribution with the majority of probes being located within the 600 last base pairs of the 3′ region. of the target mRNA.
Experimental evaluation of the RNG/MRC oligonucleotides collection
Expression profiling of human cell types versus ‘electronic northern’
A first experimental evaluation of our selection of oligonucleotides was provided by a comparison of experimental data and in silico data (Supplementary Figure 3). For this purpose, we compared the results obtained after hybridization of 45 RNG/MRC microarrays with diverse human RNA originating from leucocytes (7 microarrays), nasal epithelial cells (22 microarrays), keratinocytes (4 microarrays) and liver (12 microarrays), in order to identify a set of tissue-specific transcripts, characterized by a strong differential expression between one tissue/cell type against the three others. A total of 481 oligonucleotides were selected by their high EST_NUMBER scores in at least one of the four studied tissues, and by a differential expression between the four tissues, as assessed by the results of the hybridizations on the RNG/MRC microarrays. Hierarchical clustering of these 481 probes revealed several tissue-specific clusters. Supplementary Figure 3 (left panel) shows a heat map of these 481 genes. A black signal is associated with a high level of expression, as measured by the intensity of the fluorescence. Annotations of the EST's (see Materials and Methods) was used to count the number of EST's from immune cells (Immune), respiratory tissues (Respiratory), skin (Skin) or liver (Liver) matching these 481 probes. Supplementary Figure 3 (right panel) shows a heat map derived from this analysis. Despite the fact that the samples analysed here are from similar but ultimately different biological sources, several similarities can be noticed between the two plots. This suggests some relationship between the intensity of the signal and the number of expressed transcripts.
Comparison of hybridizations on RNG/MRC microarrays versus hybridizations on Affymetrix GeneChip™
In order to directly evaluate expression profiles generated with the RNG/MRC microarrays, RNA derived from either HEK293 cells or a human cell line of keratinocytes (DK7) was analysed in parallel on the RNG/MRC platform, or on an Affymetrix platform. Figure 6 shows the relationship existing between ratios established with Affymetrix arrays (x-axis) and ratios established with RNG/MRC arrays (y-axis). When considering only the genes for which the average intensity of the signal was superior to the 25th percentile for both platforms, the coefficient of correlation between the two measurements was equal to 0.807. It was equal to 0.700 when all data points are considered, and raised to 0.880 when considering the genes for which the average intensity of the signal was superior to the 75th percentile for both platforms.
Independent validation of the probes
More than 3500 RNG/MRC microarrays have been already distributed to more than 100 distinct projects. A total of 4666 probes, targeting 4522 distinct transcripts, have been so far confirmed by independent measurements. More precisely, a probe was validated when a ratio above 2 was detected in an experiment using a RNG/MRC microarray and when an independent measurement (quantitative RT–PCR, other microarray platforms, northern blots, protein detection or functional assays) led to a similar variation (i.e. ratio above 2 for RNA detection, or increased protein expression, or increased activity). Such probes are listed in Supplementary Table 1. Validated probes are also flagged in the Mediante interface.
Validation of the EST_NUMBER and DIST_TO_3′ scores
For several transcripts, we selected distinct oligonucleotides to analyse the variations of the ratios and/or intensities between probes targeting a same transcript. In the experiment shown on Figure 6, 75% of such pairs of RNG/MRC probes were correlated (meaning that log2ratio[probe1] = log2ratio[probe2] ± 1). This suggests that our selection was indeed able to select probes with similar properties. We then anticipated that the 25% of the probes exhibiting divergent properties might shed some light on the relative importance of EST_NUMBER, distance to 3′ ends, or Tm (the latter being the most commonly accepted parameter for the selection of probes). In an independent mouse microarray experiment, we selected 34 such pairs of probes, characterized by at least a 2-fold variation in intensity. We wondered whether a positive difference in intensity could be attributed to: (i) a positive difference in EST_NUMBER, (ii) a negative difference in the DIST_TO_3′ and/or (iii) a positive difference in melting temperature of the probes. Figure 7 summarizes in a Venn diagram our results: 100% of such pairs of probes were correlated with either a variation in EST_NUMBER (24 transcripts), DIST_TO_3′ (30 transcripts) and/or Tm (14 transcripts). All information, as well as additional information about sequences, enthalpies, entropies of the probes are available in Supplementary Table 2.
DISCUSSION
The last 5 years have seen a significant increase in the accessibility and diversification of microarray platforms for performing expression analyses (35–39). In particular, the range of species for which commercial arrays are now available and the number of probe features per microarray have expanded dramatically due to improved sequence resources and technological advances in microarray fabrication. As a result, applications of microarray analysis to many fields of basic and biomedical research have dramatically increased (40–42). However, the cost of commercial arrays is still prohibitive for many large academic projects.
To address the problem of accessing affordable arrays, a number of academic communities have established centralized facilities for microarray fabrication (43). Much of the early work of these centers relied on the use of cDNA clone sets for generating probe resources for microarray fabrication. Incomplete gene coverage, inaccurate gene annotation, contaminated or missing clones, legal restrictions which were often associated with the use of cDNA libraries, made these resources non-optimal for microarray production. Furthermore, and perhaps most importantly, the large size of the DNA probe used for any given gene has a potential to cross-hybridize to other sequences, due to partial homology to other genes or presence of repeat sequences. The acceptance and availability of oligonucleotide probe resources for spotted microarray fabrication has provided a powerful alternative to the use of cDNAs (44–53). The first aim of our project was to provide an open probe resource for the fabrication of cost effective pangenomic microarrays to the Anglo-French communities. However, our work also addressed more general issues:
The development of an open-access repository for human and mouse probes usable in gene expression studies provides a useful tool to compare the position of the probes from several sources. Knowledge and comparison of these probes is crucial in assessing probe specificity and in performing cross-platform comparisons. While this part of our project has some similarities with the Resourcerer (54) and Dragon projects (55), the MEDIANTE web interface provides graphical representations of all probes associated with a specific transcript (Figure 5). Although limited at the moment to RNG/MRC, Agilent, Illumina and Affymetrix probe collections in human and mouse, this visualization tool will be extended in the near future to include other platforms and other organisms.
Whilst access to the RNG/MRC probe libraries and arrays fabricated from them may be restricted to the French and UK communities, the MEDIANTE interface provides an open-access portal to a detailed description of the probe sets. It also allows any end-users to select a preferred set of probes, according to some specific knowledge. With currently a selection of probes 148 993 human and 121 703 mouse transcripts precalculated in the database, MEDIANTE can easily be used to define probes against specific splice variants or subsets of genes. Thus the tool can be viewed as both a gene annotation tool and as a convenient tool to create dedicated microarrays.
The storage of hybridization data in a centralized data warehouse, integrated within MEDIANTE, will allow the integration of both probe and experimental information. Validation tools will allow fast quality control of the data and easy generation of a MIAME-compliant export format (56). As such, it will facilitate the transmission by end-users of their curated data to public repositories, such as GEO (57) or ArrayExpress (58), based on the MAGE-ML language (59). In addition, the ongoing production of human and mouse pangenomic microarrays using the RNG/MRC probe sets by groups funded by either the French ‘Réseau National Genopoles’ (RNG, French Genopole Network) or the UK Medical Research Council means that many are now essentially using the same probe resources for their work. This will clearly facilitate the construction of homogeneous large datasets available for Meta-analysis.
Figure 5.

MEDIANTE screenshot of the summary data for transcript NM_001652. The different exons of each transcript are represented by dark and light blue boxes. The RNG/MRC probes are represented on the first line; the light green box indicates the ‘current optimal probe’. The red box indicates the RNG/MRC probe(s). The blue box indicates a probe selected for a local microarray production. Each set of probes is represented on a distinct line. Affymetrix probe sets are represented by their first and last 25-mer perfect match probes. Additional information about the transcript or probes, such as gene chromosomal location, probe specificity, etc. are provided as clickable links. Subforms provide information about Gene Ontology annotations, bibliographic references or tissue-specificity.
The quality scores used in the current study provide a convenient way to evaluate probe design and compare between different sets of probes. Following on from the initial design of the ‘full’ set of probes generated by the OligoArray program, our probe selection procedure allowed for further refinement of the probe collection.
The X_HYBRID score represents a simplified output of BLAST analyses and its use integrates BLAST analyses performed on three distinct databases (MEDIANTE, RefSeq, Ensembl). This index has several interesting characteristics. First, it varies along with the BLAST score (the lower the X_HYBRID score is, the more ‘BLAST-specific’ a probe is). Secondly, visualization through MEDIANTE, according to the representation shown in Figure 1, integrates results from our three references databases, giving indications about variations of the annotations among databases.
A 2-fold enrichment in the number of ‘zero’ probes (i.e. probes having a X_HYBRID score equal to 0) was observed between the ‘ALL’ collection of probes generated by OligoArray and the selection of the optimal probe sets. In the same way, a 4-fold decrease in the number of probes having a X_HYBRID score greater than 2 was observed between the ‘ALL’ collection of probes generated by OligoArray and the selection of the optimal probe sets (see Figure 2B). This enrichment was similar in human and in mouse (data not shown). The presence of ‘low-specificity’ probes in the full collections of probes may appear surprising, since OligoArray supposedly rejects non-specific probe sequences. However, the presence of these probes may be due to: (i) an absence of high quality probes available for a given sequence, since OligoArray provides its ‘best’ available candidates, even though none may be entirely specific, (ii) the presence of new transcripts in more recent releases of RefSeq or Ensembl, which increases the X_HYBRID score of the probe, or (iii) the correction of previous versions of mRNA sequence due to sequencing error. In our hands, the X_HYBRID score allows a dynamic re-evaluation of a set of probes every time a new release of sequences is available. This makes possible the use of a collection of probes over numerous iterations (Supplementary Figure 2). This approach differs from the approach developed with programs such as OligoArray, where a re-calculation of new probes can lead to considerable disparity with older versions of a design. From that perspective, we consider that our approach simplifies the cycle of life of a probe collection. The X_HYBRID score was particularly helpful for comparing sets from several distinct microarray platforms. In human as well as in mouse, the RNG/MRC and Affymetrix probe sets were always associated with lower X_HYBRID scores than Agilent or Illumina probe sets.
The second criterion used to select probes corresponded to the EST_NUMBER. It was initially set up in order to avoid the selection of probes specific to rare or poorly expressed splice variants. As a direct count of the number of EST's associated with each probe, this index provided an easy measure of the relative sensitivity of each probe to detect its target. Comparison of the EST_NUMBER scores of RNG/MRC sets with commercial collections was also favourable to the RNG/MRC collections, in terms of the average number of EST identified per probe, and in terms of the number of probes matching no EST's (see Figure 3). With the availability of additional information about the tissue of origin of each, it was possible to divide the EST_NUMBER into 26 categories according to the libraries from which the EST's were sequenced (Brain, Eye, Heart, Muscle, Pancreas, Liver, Stomach, GI tract, Kidney, Bladder, Testis, Prostate, Respiratory, Otorhinolaryngology, Skin, Immune, Bone, Breast, Uterus, Ovary, Placenta, Stem cell, Embryo, Fibroblast, Adipose tissue and Cancer). The relative number of EST's in each category therefore provided an estimate of the abundance of the transcripts in the corresponding tissue, category or cell type. These values were used to draw Supplementary Figure 3. Supplementary Figure 1 indicates that EST_NUMBER might be linked to some extent to DIST_TO_3′. Our selection strategy indeed took into account the few cases where EST_NUMBER scores are not directly related to DIST_TO_3′.
The fact that 75% pairs of RNG/MRC probes targeting a same transcript (Figure 6) share similar levels of expression is a good indication of the quality of our design. Besides, the analysis of the 25% remaining pairs of probes showed that differences can be correlated with differences in DIST_TO_3′, EST_NUMBER or Tm. This argue in favour of the use of these parameters.
Figure 6.

Scatter plot of the ratios measured on Affymetrix GeneChip™ (x-axis) and on RNG/MRC microarrays (y-axis). RNA was derived from either HEK293 cells or a keratinocyte cell line (DK7). 11053 transcripts had at least one Affymetrix probe set and one RNG/MRC probe. Among them, 7054 pairs were further analyzed, as their intensity level was larger than the 25th percentile on both platforms. After quantification of the signals on both platforms, the ratio of the expression levels between the two cell lines was established. The coefficient of correlation was equal to 0.81.
We noticed a convergence over time of the design of an optimal collection of oligonucleotide probe (Supplementary Figure 2). This probably corresponds to the overall reduction in the number of new/novel sequences for each organism over time. This point is suggested by the fact that no significant changes were made to our process over the period of re-evaluations. We anticipate that further iterations will provide marginal improvements to the optimal probe sets already available for studying human and mouse transcriptomes. The in silico validation studies presented here (Figures 2–4) of the RNG/MRC probe collections suggests that they compare well with three commercial platforms. However, more extensive experimental analyses of these observations will be required to confirm this.
A first experimental validation of RNG/MRC microarrays focused on the identification of clusters of genes specific to at least one of four distinct tissues or cell types (leucocytes, nasal epithelium cells, keratinocytes or liver) (Supplementary Figure 3). Several tissue-specific transcripts were identified after hybridization, which correspond to classical markers of these tissues: this was the case of HLA molecules in immune cells, of keratins in keratinocytes, or of albumin in liver. The similar patterns revealed by heatmaps representing hybridization data or EST_NUMBER scores (Supplementary Figure 3) support the idea that we correctly identified tissue-specific traits. These observations suggest good overall agreement between experimental results provided by hybridization of the RNG/MRC arrays and the annotation of the probes. Several additional validations have been provided elsewhere for specific sets of probes that were identified after using the RNG/MRC microarrays (9,60,61). Additional results are summarized in Supplementary Table 1, where validated probes are indicated.
A second, and to our opinion, more definitive demonstration of the quality of the collections was provided after comparing two distinct RNAs on the RNG/MRC human microarray and on the Affymetrix GeneChip™. The high coefficient of correlation (>0.8) observed between the two distinct comparisons represents a definitive demonstration of the quality of our design. More elaborate experimental design, such as those described in Barnes et al. (5) or in de Reynies et al. (62) may in the future help defining more precisely sets of probes providing highly reproducible results.
Whilst it is difficult to anticipate the future of the microarray field (especially the role that will be played by academic facilities in array fabrication), genome-wide analysis of the human and mouse transcriptomes is now almost a routine procedure in an increasing number of laboratories. The need for comprehensive microarrays covering all known human and mouse genes, composed of homogeneous sets of probes has never been greater. As the technology arrives at this point in maturity, the development of additional properties, for instance in order to discriminate splice variants, will require new efforts. The current work is a contribution to this quest, and represents, to our knowledge, the first report integrating probe design, microarray fabrication and experimental validation.
SUPPLEMENTARY DATA
Supplementary Data are available at NAR Online.
Supplementary Material
Figure 7.
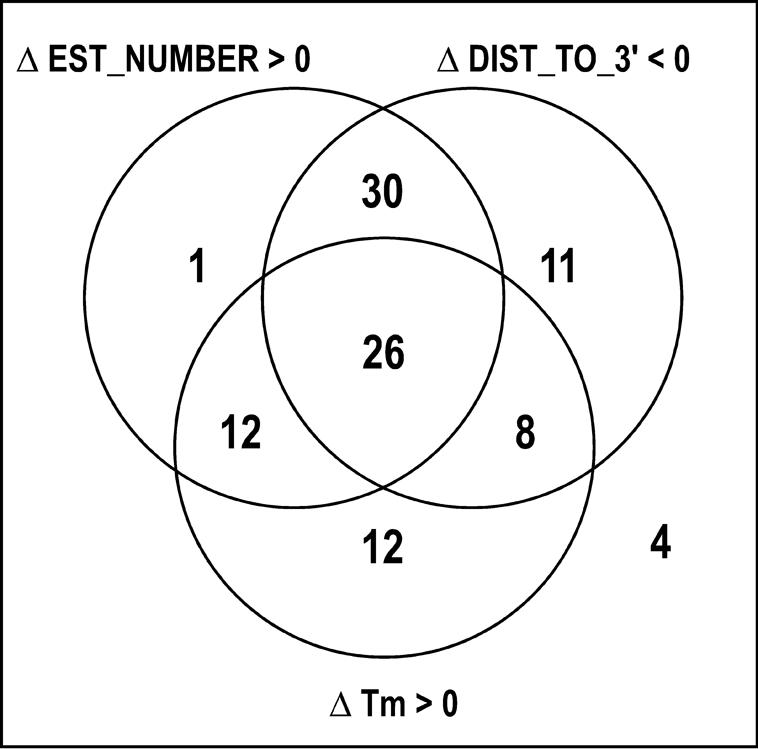
Analysis of 34 mouse transcripts targeted by 2 distinct RNG/MRC probes. Shown are probes with a variation in intensity greater than 2 fold. Each number corresponds to the number of transcripts for which fluorescence intensity varied along with EST_NUMBER, DIST_TO_3′ and/or Tm.
Acknowledgments
This work was performed thanks to support from the Réseau National des Genopoles, the GIP Aventis, the French Ministry of Industry (réseau GenHomme), the French Association Vaincre la Mucoviscidose, the INCA, the CNRS, and the UK Medical Research Council. J.M.R. and E.G. were supported in part by a grant from NIH (1R01GM068564). Microarray experiments were carried out using the facilities of the Nice-Sophia Antipolis, Strasbourg and Evry Transcriptome Platforms of the Genopole®. The authors are grateful to Dr Alexandra Louis (Infobiogen, Evry, France) for help with LASSAP, to Dr Jérôme Aubert (Galderma Research and Development, Sophia Antipolis, France) for sharing unpublished information, and to Franck Aguila for artwork. Funding to pay the Open Access publication charges for this article was provided by CNRS.
Conflict of interest statement. None declared.
REFERENCES
- 1.Fodor S.P., Read J.L., Pirrung M.C., Stryer L., Lu A.T., Solas D. Light-directed, spatially addressable parallel chemical synthesis. Science. 1991;251:767–773. doi: 10.1126/science.1990438. [DOI] [PubMed] [Google Scholar]
- 2.Nuwaysir E.F., Huang W., Albert T.J., Singh J., Nuwaysir K., Pitas A., Richmond T., Gorski T., Berg J.P., Ballin J., et al. Gene expression analysis using oligonucleotide arrays produced by maskless photolithography. Genome Res. 2002;12:1749–1755. doi: 10.1101/gr.362402. [DOI] [PMC free article] [PubMed] [Google Scholar]
- 3.Kronick M.N. Creation of the whole human genome microarray. Expert. Rev. Proteomics. 2004;1:19–28. doi: 10.1586/14789450.1.1.19. [DOI] [PubMed] [Google Scholar]
- 4.Ramakrishnan R., Dorris D., Lublinsky A., Nguyen A., Domanus M., Prokhorova A., Gieser L., Touma E., Lockner R., Tata M., et al. An assessment of Motorola CodeLink microarray performance for gene expression profiling applications. Nucleic Acids Res. 2002;30:e30. doi: 10.1093/nar/30.7.e30. [DOI] [PMC free article] [PubMed] [Google Scholar]
- 5.Barnes M., Freudenberg J., Thompson S., Aronow B., Pavlidis P. Experimental comparison and cross-validation of the Affymetrix and Illumina gene expression analysis platforms. Nucleic Acids Res. 2005;33:5914–5923. doi: 10.1093/nar/gki890. [DOI] [PMC free article] [PubMed] [Google Scholar]
- 6.Brown P.O., Botstein D. Exploring the new world of the genome with DNA microarrays. Nature Genet. 1999;21:33–37. doi: 10.1038/4462. [DOI] [PubMed] [Google Scholar]
- 7.Handley D., Serban N., Peters D., O'Doherty R., Field M., Wasserman L., Spirtes P., Scheines R., Glymour C. Evidence of systematic expressed sequence tag IMAGE clone cross-hybridization on cDNA microarrays. Genomics. 2004;83:1169–1175. doi: 10.1016/j.ygeno.2003.12.010. [DOI] [PubMed] [Google Scholar]
- 8.Dayem M.A., Moreilhon C., Turchi L., Magnone V., Christen R., Ponzio G., Barbry P. Early gene expression in wounded human keratinocytes revealed by DNA microarray analysis. Comp. Funct. Genom. 2003;4:460–467. doi: 10.1002/cfg.239. [DOI] [PMC free article] [PubMed] [Google Scholar]
- 9.Moreilhon C., Gras D., Hologne C., Bajolet O., Cottrez F., Magnone V., Merten M., Groux H., Puchelle E., Barbry P. Live Staphylococcus aureus and bacterial soluble factors induce different transcriptional responses in human airway cells. Physiol. Genomics. 2005;20:244–255. doi: 10.1152/physiolgenomics.00135.2004. [DOI] [PubMed] [Google Scholar]
- 10.Postier B.L., Wang H.L., Singh A., Impson L., Andrews H.L., Klahn J., Li H., Risinger G., Pesta D., Deyholos M., et al. The construction and use of bacterial DNA microarrays based on an optimized two-stage PCR strategy. BMC Genomics. 2003;4:23. doi: 10.1186/1471-2164-4-23. [DOI] [PMC free article] [PubMed] [Google Scholar]
- 11.Hughes T.R., Mao M., Jones A.R., Burchard J., Marton M.J., Shannon K.W., Lefkowitz S.M., Ziman M., Schelter J.M., Meyer M.R., et al. Expression profiling using microarrays fabricated by an ink-jet oligonucleotide synthesizer. Nat. Biotechnol. 2001;19:342–347. doi: 10.1038/86730. [DOI] [PubMed] [Google Scholar]
- 12.Kane M.D., Jatkoe T.A., Stumpf C.R., Lu J., Thomas J.D., Madore S.J. Assessment of the sensitivity and specificity of oligonucleotide (50mer) microarrays. Nucleic Acids Res. 2000;28:4552–4557. doi: 10.1093/nar/28.22.4552. [DOI] [PMC free article] [PubMed] [Google Scholar]
- 13.Hu J., Kapoor M., Zhang W., Hamilton S.R., Coombes K.R. Analysis of dose-response effects on gene expression data with comparison of two microarray platforms. Bioinformatics. 2005;21:3524–3529. doi: 10.1093/bioinformatics/bti592. [DOI] [PubMed] [Google Scholar]
- 14.Irizarry R.A., Warren D., Spencer F., Kim I.F., Biswal S., Frank B.C., Gabrielson E., Garcia J.G., Geoghegan J., Germino G., et al. Multiple-laboratory comparison of microarray platforms. Nature Meth. 2005;2:345–350. doi: 10.1038/nmeth756. [DOI] [PubMed] [Google Scholar]
- 15.Larkin J.E., Frank B.C., Gavras H., Sultana R., Quackenbush J. Independence and reproducibility across microarray platforms. Nature Meth. 2005;2:337–344. doi: 10.1038/nmeth757. [DOI] [PubMed] [Google Scholar]
- 16.Park P.J., Cao Y.A., Lee S.Y., Kim J.W., Chang M.S., Hart R., Choi S. Current issues for DNA microarrays: platform comparison, double linear amplification, and universal RNA reference. J. Biotechnol. 2004;112:225–245. doi: 10.1016/j.jbiotec.2004.05.006. [DOI] [PubMed] [Google Scholar]
- 17.Petersen D., Chandramouli G.V., Geoghegan J., Hilburn J., Paarlberg J., Kim C.H., Munroe D., Gangi L., Han J., Puri R., et al. Three microarray platforms: an analysis of their concordance in profiling gene expression. BMC Genomics. 2005;6:63. doi: 10.1186/1471-2164-6-63. [DOI] [PMC free article] [PubMed] [Google Scholar]
- 18.Schlingemann J., Habtemichael N., Ittrich C., Toedt G., Kramer H., Hambek M., Knecht R., Lichter P., Stauber R., Hahn M. Patient-based cross-platform comparison of oligonucleotide microarray expression profiles. Lab. Invest. 2005;85:1024–1039. doi: 10.1038/labinvest.3700293. [DOI] [PubMed] [Google Scholar]
- 19.Tan P.K., Downey T.J., Spitznagel E.L., Jr, Xu P., Fu D., Dimitrov D.S., Lempicki R.A., Raaka B.M., Cam M.C. Evaluation of gene expression measurements from commercial microarray platforms. Nucleic Acids Res. 2003;31:5676–5684. doi: 10.1093/nar/gkg763. [DOI] [PMC free article] [PubMed] [Google Scholar]
- 20.Altschul S.F., Gish W., Miller W., Myers E.W., Lipman D.J. Basic local alignment search tool. J. Mol. Biol. 1990;215:403–410. doi: 10.1016/S0022-2836(05)80360-2. [DOI] [PubMed] [Google Scholar]
- 21.Kent W.J. BLAT—the BLAST-like alignment tool. Genome Res. 2002;12:656–664. doi: 10.1101/gr.229202. [DOI] [PMC free article] [PubMed] [Google Scholar]
- 22.Rouillard J.M., Herbert C.J., Zuker M. OligoArray: genome-scale oligonucleotide design for microarrays. Bioinformatics. 2002;18:486–487. doi: 10.1093/bioinformatics/18.3.486. [DOI] [PubMed] [Google Scholar]
- 23.Rouillard J.M., Zuker M., Gulari E. OligoArray 2.0: design of oligonucleotide probes for DNA microarrays using a thermodynamic approach. Nucleic Acids Res. 2003;31:3057–3062. doi: 10.1093/nar/gkg426. [DOI] [PMC free article] [PubMed] [Google Scholar]
- 24.Zuker M. Mfold web server for nucleic acid folding and hybridization prediction. Nucleic Acids Res. 2003;31:3406–3415. doi: 10.1093/nar/gkg595. [DOI] [PMC free article] [PubMed] [Google Scholar]
- 25.Legendre M., Gautheret D. Sequence determinants in human polyadenylation site selection. BMC Genomics. 2003;4:7. doi: 10.1186/1471-2164-4-7. [DOI] [PMC free article] [PubMed] [Google Scholar]
- 26.Glemet E., Codani J.J. LASSAP, a LArge Scale Sequence compArison Package. Comput. Appl. Biosci. 1997;13:137–143. doi: 10.1093/bioinformatics/13.2.137. [DOI] [PubMed] [Google Scholar]
- 27.Boguski M.S., Lowe T.M., Tolstoshev C.M. dbEST—database for ‘expressed sequence tags’. Nature Genet. 1993;4:332–333. doi: 10.1038/ng0893-332. [DOI] [PubMed] [Google Scholar]
- 28.Ashburner M., Ball C.A., Blake J.A., Botstein D., Butler H., Cherry J.M., Davis A.P., Dolinski K., Dwight S.S., Eppig J.T., et al. Gene ontology: tool for the unification of biology. The Gene Ontology Consortium. Nature Genet. 2000;25:25–29. doi: 10.1038/75556. [DOI] [PMC free article] [PubMed] [Google Scholar]
- 29.Harris M.A., Clark J., Ireland A., Lomax J., Ashburner M., Foulger R., Eilbeck K., Lewis S., Marshall B., Mungall C., et al. The Gene Ontology (GO) database and informatics resource. Nucleic Acids Res. 2004;32:D258–D261. doi: 10.1093/nar/gkh036. [DOI] [PMC free article] [PubMed] [Google Scholar]
- 30.Pearson W.R. Rapid and sensitive sequence comparison with FASTP and FASTA. Meth. Enzymol. 1990;183:63–98. doi: 10.1016/0076-6879(90)83007-v. [DOI] [PubMed] [Google Scholar]
- 31.Didier G., Brezellec P., Remy E., Henaut A. GeneANOVA—gene expression analysis of variance. Bioinformatics. 2002;18:490–491. doi: 10.1093/bioinformatics/18.3.490. [DOI] [PubMed] [Google Scholar]
- 32.Durinck S., Moreau Y., Kasprzyk A., Davis S., De Moor B., Brazma A., Huber W. BioMart and Bioconductor: a powerful link between biological databases and microarray data analysis. Bioinformatics. 2005;21:3439–3440. doi: 10.1093/bioinformatics/bti525. [DOI] [PubMed] [Google Scholar]
- 33.Gentleman R.C., Carey V.J., Bates D.M., Bolstad B., Dettling M., Dudoit S., Ellis B., Gautier L., Ge Y., Gentry J., et al. Bioconductor: open software development for computational biology and bioinformatics. Genome. Biol. 2004;5:R80. doi: 10.1186/gb-2004-5-10-r80. [DOI] [PMC free article] [PubMed] [Google Scholar]
- 34.Saeed A.I., Sharov V., White J., Li J., Liang W., Bhagabati N., Braisted J., Klapa M., Currier T., Thiagarajan M., et al. TM4: a free, open-source system for microarray data management and analysis. Biotechniques. 2003;34:374–378. doi: 10.2144/03342mt01. [DOI] [PubMed] [Google Scholar]
- 35.Charbonnier Y., Gettler B., Francois P., Bento M., Renzoni A., Vaudaux P., Schlegel W., Schrenzel J. A generic approach for the design of whole-genome oligoarrays, validated for genomotyping, deletion mapping and gene expression analysis on Staphylococcus aureus. BMC Genomics. 2005;6:95. doi: 10.1186/1471-2164-6-95. [DOI] [PMC free article] [PubMed] [Google Scholar]
- 36.Fitzpatrick J.M., Johnston D.A., Williams G.W., Williams D.J., Freeman T.C., Dunne D.W., Hoffmann K.F. An oligonucleotide microarray for transcriptome analysis of Schistosoma mansoni and its application/use to investigate gender-associated gene expression. Mol. Biochem. Parasitol. 2005;141:1–13. doi: 10.1016/j.molbiopara.2005.01.007. [DOI] [PubMed] [Google Scholar]
- 37.Lyons P. Advances in spotted microarray resources for expression profiling. Brief. Funct. Genomic. Proteomic. 2003;2:21–30. doi: 10.1093/bfgp/2.1.21. [DOI] [PubMed] [Google Scholar]
- 38.Pylatuik J.D., Fobert P.R. Comparison of transcript profiling on Arabidopsis microarray platform technologies. Plant. Mol. Biol. 2005;58:609–624. doi: 10.1007/s11103-005-6506-3. [DOI] [PubMed] [Google Scholar]
- 39.Talla E., Tekaia F., Brino L., Dujon B. A novel design of whole-genome microarray probes for Saccharomyces cerevisiae which minimizes cross-hybridization. BMC Genomics. 2003;4:38. doi: 10.1186/1471-2164-4-38. [DOI] [PMC free article] [PubMed] [Google Scholar]
- 40.Brennan C., Zhang Y., Leo C., Feng B., Cauwels C., Aguirre A.J., Kim M., Protopopov A., Chin L. High-resolution global profiling of genomic alterations with long oligonucleotide microarray. Cancer Res. 2004;64:4744–4748. doi: 10.1158/0008-5472.CAN-04-1241. [DOI] [PubMed] [Google Scholar]
- 41.Chaudhuri J.D. Genes arrayed out for you: the amazing world of microarrays. Med. Sci. Monit. 2005;11:RA52–RA62. [PubMed] [Google Scholar]
- 42.Ewis A.A., Zhelev Z., Bakalova R., Fukuoka S., Shinohara Y., Ishikawa M., Baba Y. A history of microarrays in biomedicine. Expert. Rev. Mol. Diagn. 2005;5:315–328. doi: 10.1586/14737159.5.3.315. [DOI] [PubMed] [Google Scholar]
- 43.Allemeersch J., Durinck S., Vanderhaeghen R., Alard P., Maes R., Seeuws K., Bogaert T., Coddens K., Deschouwer K., Van Hummelen P., et al. Benchmarking the CATMA microarray. A novel tool for Arabidopsis transcriptome analysis. Plant Physiol. 2005;137:588–601. doi: 10.1104/pp.104.051300. [DOI] [PMC free article] [PubMed] [Google Scholar]
- 44.Chen H., Sharp B.M. Oliz, a suite of Perl scripts that assist in the design of microarrays using 50mer oligonucleotides from the 3′ untranslated region. BMC Bioinformatics. 2002;3:27. doi: 10.1186/1471-2105-3-27. [DOI] [PMC free article] [PubMed] [Google Scholar]
- 45.Chou H.H., Hsia A.P., Mooney D.L., Schnable P.S. Picky: oligo microarray design for large genomes. Bioinformatics. 2004;20:2893–2902. doi: 10.1093/bioinformatics/bth347. [DOI] [PubMed] [Google Scholar]
- 46.Giddings M.C., Matveeva O.V., Atkins J.F., Gesteland R.F. ODNBase--a web database for antisense oligonucleotide effectiveness studies. Oligodeoxynucleotides. Bioinformatics. 2000;16:843–844. doi: 10.1093/bioinformatics/16.9.843. [DOI] [PubMed] [Google Scholar]
- 47.Gordon P.M., Sensen C.W. Osprey: a comprehensive tool employing novel methods for the design of oligonucleotides for DNA sequencing and microarrays. Nucleic Acids Res. 2004;32:e133. doi: 10.1093/nar/gnh127. [DOI] [PMC free article] [PubMed] [Google Scholar]
- 48.Herold K.E., Rasooly A. Oligo Design: a computer program for development of probes for oligonucleotide microarrays. Biotechniques. 2003;35:1216–1221. doi: 10.2144/03356bc02. [DOI] [PubMed] [Google Scholar]
- 49.Mrowka R., Schuchhardt J., Gille C. Oligodb--interactive design of oligo DNA for transcription profiling of human genes. Bioinformatics. 2002;18:1686–1687. doi: 10.1093/bioinformatics/18.12.1686. [DOI] [PubMed] [Google Scholar]
- 50.Nordberg E.K. YODA: selecting signature oligonucleotides. Bioinformatics. 2005;21:1365–1370. doi: 10.1093/bioinformatics/bti182. [DOI] [PubMed] [Google Scholar]
- 51.Reymond N., Charles H., Duret L., Calevro F., Beslon G., Fayard J.M. ROSO: optimizing oligonucleotide probes for microarrays. Bioinformatics. 2004;20:271–273. doi: 10.1093/bioinformatics/btg401. [DOI] [PubMed] [Google Scholar]
- 52.Rimour S., Hill D., Militon C., Peyret P. GoArrays: highly dynamic and efficient microarray probe design. Bioinformatics. 2005;21:1094–1103. doi: 10.1093/bioinformatics/bti112. [DOI] [PubMed] [Google Scholar]
- 53.Wernersson R., Nielsen H.B. OligoWiz 2.0--integrating sequence feature annotation into the design of microarray probes. Nucleic Acids Res. 2005;33:W611–W615. doi: 10.1093/nar/gki399. [DOI] [PMC free article] [PubMed] [Google Scholar]
- 54.Tsai J., Sultana R., Lee Y., Pertea G., Karamycheva S., Antonescu V., Cho J., Parvizi B., Cheung F., Quackenbush J. RESOURCERER: a database for annotating and linking microarray resources within and across species. Genome Biol. 2001;2 doi: 10.1186/gb-2001-2-11-software0002. software0002.1-0002.4. [DOI] [PMC free article] [PubMed] [Google Scholar]
- 55.Bouton C.M., Pevsner J. DRAGON: database referencing of array genes online. Bioinformatics. 2000;16:1038–1039. doi: 10.1093/bioinformatics/16.11.1038. [DOI] [PubMed] [Google Scholar]
- 56.Brazma A., Hingamp P., Quackenbush J., Sherlock G., Spellman P., Stoeckert C., Aach J., Ansorge W., Ball C.A., Causton H.C., et al. Minimum information about a microarray experiment (MIAME)-toward standards for microarray data. Nature Genet. 2001;29:365–371. doi: 10.1038/ng1201-365. [DOI] [PubMed] [Google Scholar]
- 57.Edgar R., Domrachev M., Lash A.E. Gene Expression Omnibus: NCBI gene expression and hybridization array data repository. Nucleic Acids Res. 2002;30:207–210. doi: 10.1093/nar/30.1.207. [DOI] [PMC free article] [PubMed] [Google Scholar]
- 58.Parkinson H., Sarkans U., Shojatalab M., Abeygunawardena N., Contrino S., Coulson R., Farne A., Lara G.G., Holloway E., Kapushesky M., et al. ArrayExpress--a public repository for microarray gene expression data at the EBI. Nucleic Acids Res. 2005;33:D553–D555. doi: 10.1093/nar/gki056. [DOI] [PMC free article] [PubMed] [Google Scholar]
- 59.Spellman P.T., Miller M., Stewart J., Troup C., Sarkans U., Chervitz S., Bernhart D., Sherlock G., Ball C., Lepage M., et al. Design and implementation of microarray gene expression markup language (MAGE-ML) Genome Biol. 2002;3 doi: 10.1186/gb-2002-3-9-research0046. research0046.1-0046.9. [DOI] [PMC free article] [PubMed] [Google Scholar]
- 60.Frontini M., Soutoglou E., Argentini M., Bole-Feysot C., Jost B., Scheer E., Tora L. TAF9b (formerly TAF9L) is a bona fide TAF that has unique and overlapping roles with TAF9. Mol. Cell Biol. 2005;25:4638–4649. doi: 10.1128/MCB.25.11.4638-4649.2005. [DOI] [PMC free article] [PubMed] [Google Scholar]
- 61.Hofman V.M.C., Brest P., Tripault F., Le Brigand K., Selva E., Sicard D., Raymond J., Lamarque D., Mari B., Hébuterne X., et al. 2005. Gene expression profiling in human gastric mucosa infected with Helicobacter pylori: correlation with gastritis activity, bacterial density and virulence factors. Submitted. [Google Scholar]
- 62.de Reynies A., Geromin D., Cayuela J.M., Petel F., Dessen P., Sigaux F., Rickman D.S. Comparison of the latest commercial short and long oligonucleotide microarray technologies. BMC. Genomics. 2006;7:51. doi: 10.1186/1471-2164-7-51. [DOI] [PMC free article] [PubMed] [Google Scholar]
Associated Data
This section collects any data citations, data availability statements, or supplementary materials included in this article.