


Abstract
We developed a fast, integrative pipeline to identify cis natural antisense transcripts (cis-NATs) at genome scale. The pipeline mapped mRNAs and ESTs in UniGene to genome sequences in GoldenPath to find overlapping transcripts and combining information from coding sequence, poly(A) signal, poly(A) tail and splicing sites to deduce transcription orientation. We identified cis-NATs in 10 eukaryotic species, including 7830 candidate sense–antisense (SA) genes in 3915 SA pairs in human. The abundance of SA genes is remarkably low in worm and does not seem to be caused by the prevalence of operons. Hundreds of SA pairs are conserved across different species, even maintaining the same overlapping patterns. The convergent SA class is prevalent in fly, worm and sea squirt, but not in human or mouse as reported previously. The percentage of SA genes among imprinted genes in human and mouse is 24–47%, a range between the two previous reports. There is significant shortage of SA genes on Chromosome X in human and mouse but not in fly or worm, supporting X-inactivation in mammals as a possible cause. SA genes are over-represented in the catalytic activities and basic metabolism functions. All candidate cis-NATs can be downloaded from http://nats.cbi.pku.edu.cn/download/.
INTRODUCTION
Natural Antisense Transcripts (NATs) are RNAs that are at least partially complementary to other endogenous RNAs. They might be transcribed in cis from opposing DNA strands at the same genomic locus or in trans at separate loci (1). NATs have already been found to function at several levels of eukaryotic gene regulation including translational regulation, alternative splicing, RNA stability, trafficking, genomic imprinting and X-inactivation (2–4). Changes in antisense transcription have been implicated in pathogenesis, such as cancer (1) or neurological disease (5,6). However, the functional aspects of NATs are not yet well established and NATs in non-mammalian species are not well studied. Thus, the identification of NATs in different species is of great interest to evolutionary biology and medicine.
We focus on the identification and analysis of cis-NATs. The rapidly increasing amount of transcriptome and genome sequence data enable efficient in silico identification of cis-NATs through searching for sense–antisense (SA) gene pairs—exonic overlapping bi-directional transcripts (1,7). Some groups identified SA pairs from mRNAs (8–10) or predicted gene models (11). mRNAs have reliable orientation information but the amount of such sequences is small, resulting in a small number of SA pairs identified, whereas predicted gene models can increase the coverage but some of the predictions may be unreliable, especially when there is no supporting transcript. Other efforts have turned to ESTs, which are available in much larger amount, and as a result, identified many more SA pairs. An important step in these efforts is the assignment of transcription orientation of ESTs. Chen et al. (12) used poly(A) signal and poly(A) tail to assign initial orientations and then used splicing sites as an additional filter whereas Yelin et al. (13) mainly collected the sequences that span introns. A more sophisticated combination of information from coding sequence, poly(A) signal, poly(A) tail and splicing sites may result in more accurate assignments of orientation. Furthermore, a fast pipeline is desirable to enable genome-wide identification of cis-NATs in multiple species and frequent update of the candidate datasets.
Previous efforts may also need to be improved and expanded in some other aspects. First, the classification of SA pairs most often included only convergent (overlapping 3′ end) and divergent (overlapping 5′ end) classes. This coarse classification is ambiguous for SA pairs with special genomic arrangements. Second, there exist conflicting conclusions in literature on features of SA genes. For example, earlier work reported convergent SA pairs to be more prevalent (9,12,13) and that SA genes have no function bias compared to other genes (13), whereas a recent study found divergent SA pairs to be more prevalent and that SA genes are more frequently involved in catalytic activities (14). Reik and Walter (15) estimated that 15% of imprinted genes are associated with antisense transcripts, but the Riken group recently increased the estimate to 81% (14). Last but not the least, all previous efforts focused on either only one species or one lineage (e.g. human and mouse). For example, Chen (12) and Kiyosawa (16) reported SA pairs to be under-represented in X chromosomes in human and mouse. It remained unknown whether this conclusion holds true for other eukaryotes, such as fly and worm.
We designed and implemented a comprehensive pipeline to overcome the technical shortcomings and investigate, from a multiple species perspective, the conflicting conclusions from previous studies. This pipeline uses data in UniGene (17) and GoldenPath (18) to find overlapping transcripts. The genome mapping data in GoldenPath was used as a starting point to map the mRNAs and ESTs in UniGene to genomes and subsequently stringently filtered to ensure quality. This significantly speeded up the pipeline and as a result, enabled a rapid search of cis-NATs across multiple eukaryotic genomes. To increase coverage, we integrated the sources of information used in previous work (12,13) including sequence type (mRNA or EST), coding sequence, poly(A) signal, poly(A) tail and splicing sites to deduce the transcription orientation of mRNAs and ESTs. We applied the pipeline to identify cis-NATs in 10 eukaryotic species including human, mouse, fly, worm, sea squirt, chicken, rat, frog, zebrafish and cow and generated the most comprehensive multiple-genome candidate cis-NAT datasets to date ranging from invertebrate to vertebrate. We identified 7830 SA genes in human (26% of all human genes) in 3915 SA pairs, including about 1000 novel SA pairs not reported in previous publications. The abundance of SA genes is remarkably low in worm (540 or 2.8% of all worm genes), even compared to simpler eukaryotes, such as yeast (11%) and Plasmodium falciparum (12%) (19,20). It does not appear to be caused by the prevalence of operons in the worm genome.
Given such a significantly enlarged dataset across multiple species, we found hundreds of SA pairs that were conserved in two or more species, many of which maintained the same overlapping pattern. Such a dataset also sheds light on some of the conflicting or incomplete conclusions in previous reports. We divided these SA pairs into six classes by expanding existing classification schemes (9,21) to better reflect the precise genomic arrangement of SA pairs. We found that the convergent class (overlapping 3′) is prevalent in fly, worm and sea squirt, but not in human or mouse. The percentage of SA genes among imprinted genes in human and mouse is 24–47%, depending on the imprinted gene sets used, a range between the two extremes in previous studies. The abundance of SA genes on the X-chromosome in fly or worm is found to be similar to that on some of their autosomes, as opposed to the significantly lower abundance of SA genes observed on the X chromosomes in human and mouse. This supports, with data from both vertebrate and invertebrate organisms, previous hypothesis of X-inactivation in mammals being a possible cause (16). Gene Ontology (GO, (22)) and KEGG pathway analysis (23) suggested that SA genes are over-represented in the catalytic activity and basic metabolism functional categories in human, mouse and fly.
MATERIALS AND METHODS
Identification of cis-NATs
We identified cis-NATs by searching for SA gene pairs represented by transcripts (mRNAs or ESTs) in opposite directions at the same genomic locus with ≥20 nt overlap in exonic regions, a definition similar to that used by Chen et al. (12) and Yelin et al. (13). mRNA and EST sequences for the 10 species were downloaded from UniGene of June, 2005 (Supplementary Table S1). We mapped them to their respective genomic sequences using the raw BLAT (24) mapping data in GoldenPath as a starting point and then performed the following stringent post-processing to ensure quality: (i) Only BLAT alignments with nucleotide identity ≥96% and length coverage ≥90% were used. (ii) When an mRNA or EST was aligned to multiple loci, only the locus with the highest number of splice sites and highest BLAT score (number of matches minus number of mismatches and inserts) was selected to avoid possible mapping to a processed pseudogene (13). (iii) If two exonic regions are separated by an extremely small number of nucleotides (nt) (<6 nt in case of EST mapping or <9 nt in case of mRNA mapping), it is likely an artifact caused by a known limitation of BLAT to mistakenly break exons. We merged the whole region (from the start of the preceding exon to the end of the next one) into one exon, a strategy also used in GoldenPath's own post-processing. (iv) Small terminal exons (<11 nt) are likely wrong sequences due to the decreased sequencing quality at the end of a read and were discarded. (v) Extremely large introns are likely a result of mis-alignment and were discarded. Some studies have indicated that intron length increases with species complexity (25). So we used the maximum intron length in FlyBase (26)—150 kb—for non-vertebrates and the maximum intron length in Ensembl's Human dataset (27)—200 kb—for vertebrates as the intron length cut-off. It is possible that the above set of stringent post-processing criteria may mistakenly discard a small amount of good mapping data. However, such quality control is important to ensure the reliability of the results.
The next step is to assign reliable orientation to the transcripts. Careful examination indicated that 10–20% of EST sequences in UniGene have the wrong orientation. To resolve their transcription orientation, we used poly(A) tail, poly(A) signal, and standard splicing acceptor and donor sites ‘GT–AG’ as three evidences (13). We adopted Chen et al.'s (12) definition of poly(A) tail and poly(A) signal. Specifically, poly(A) tail was defined as a stretch of at least 10 As at 3′ end of a sequence and Poly(A) signal was defined as hexanucleotide ‘AATAAA’, ‘ATTAAA’, ‘AATTAA’, ‘AATAAT’, ‘CATAAA’ or ‘AGTAAA’ within the last 50 bp of 3′ end of a sequence after the poly(A) tail was trimmed. Information of splicing sites was imported from GoldenPath tables ‘intronOrientation’ and ‘estOrientInfo’, which were generated by the polyInfo program (http://www.soe.ucsc.edu/~kent/src/unzipped/hg/geneBounds/polyInfo/). For each EST sequence we searched for these features in both the original sequence and its reverse complement. We selected the orientation that satisfies one of the following criteria: (i) the correct orientation should have a higher number of splice sites than the opposite orientation AND the opposite orientation should not have both poly(A) signal and poly(A) tail, or (ii) if both orientations have an equal number of splice sites, the correct orientation is the one that has both poly(A) signal and poly(A) tail to support it. ESTs that do not meet either of the two criteria (because of conflicting evidence or lack of enough evidence) were discarded. The quality of mRNA sequences is much higher than that of ESTs, so we use an mRNA's original orientation as long as it has one of the following evidences: CDS, poly(A) signal, poly(A) tail or standard splicing site ‘GT–AG’. Our strategy integrates evidences used in previous strategies and is able to assign reliable orientation to more transcripts (12,13).
With the set of mRNAs and ESTs that were reliably mapped to the genome and reliably oriented, we assembled them into overlapping clusters. Transcripts were considered ‘overlapping’ if they overlap for ≥20 nt on the genome (13,16). A genomic locus may be mapped by only a single transcript in an orientation, in which case it is even more important to ensure the quality of the transcript. Such a singleton is retained only if the transcript is supported by splicing site and either poly(A) signal or poly(A) tail.
We divided all the clusters into three types (12): SA clusters are those containing transcripts orienting in both directions and overlapping ≥20 nt at the exonic region; the remaining bi-directional clusters are called non-exon-overlapping bi-directional (NOB) clusters; clusters with transcripts all going in one direction are called non-bi-directional (NBD) clusters.
We selected one pair of sequences to represent each SA or NOB cluster and one sequence to represent each NBD cluster. We extended previously published strategies (12,16) and selected transcript with the highest sequence and annotation quality as the representative, favoring Entrez Genes sequences over RefSeq sequences over mRNAs with CDS, and for the remaining sequences (mostly ESTs) favoring sequences with more splice sites and longer overlap (or longer transcript length for NBD clusters).
Using the SA pairs in multiple species, we identified those that are conserved between different species with a strategy extended from that by Chen et al. (28). Representative SA genes were mapped to HomoloGene (29) of June, 2005, a database that groups homologous sequences across different species. HomoloGene entries containing multiple genes from the same species were discarded to ensure one-to-one or orthologous mapping. We first identified SA pairs in two genomes that are mapped to the same pair of HomoloGene entries. These SA pairs were considered conserved between the two species. Then, for SA pairs with only one of the representative genes in two genomes mapped to the same HomoloGene entry, we calculated the similarity of the partner representative genes in the two genomes using pair-wise Blastn. If the partner representative genes share enough similarity on their original strand (Blastn E-value ≤10−10, identity ≥80%, alignment length ≥100 nt), we considered this SA pair to be conserved between the two species. Finally, for SA pairs not mapped to HomoloGene entries at all, we calculated the similarities of both representative genes between the two genomes. An SA pair was considered conserved if both representative genes were considered similar between the two genomes by the above Blastn criteria.
Classification and analysis of SA gene pairs
We combined the classification schemas by Lehner (9) and Munroe (30) into a new one that divided SA gene pairs into six categories (Figure 1): ‘Convergent (tail–tail)’—SA gene pairs overlapping by their last exon, ‘Divergent (head–head)’—SA gene pairs overlapping by their first exon, ‘Complete (full overlap)’—one gene sequence completely covered by an exon of the other, ‘Contained’—one gene sequence completely covered by the intron and exon of the other, ‘Intronic’—one gene starting within an intron of the other and transcribing beyond the start of the other, and ‘Others’—all other SA pairs. Each SA pair is classified into one and only one class; when there is ambiguity the class with the more stringent definition is chosen, in the order of, from most stringent to least, ‘Complete’, ‘Contained’, ‘Intronic’, ‘Divergent (head–head)’, ‘Convergent (tail–tail)’ and ‘Others’.
Figure 1.
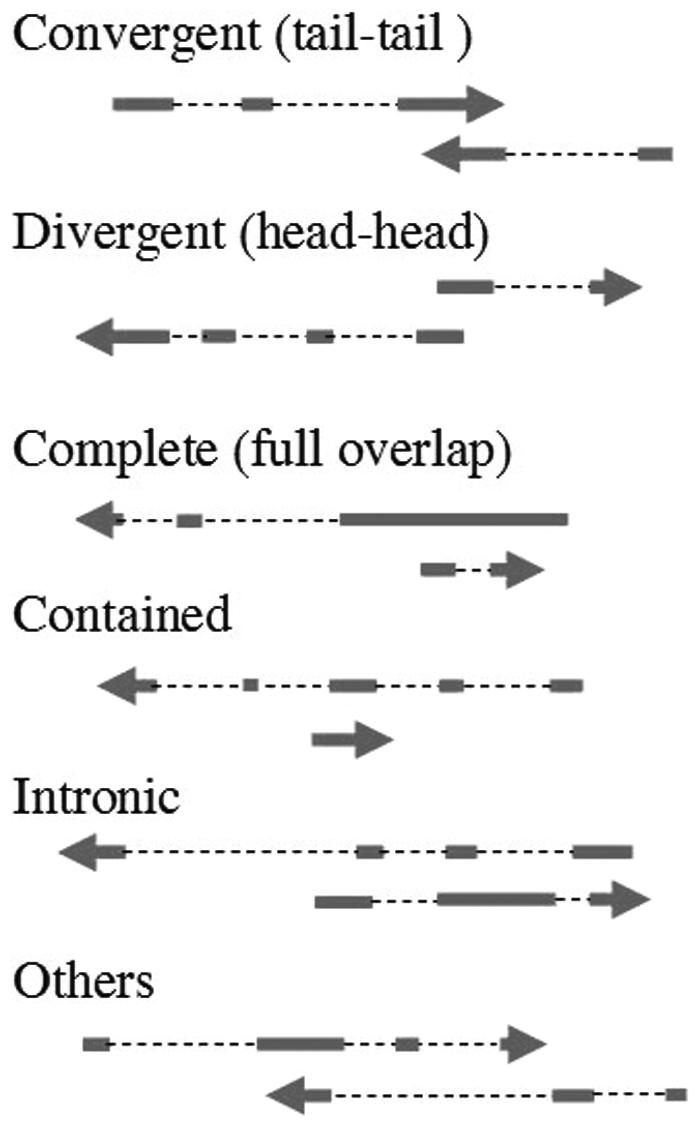
Six classes of SA gene pairs. SA gene pairs are classified into six classes based on their overlapping patterns. Arrows indicate transcription orientation. Blocks indicate exons. Dashed lines between blocks indicate introns.
To study the association between cis-NATs and imprinted genes, we collected 65 human imprinted genes and 71 mouse imprinted genes from the December 2005 release of the Imprinted Gene Catalogue (http://igc.otago.ac.nz/home.html), a dataset curated from literature (31). Two other sources of imprinted genes exist for mouse and were also included in our analysis. One contains 2114 imprinted genes discovered from differential expression profiling of parthenogenote and androgenote mouse embryos (32), and the other contains 600 putative mouse imprinted genes in the Ensembl database predicted by sequence features extracted from known imprinted genes (33). We mapped the human and mouse SA genes to imprinted genes by their accession numbers. We then examined the abundance of SA genes among imprinted genes.
In order to study whether SA genes are enriched in any particular functional categories or pathways, we compared them to all the representative transcripts in all the clusters as background. We did this for human, mouse, fly and worm, which have the largest amount of data available. First, we parsed GO annotations for the transcripts based on Entrez Gene database released on June, 2005 and identified statistically enriched GO functional categories using TermFinder (34). Then, we used the KOBAS software (35) to assign the transcripts to metabolic pathways based on sequence similarity to sequences with known KEGG pathways released on October, 2005 (23) and find statistically enriched pathways among the SA genes.
RESULTS
Candidate cis-NATs
We applied our identification pipeline (summarized in Supplementary Figure S1) to the 10 eukaryotic species and obtained the largest multi-species candidate dataset to date (Table 1, Supplementary Table S1). Many recently characterized SA genes are contained in our result, such as CHRNA3/CHRNA5 (36) and BDNF/BDNFOS (37). Because the amount of available mRNA and EST data for chicken, rat, frog, zebrafish and cow is small compared to their large genome size, their sets of candidate cis-NATs are likely to be incomplete, so the total number of cis-NATs or the percentage within genomes for these species will likely change when more data become available in the future. However, the candidate cis-NATs identified are reliable and to our knowledge no similar dataset exists to date for these species. For human, mouse, fly, worm and sea squirt there is a large amount of mRNA and EST sequences available, and thus the results should be meaningful. All candidate cis-NATs are freely available for download from our web site at http://nats.cbi.pku.edu.cn/download. Dataset of identified NOB clusters is also available for download due to their potential importance in regulation of pre-mRNA processing and possible pathological associations (38,39).
Table 1.
Statistics of SA genes in 10 species
 |
a‘Number of SA genes’ is equal to 2* ‘Number of SA clusters’.
b‘Abundance of SA genes’ is equal to 2* ‘Number of SA clusters’ / (2* ‘Number of SA clusters’ + 2* ‘Number of NOB clusters’ + ‘Number of NBD clusters’). The numbers and other details of NOB and NBD clusters are listed in Supplementary Table S1.
c‘Number of usable transcripts’ is the total number of orientation-reliable mRNAs and ESTs that can be mapped to genome sequences. For the last five species this number is too low compared to the genome size, indicating that the ‘Abundance of SA genes’ for these species is likely to change with additional data. For the other five species this number might be enough to give a relatively good estimate of ‘Abundance of SA genes’.
d‘Properties of usable transcripts’ uses cumulative bar charts to show the percentage of SA clusters in which both (blue), only one (dark red) and none (light yellow) of the forward and backward orientations consists of at least one mRNA sequence (‘mRNA’), coding sequence (‘CDS’), and intron-spanning sequence (‘Splice site’), respectively. CDS information is directly retrieved from UniGene annotation.
Strikingly, the percentage of SA genes identified in worm is remarkably low (2.8%), even when compared to that in simpler eukaryotes, such as yeast (11%) and malaria (12%) (19,20). In addition, even when predicted gene models are used and there is no restriction on the minimum length of overlap, the percentage of bi-directional overlapping genes in worm is only 5% (11). One possible explanation is that the wide-spread operons in the worm genome (40) might exclude cis-NATs, as pairing of the antisense transcript to the sense pre-mRNA might disrupt transcription of the whole operon. To test this hypothesis, we downloaded the operon annotations from WormBase (41), and examined the abundance of SA genes in the operon versus non-operon genes. For comparison, we also examined the abundance of SA genes in fly which also has operons (42). For both species, the abundance of SA genes is comparable in operon versus non-operon regions (χ2 P-value > 0.05). The abundance of genes from NOB clusters is also comparable in operon versus non-operon regions (χ2 P-value > 0.05). Therefore, operon structure cannot fully explain the overall low abundance of cis-NATs in worm. One paper reported a large number of antisense transcripts detected by SAGE profiling from mitochondria in worm (43) but not in P.falciparum (20) or any other eukaryotes studied to date. The low abundance of antisense transcripts in the nucleic genome and the high abundance in the mitochondria genome might be an interesting subject for further study.
In addition to SA gene pairs, we have identified hundreds of triplets of overlapping genes; triplets were reported previously by Veeramachaneni et al. (44). We also identified dozens of quadruplets. One example is shown in Figure 2, which consists of four distinct genes (AUP1, PRSS25, LOXL3 and DOK1) overlapping in a head–head, tail–tail and head–head manner, respectively. Triplet and quadruplet loci indicate the complexity of gene structure.
Figure 2.

Example of a quadruplet cluster. This quadruplet cluster consists of four distinct genes (AUP1, PRSS25, LOXL3 and DOK1) overlapping in a head–head, tail–tail and head–head manner, respectively. The overlap between LOXL3 and DOK1 is NOB-type. The other two overlaps are SA type. The genomic sequence is shown as red line at the top. The transcripts are aligned to the genomic sequence and shown underneath. Alternating black and gray blocks indicate neighboring exons and dashed lines between blocks indicate introns. Blocks in green indicate UTR. The poly(A) signals and poly(A) tails are also shown.
Conserved SA pairs
The number of SA pairs with both representative genes mapped to HomoloGene is 520 in human, 480 in mouse, 25 in rat and 427 in fly. Among them, 155 human SA pairs also overlap in mouse, 129 of which maintain the same overlapping pattern (120 convergent pairs, eight divergent pairs, and one intronic pair). The predominance of the convergent class among SA pairs conserved between human and mouse is consistent with a recent report (45). This discrepancy might indicate importance of 3′-untranslated region (3′-UTR), which enrich regulatory elements possibly involved in antisense regulation. We further identified nine SA pairs that are conserved in human, mouse and rat (Table 2). Only two of them, THRA/NR1D1 and MKRN2/RAF1, were previously characterized (46,47).
Table 2.
Human SA pairs conserved in both mouse and rat identified by cross-reference of HomoloGene
| Plus_strand_transcript | Minus_strand_transcript | ||
|---|---|---|---|
| Accession_number | Gene_name | Accession_number | Gene_name |
| NM_001001787 | ATP1B1 | NM_013330 | NME7 |
| NM_024854 | FLJ22028 | NM_002907 | RECQL |
| NM_001005407 | CACNA1H | NM_012467 | TPSG1 |
| NM_173618 | FLJ90652 | NM_003586 | DOC2A |
| NM_003250 | THRA | NM_021724 | NR1D1 |
| NM_032332 | MGC4238 | NM_001930 | DHPS |
| NM_014160 | MKRN2 | NM_002880 | RAF1 |
| NM_018295 | FLJ11000 | NM_024033 | MGC5242 |
| NM_032509 | RBM13 | NM_025115 | FLJ23263 |
SA pairs conserved in different species. The ‘accession number’ and ‘gene_name’ are from the RefSeq database and Entrez Gene database, respectively.
The number of SA pairs with only one representative gene mapped to HomoloGene is 2475 in human, 1762 in mouse, 209 in rat, 413 in fly, 69 in worm and 196 in chicken. Among them, using the similarity criteria described in Materials and Methods, we found another 158 human SA pairs to be conserved in mouse, 120 of which maintain the same overlapping pattern. More interestingly, 18 human SA pairs, 10 mouse SA pairs and 4 rat SA pairs are also conserved in chicken (Table 3). Three SA pairs, MSH6/FBXO11, POLR2B/IGFBP7 and RBM13/C8orf41 occur in all four vertebrate species and maintain the same overlapping pattern (‘Convergent’).
Table 3.
SA pairs in human, mouse and rat that are conserved in chicken identified by HomoloGene cross-reference of one representative gene and pair-wise sequence comparison of the other representative gene
| Plus_strand_transcript | Minus_strand_transcript | ||
|---|---|---|---|
| Accession_number | Gene_name | Accession_number | Gene_name |
| Human | |||
| NM_181706 | ZCSL3 | NM_144981 | FLJ25059 |
| BC073964 | PHC1 | NM_002355 | M6PR |
| AL832339 | MGC50559 | NM_207337 | LOC196394 |
| NM_024549 | FLJ21127 | NM_032369 | MGC15619 |
| NM_205850 | SLC24A5 | NM_016132 | MYEF2 |
| NM_024419 | PGS1 | NM_003727 | DNAH17 |
| NM_012249 | RHOQ | NM_002643 | PIGF |
| NM_000179 | MSH6 | NM_025133 | FBXO11 |
| NM_030582 | COL18A1 | AB209069 | SLC19A1 |
| BC042384 | N/A | NM_005965 | MYLK |
| NM_000938 | POLR2B | NM_001553 | IGFBP7 |
| NM_016067 | MRPS18C | NM_139076 | FLJ13614 |
| NM_002006 | FGF2 | NM_007083 | NUDT6 |
| NM_152683 | FLJ33167 | NM_024629 | MLF1IP |
| NM_032509 | RBM13 | NM_025115 | FLJ23263 |
| BE349850 | N/A | NM_000349 | STAR |
| BC063847 | INVS | NM_017746 | TEX10 |
| NM_153710 | C9orf96 | NM_020385 | XPMC2H |
| Mouse | |||
| NM_011955 | Nubp1 | BC068110 | LOC383103 |
| NM_145491 | Rhoq | NM_008838 | Pigf |
| NM_010830 | Msh6 | BC049946 | Fbxo11 |
| NM_028260 | 1500034J20Rik | NM_026992 | 1700030A21Rik |
| NM_175034 | Slc24a5 | AK034990 | Myef2 |
| NM_010569 | Invs | BC006867 | Tex10 |
| NM_001003893 | Masp2 | NM_001003898 | Tardbp |
| NM_153798 | Polr2b | NM_008048 | Igfbp7 |
| NM_144927 | BC019943 | NM_026453 | Rbm13 |
| NM_027973 | Mlf1ip | NM_001001184 | MGC86034 |
| Rat | |||
| NM_001013048 | Igfbp7_predicted | BG381131 | N/A |
| NM_001014002 | RGD1311297_ predicted | NM_001013883 | RGD1310414_ predicted |
| NM_019305 | Fgf2 | NM_181363 | Nudt6 |
| AA819391 | N/A | NM_181631 | RGD:727935 |
Three SA pairs, MSH6/FBXO11, POLR2B/IGFBP7 and RBM13/C8orf41 occur in all four vertebrate species.
Among SA pairs not mapped to HomoloGene at all we used the similarity criteria to identify more conserved SA pairs between human, mouse and rat. In addition, we identified eight human SA pairs, four mouse SA pairs and one rat SA pair that are conserved also in frog (Table 4). One mouse SA pair, GNL2/DNALI1, is even conserved in zebrafish.
Table 4.
SA pairs in human, mouse, and rat that are conserved in frog identified by pair-wise sequence comparison of both representative genes
| Plus_strand_transcript | Plus_strand_transcript | ||
|---|---|---|---|
| Accession_number | Gene_name | Accession_number | Gene_name |
| Human | |||
| AK096901 | FLJ39582 | NM_145042 | MGC16703 |
| BG722184 | N/A | AK056169 | TLP19 |
| NM_032704 | TUBA6 | BE743720 | N/A |
| NM_000179 | MSH6 | NM_025133 | FBXO11 |
| NM_002940 | ABCE1 | BU567906 | N/A |
| NM_015360 | SKIV2L2 | NM_003711 | PPAP2A |
| BI089035 | N/A | NM_001025 | RPS23 |
| NM_004279 | PMPCB | X98260 | ZRF1 |
| Mouse | |||
| AY223866 | Cog4 | NM_133953 | Sf3b3 |
| BG066336 | N/A | NM_031878 | Smarcd2 |
| NM_177325 | AW550801 | NM_013761 | Srr |
| NM_010830 | Msh6 | BC049946 | Fbxo11 |
| Rat | |||
| AA819391 | N/A | NM_181631 | RGD:727935 |
Using a similar strategy, we identified dozens of inter-species conserved NOB pairs. The complete list is also available on our website.
Abundance of different classes of SA pairs
Figure 3 shows the abundance of different classes of SA pairs in 10 species. The exact percentages are listed in Supplementary Table 1E. Results for the last five species need to be taken with caution due to the relatively small amount of available EST data. Results for the first five species should be more reliable. Several previous studies (9,13,21) reported convergent (tail–tail) pairs to be the predominant class of cis-NATs. We found that convergent SA pairs are predominant in fly, worm and sea squirt, but not in human and mouse. This is consistent with a recent study (14) but different from earlier studies (9,13,21). Two factors might have contributed to the previously over-estimated convergent cis-NATs. First, some previous studies choose the longest overlapping transcripts without considering transcript quality to be the representative transcripts. This allows more EST sequences with 3′ bias to be the representative pair (48), which are more likely to have tail–tail overlap. Second, the classification systems used in earlier studies are not as fine and complete, which might give rise to ambiguities.
Figure 3.

Abundance of the six classes of SA gene pairs. The abundance of the six classes of SA gene pairs is shown in the cumulative bar chart for human, mouse, fly, worm, sea squirt, chicken, rat, frog, zebrafish and cow. The figure shows that convergent SA pairs are prominent in fly, worm and sea squirt, but not in human and mouse as reported previously. The abundance in the last five species is likely to change with more available data.
Imprinted genes with antisense transcription
Cis-NATs have been implicated as an important regulatory mechanism for imprinting (49). We examined the relative abundance of SA genes among human and mouse imprinted genes. A total of 47% of the human imprinted genes in the IGC database are SA genes, 16% are NOB genes and 37% are NBD genes. In the three mouse imprinted gene datasets, the percentage of SA genes ranges from 24% (based on the predicted dataset in Ensembl) to 37% (based on the IGC dataset) (Figure 4, Supplementary Table S2). In all of these cases, imprinted genes are statistically significantly enriched (χ2 test P-value < 0.01) in SA genes. Such a significant correlation might exemplify cis-NATs' roles in genomic imprinting and allelic-specific expression.
Figure 4.

Percentage of mouse imprinted gene that belong to SA, NOB and NBD clusters, respectively Three datasets of mouse imprinted genes were used, including the imprinted gene catalogue which was curated from literature (IGC), putative imprinted genes in the Ensembl database (Ensembl), and imprinted genes discovered from differential expression profiling of parthenogenote and androgenote mouse embryos (FANTOM2). SA genes are statistically significantly enriched (χ2 test P-value < 0.01) in imprinted genes compared to the NBD dataset.
Reik and Walter (15) estimated that 15% of imprinted genes are associated with antisense transcripts, whereas the Riken group recently updated this estimate to 81% (14). Our results lie between the two reports. One reason that could have caused the vast differences among the previous results is that the Riken group included both SA and NOB genes as antisense transcripts in their calculation. In our results the percentage of mouse imprinted genes that are SA or NOB genes increases to between 33% and 44%, depending on the imprinted gene dataset used. These numbers still lie between the two extremes of the previous two results. The remaining difference can partly be explained by the different SA datasets used in the different studies or by an observation bias. Fahey et al. (8) suggested that recent efforts to find imprinted genes have focused specifically on antisense transcripts, so overly high percentages might be biased.
X-chromosomal distribution
We studied the distribution of SA genes on chromosomes in human, mouse, fly and worm. By studying and comparing these four species, we tested the hypothesis by Kiyosawa et al. (12,16) that cis-NAT genes may be excluded on the X-chromosome in mammalian genomes that have X-inactivation mechanism. Our results show that in both human and mouse, SA loci are significantly less prevalent on X-chromosome than on any autosome (χ2 test P-value < 10−5, Figure 5, Supplementary Figure S2 and Supplementary Table S3), a finding consistent with previous reports (12,16). On the contrary, we found that in fly, the abundance of SA loci on the X-chromosome is similar to that on Chromosome 3L and even higher than that on Chromosome 4; in worm, the abundance of SA loci on the X-chromosome is similar to all autosomes except chromosome I (Supplementary Figure S2 and Supplementary Table S3). While mammals regulate X-chromosome gene expression by shutting off one X-chromosome (a.k.a. X-inactivation), fly and worm do it by adjusting the expression levels on X chromosome instead. Our results supported the hypothesis by Kiyosawa et al. from a multiple-genome perspective.
Figure 5.

Chromosomal distribution of SA gene pairs in the mouse genome x-axis shows the different chromosomes in mouse genome; y-axis shows the chromosomal coordinate. ‘+’ marks a SA gene pair. SA genes are significantly less abundant in the X-chromosome compared to all autosomes. The chromosomal distribution of SA gene pairs in the human genome is very similar.
Functional bias of cis-NATs
We mapped all SA genes in human, mouse, fly and worm to GO functional categories and identified statistically significantly enriched ones using TermFinder (34). Although, some functional categories are enriched in some but not all species, which might represent lineage-specific SA gene functions (50), there is remarkable consistency among human, mouse and fly. (No statistically significant GO category was detected in worm SA genes due to insufficient known GO assignments). In particular, we found SA genes to be significantly enriched in GO functional categories ‘Catalytic Activity’, ‘Metabolism’, and ‘Cell Organization and Biogenesis’ (Supplementary Table S4). This is consistent with a recent finding (14) but different from earlier findings (9,12,13,51). This discrepancy may be partly due to recent expansion and refinement of GO.
We identified statistically enriched pathways in SA genes using KOBAS (35) (Supplementary Table S5). SA genes are found to be enriched in metabolism-related pathways, a finding coinciding well with the enriched GO functional categories. The SA genes are enriched in the ‘Tight junction’, ‘Adhesion junction’ and ‘Regulation of actin cytoskeleton’ pathways, which are related to enriched GO functional categories ‘Cell organization’ and ‘Cytoskeleton’. We also found the ‘Circadian rhythm’, ‘Hedgehog signaling’ and ‘Dorso-ventral axis formation’ pathways to be enriched. SA genes have been reported to participate in each of these pathways by individual experimental studies (52–54). Their significance was validated here by our statistical analysis.
Recently, Ma et al. (55) analyzed the functional distribution of hundreds of antisense transcripts in maize using GO. The high-level functional categories they detected, such as ‘Metabolism’, and ‘Cell Organization and Biogenesis’ agree with our results. Thus some functional bias of SA genes appear to be consistent from plant to animal.
DISCUSSION
The previous largest mRNA/EST-based dataset of SA pairs in human was reported by Chen et al. (12) who identified 2940 candidate SA pairs from UniGene. We identified a larger set of 3915 SA pairs in human. To ensure that the increase was not simply due to the availability of more mRNA and EST sequences, we simulated the input dataset used by Chen et al. by using only sequences submitted to GenBank before December 31, 2003 (the UniGene version used by Chen et al. was released on March, 2004). Our new pipeline still identified 3683 SA pairs in the simulated input dataset. Thus the coverage of our pipeline is higher than previous ones regardless of the input dataset. To ensure quality of our candidate dataset we tested it on the experimentally verified dataset by Chen et al. They had tested 25 loci in their candidate SA pair dataset using strand-specific RT–PCR and were able to verify 23 loci (12). Our dataset includes 24 of the 25 loci tested and 22 of the 23 loci verified. As this test dataset was relatively small, we used another experimentally tested SA candidate dataset that was reported by Yelin et al. (13). They tested 275 loci using microarray and were able to verify 115. Our dataset included 200 of the 275 loci tested and 86 of the 115 loci verified. Thus the quality (22/24 or 86/200) of our candidate SA dataset is comparable to previous studies.
Our dataset covers 82% of the human SA genes in Chen et al. and 74% of those in Yelin et al. We investigated why some of those SA genes reported by Chen et al. (12) and Yelin et al. (13) were not covered by our dataset. The detailed reasons are listed in Supplementary Table S6 and fall within three categories: the new versions of UniGene and the human genome sequence are different from those used in previous studies; some transcripts cannot pass our stringent quality control for alignment and orientation; and some SA genes in the previous datasets now appear in our NOB or NBD clusters because they no longer overlap with their partner transcripts or their partners were filtered out. There are cases where the quality control filter in our pipeline mistakenly removed good transcripts. For example manual inspection discovered that few genes that were removed because they had intron >200 kb in length were in fact authentic. There is a tradeoff between coverage and quality. Overall, most of the transcripts were filtered out for a reasonable cause in order to keep only high-quality transcripts.
Most cis-NAT studies use either BLAT or SIM4 (56) to map mRNAs and ESTs to the genome sequences. We compared BLAT and ESTmapper (an updated version of SIM4) (57) by using them to map all human EST sequences in UniGene to the human genome, and found BLAT and ESTmapper to give comparable results with regard to orientation inference, resulting in 96% identical transcription orientation. GoldenPath provides for download the BLAT mapping data for 32 species and this number continues to increase. Using the available BLAT mapping data in GoldPath as a starting point and applying stringent filters to remove unreliable mapping, we were able to increase the speed of our pipeline significantly, enabling faster scan of multiple whole genomes as well as more frequent update of the candidate SA datasets.
Information of splicing sites used in our pipeline was generated by the polyInfo program, which considered only canonical splicing sites, ‘GT–AG’. Although other splicing sites do occur, ‘GT–AG’ accounts for about 99% of all splicing junctions (58) and non-canonical splicing sites are more likely to be unreliable (59,60). Moreover, due to the integrative nature of our pipeline, transcripts with non-canonical splicing junctions were often assigned the orientation by other evidences, such as mRNA, CDS, poly(A) signal or poly(A) tail. One such example is shown in Supplementary Figure S3.
We used the combination of poly(A) signal and poly(A) tail [a strategy also used by Chen et al. (12)] rather than either of them alone as evidence to determine or contradict an orientation as their short sequences might appear at random in large genomes, especially poly(A) signals, which are variable (61,62). The probability of one of the six poly(A) signal motifs occurring in a 6mer is in the order of 6*(1/4)6, roughly two in a 1000 bp genomic sequence. Although this is a rough estimation, it indicates how wide-spread the poly(A) signal motifs can be in large genomes and thus observing poly(A) signal alone is not meaningful evidence to determine or contradict an orientation. Poly(A) tail is less likely to occur at random [in the order of (1/4)10 for a 10mer] and some previous efforts used poly(A) tail as an independent evidence for transcript orientation (13,59). In our human dataset, among all 1 928 285 ESTs whose orientation was determined by splicing sites (Criteria a in ‘Identification of cis-NATs’ in Materials and Methods), only 1981 (0.1%) had poly(A) tail on the opposite strand. Among all 161 487 ESTs whose orientation was determined by the co-occurrence of poly(A) signal and poly(A) tail (Criteria b), only 237 (0.1%) had poly(A) tail on the opposite strand. Even if we consider poly(A) signals, only 2.7% of the oriented ESTs have either poly(A) signal or poly(A) tail on the opposite strand. If we used only the most reliable poly(A) signals AATAAA and ATTAAA, this percentage would further decrease to 1.6%. Among ESTs contained in our SA clusters, the percentages were highly similar—0.1% of ESTs oriented with splicing sites had poly(A) tail on the opposite strand and 0.2% ESTs oriented with poly(A) signal and poly(A) tail had poly(A) tail on the opposite strand. In addition, in almost all the above cases there existed other sequences to support the orientation determined, for our pipeline had excluded singletons lacking two independent evidences. Thus the accuracy of the transcript orientation determined by our pipeline should be high.
One limitation of our pipeline is that we define transcript clusters by genomic overlaps, a strategy also used in several previous efforts (12,13). Although this approach helps to remove redundant ESTs, it runs the risk of mistakenly clustering multiple functionally unrelated components together. Other studies have clustered only transcriptional isoforms from the same genetic loci in the same orientation together, then identified cis-NATs by finding overlapping clusters on opposite strands (14,63). However, this approach is still not free of drawing function-unrelated genes together (31), and is more appropriate for high-quality full-length cDNA but not EST sequences.
With the enlarged candidate SA datasets in human, mouse and fly, and the new datasets in worm and six other species, we were able to shed light on some of the conflicting conclusions in previous reports, such as abundance of the divergent SA class and the functional bias of SA genes. Furthermore, applying the uniform identification pipeline to both vertebrate (human and mouse) and invertebrate (fly and worm) provides new information for the correlation between cis-NATs and X-inactivation proposed by Kiyosawa (16). Additionally, comparison across multiple species also enabled us to find a large number of conserved SA pairs, many of which (∼80%) even maintain the same overlapping pattern. Some SA pairs were conserved between non-mammalian and mammalian vertebrates. Such an ancient origin and the conservation of the overlapping pattern of the sense and antisense transcripts suggest that these SA pairs may have important functional roles in vivo and may be interesting candidates for experimental studies. It is important to note that even this enlarged dataset of conserved SA pairs is still far from complete for two reasons. First, many SA pairs are not yet discovered in species with insufficient mRNA/EST data; second, the HomoloGene database and our similarity criteria cannot cover all homologous genes.
Based on their overlapping pattern, we divided the SA pairs into six classes, pooling together classes previously suggested to have functional significance. Pioneering study by Lehner (9) grouped SA pairs into four groups: ‘Convergent’, ‘Divergent’, ‘Contained’ and ‘Intronic’. ‘Convergent’ SA pairs tend to be associated with regulatory elements in 3′-UTR, which might affect mRNA stability (1); ‘Divergent’ SA pairs might indicate co-regulated overlapping promoters (30); ‘Contained’ and ‘Intronic’ antisense transcripts have been suggested to regulate splicing of the sense pre-mRNAs (9). The ‘Complete’ class was proposed later due to its special genomic arrangement and high abundance (14,30). As a gene starts upstream and ends downstream of the other gene on the opposite strand, the former may be complementary to the promoter region of the latter and therefore had been suggested to inhibit the latter's transcription initiation (64,65). Finally, the ‘Other’ class was proposed for those SA pairs that were ‘difficult to classify’ (21). As the six classes of SA genes appear to have different functional implications, we chose such a detailed classification schema.
New technologies, such as genome tiling array or high-density array have indicated that the abundance of antisense transcripts in human and mouse may be much higher (14,66). These arrays can provide a high-level profile of possible SA loci. Although tremendously valuable, these possible loci, marked by short probes 25–60 nt in length, still need to be supported by transcript sequences to be useful. In addition, because of the high cost of genome tiling array and high-density array, they are available for only limited number of species and publicly available data are rare. On the contrary EST/mRNA data are the most abundant source of transcriptome data for many species. Thus we believe that EST/mRNA-based cis-NAT identification will continue to be useful, especially when it can be integrated with array data—a next step in our research. As more data from more sources become available, we will continue to update the cis-NAT datasets and the analysis.
SUPPLEMENTARY DATA
Supplementary Data are available at NAR Online.
Supplementary Material
Acknowledgments
The authors thank Drs Manyuan Long and Zicai Liang for insightful suggestions. The authors thank Drs Donna Karolchik and Liliana Florea for help with BLAT and SIM4. The authors thank Drs Philipp Bucher and Claudio Lottaz for help with ESTScan. The authors also thank two anonymous reviewers for helpful suggestions. This work was supported by China National Science Foundation (30550004), Ministry of Education ‘Grant for Talent of the New Century’, and ‘Program of Introducing Talents of Discipline to Universities’ (B06001). Funding to pay the Open Access publication charges for this article was provided by Chinese Ministry of Education ‘Program of Introducing Talents of Discipline to Universities’ (B06001).
Conflict of interest statement. None declared.
REFERENCES
- 1.Lavorgna G., Dahary D., Lehner B., Sorek R., Sanderson C.M., Casari G. In search of antisense. Trends Biochem. Sci. 2004;29:88–94. doi: 10.1016/j.tibs.2003.12.002. [DOI] [PubMed] [Google Scholar]
- 2.Vanhee-Brossollet C., Vaquero C. Do natural antisense transcripts make sense in eukaryotes? Gene. 1998;211:1–9. doi: 10.1016/s0378-1119(98)00093-6. [DOI] [PubMed] [Google Scholar]
- 3.Carmichael G.G. Antisense starts making more sense. Nat. Biotechnol. 2003;21:371–372. doi: 10.1038/nbt0403-371. [DOI] [PubMed] [Google Scholar]
- 4.Borsani O., Zhu J., Verslues P.E., Sunkar R., Zhu J.K. Endogenous siRNAs derived from a pair of natural cis-antisense transcripts regulate salt tolerance in Arabidopsis. Cell. 2005;123:1279–1291. doi: 10.1016/j.cell.2005.11.035. [DOI] [PMC free article] [PubMed] [Google Scholar]
- 5.Korostishevsky M., Kaganovich M., Cholostoy A., Ashkenazi M., Ratner Y., Dahary D., Bernstein J., Bening-Abu-Shach U., Ben-Asher E., Lancet D., et al. Is the G72/G30 locus associated with schizophrenia? single nucleotide polymorphisms, haplotypes, and gene expression analysis. Biol. Psychiatry. 2004;56:169–176. doi: 10.1016/j.biopsych.2004.04.006. [DOI] [PubMed] [Google Scholar]
- 6.Korneev S., O'Shea M. Natural antisense RNAs in the nervous system. Rev. Neurosci. 2005;16:213–222. doi: 10.1515/revneuro.2005.16.3.213. [DOI] [PubMed] [Google Scholar]
- 7.Rosok O., Sioud M. Systematic search for natural antisense transcripts in eukaryotes (review) Int. J. Mol. Med. 2005;15:197–203. [PubMed] [Google Scholar]
- 8.Fahey M.E., Moore T.F., Higgins D.G. Overlapping antisense transcription in the human genome. Compar. Funct. Genom. 2002;3:244–253. doi: 10.1002/cfg.173. [DOI] [PMC free article] [PubMed] [Google Scholar]
- 9.Lehner B., Williams G., Campbell R.D., Sanderson C.M. Antisense transcripts in the human genome. Trends Genet. 2002;18:63–65. doi: 10.1016/s0168-9525(02)02598-2. [DOI] [PubMed] [Google Scholar]
- 10.Li Y.Y., Qin L., Guo Z.M., Liu L., Xu H., Hao P., Su J., Shi Y., He W.Z., Li Y.X. In silico discovery of human natural antisense transcripts. BMC Bioinformatics. 2006;7:18. doi: 10.1186/1471-2105-7-18. [DOI] [PMC free article] [PubMed] [Google Scholar]
- 11.Chen N., Stein L.D. Conservation and functional significance of gene topology in the genome of Caenorhabditis elegans. Genome Res. 2006;16:606–617. doi: 10.1101/gr.4515306. [DOI] [PMC free article] [PubMed] [Google Scholar]
- 12.Chen J., Sun M., Kent W.J., Huang X., Xie H., Wang W., Zhou G., Shi R.Z., Rowley J.D. Over 20% of human transcripts might form sense-antisense pairs. Nucleic Acids Res. 2004;32:4812–4820. doi: 10.1093/nar/gkh818. [DOI] [PMC free article] [PubMed] [Google Scholar]
- 13.Yelin R., Dahary D., Sorek R., Levanon E.Y., Goldstein O., Shoshan A., Diber A., Biton S., Tamir Y., Khosravi R., et al. Widespread occurrence of antisense transcription in the human genome. Nat. Biotechnol. 2003;21:379–386. doi: 10.1038/nbt808. [DOI] [PubMed] [Google Scholar]
- 14.Katayama S., Tomaru Y., Kasukawa T., Waki K., Nakanishi M., Nakamura M., Nishida H., Yap C.C., Suzuki M., et al., editors. Antisense transcription in the mammalian transcriptome. RIKEN Genome Exploration Research Group and Genome Science Group (Genome Network Project Core Group) and the FANTOM Consortium. Science. 2005;309:1564–1566. doi: 10.1126/science.1112009. [DOI] [PubMed] [Google Scholar]
- 15.Reik W., Walter J. Genomic imprinting: parental influence on the genome. Nature Rev. Genet. 2001;2:21–32. doi: 10.1038/35047554. [DOI] [PubMed] [Google Scholar]
- 16.Kiyosawa H., Yamanaka I., Osato N., Kondo S., Hayashizaki Y. Antisense transcripts with FANTOM2 clone set and their implications for gene regulation. Genome Res. 2003;13:1324–1334. doi: 10.1101/gr.982903. [DOI] [PMC free article] [PubMed] [Google Scholar]
- 17.Wheeler D.L., Church D.M., Federhen S., Lash A.E., Madden T.L., Pontius J.U., Schuler G.D., Schriml L.M., Sequeira E., Tatusova T.A., et al. Database resources of the National Center for Biotechnology. Nucleic Acids Res. 2003;31:28–33. doi: 10.1093/nar/gkg033. [DOI] [PMC free article] [PubMed] [Google Scholar]
- 18.Karolchik D., Baertsch R., Diekhans M., Furey T.S., Hinrichs A., Lu Y.T., Roskin K.M., Schwartz M., Sugnet C.W., Thomas D.J., et al. The UCSC Genome Browser Database. Nucleic Acids Res. 2003;31:51–54. doi: 10.1093/nar/gkg129. [DOI] [PMC free article] [PubMed] [Google Scholar]
- 19.Steigele S., Nieselt K. Open reading frames provide a rich pool of potential natural antisense transcripts in fungal genomes. Nucleic Acids Res. 2005;33:5034–5044. doi: 10.1093/nar/gki804. [DOI] [PMC free article] [PubMed] [Google Scholar]
- 20.Gunasekera A.M., Patankar S., Schug J., Eisen G., Kissinger J., Roos D., Wirth D.F. Widespread distribution of antisense transcripts in the Plasmodium falciparum genome. Mol. Biochem. Parasitol. 2004;136:35–42. doi: 10.1016/j.molbiopara.2004.02.007. [DOI] [PubMed] [Google Scholar]
- 21.Shendure J., Church G.M. Computational discovery of sense-antisense transcription in the human and mouse genomes. Genome Biol. 2002;3 doi: 10.1186/gb-2002-3-9-research0044. research0044.1–0044.14. [DOI] [PMC free article] [PubMed] [Google Scholar]
- 22.Ashburner M., Ball C.A., Blake J.A., Botstein D., Butler H., Cherry J.M., Davis A.P., Dolinski K., Dwight S.S., Eppig J.T., et al. Gene ontology: tool for the unification of biology. The Gene Ontology Consortium. Nature Genet. 2000;25:25–29. doi: 10.1038/75556. [DOI] [PMC free article] [PubMed] [Google Scholar]
- 23.Kanehisa M., Goto S. KEGG: kyoto encyclopedia of genes and genomes. Nucleic Acids Res. 2000;28:27–30. doi: 10.1093/nar/28.1.27. [DOI] [PMC free article] [PubMed] [Google Scholar]
- 24.Kent W.J. BLAT-the BLAST-like alignment tool. Genome Res. 2002;12:656–664. doi: 10.1101/gr.229202. [DOI] [PMC free article] [PubMed] [Google Scholar]
- 25.Gopalan V., Tan T.W., Lee B.T., Ranganathan S. Xpro: database of eukaryotic protein-encoding genes. Nucleic Acids Res. 2004;32:D59–D63. doi: 10.1093/nar/gkh051. [DOI] [PMC free article] [PubMed] [Google Scholar]
- 26.Drysdale R.A., Crosby M.A. FlyBase: genes and gene models. Nucleic Acids Res. 2005;33:D390–D395. doi: 10.1093/nar/gki046. [DOI] [PMC free article] [PubMed] [Google Scholar]
- 27.Birney E., Andrews D., Bevan P., Caccamo M., Cameron G., Chen Y., Clarke L., Coates G., Cox T., Cuff J., et al. Ensembl 2004. Nucleic Acids Res. 2004;32:D468–D470. doi: 10.1093/nar/gkh038. [DOI] [PMC free article] [PubMed] [Google Scholar]
- 28.Chen J., Sun M., Hurst L.D., Carmichael G.G., Rowley J.D. Genome-wide analysis of coordinate expression and evolution of human cis-encoded sense-antisense transcripts. Trends Genet. 2005;21:326–329. doi: 10.1016/j.tig.2005.04.006. [DOI] [PubMed] [Google Scholar]
- 29.Wheeler D.L., Barrett T., Benson D.A., Bryant S.H., Canese K., Church D.M., DiCuccio M., Edgar R., Federhen S., Helmberg W., et al. Database resources of the National Center for Biotechnology Information. Nucleic Acids Res. 2005;33:D39–D45. doi: 10.1093/nar/gki062. [DOI] [PMC free article] [PubMed] [Google Scholar]
- 30.Munroe S.H. Diversity of antisense regulation in eukaryotes: multiple mechanisms, emerging patterns. J. Cell. Biochem. 2004;93:664–671. doi: 10.1002/jcb.20252. [DOI] [PubMed] [Google Scholar]
- 31.Morison I.M., Ramsay J.P., Spencer H.G. A census of mammalian imprinting. Trends Genet. 2005;21:457–465. doi: 10.1016/j.tig.2005.06.008. [DOI] [PubMed] [Google Scholar]
- 32.Nikaido I., Saito C., Mizuno Y., Meguro M., Bono H., Kadomura M., Kono T., Morris G.A., Lyons P.A., Oshimura M., et al. Discovery of imprinted transcripts in the mouse transcriptome using large-scale expression profiling. Genome Res. 2003;13:1402–1409. doi: 10.1101/gr.1055303. [DOI] [PMC free article] [PubMed] [Google Scholar]
- 33.Luedi P.P., Hartemink A.J., Jirtle R.L. Genome-wide prediction of imprinted murine genes. Genome Res. 2005;15:875–884. doi: 10.1101/gr.3303505. [DOI] [PMC free article] [PubMed] [Google Scholar]
- 34.Boyle E.I., Weng S., Gollub J., Jin H., Botstein D., Cherry J.M., Sherlock G. GO::TermFinder—open source software for accessing Gene Ontology information and finding significantly enriched Gene Ontology terms associated with a list of genes. Bioinformatics. 2004;20:3710–3715. doi: 10.1093/bioinformatics/bth456. [DOI] [PMC free article] [PubMed] [Google Scholar]
- 35.Mao X., Cai T., Olyarchuk J.G., Wei L. Automated genome annotation and pathway identification using the KEGG Orthology (KO) as a controlled vocabulary. Bioinformatics. 2005;21:3787–3793. doi: 10.1093/bioinformatics/bti430. [DOI] [PubMed] [Google Scholar]
- 36.Solda G., Boi S., Duga S., Fornasari D., Benfante R., Malcovati M., Tenchini M.L. In vivo RNA–RNA duplexes from human alpha3 and alpha5 nicotinic receptor subunit mRNAs. Gene. 2005;345:155–164. doi: 10.1016/j.gene.2004.12.005. [DOI] [PubMed] [Google Scholar]
- 37.Liu Q.R., Walther D., Drgon T., Polesskaya O., Lesnick T.G., Strain K.J., de Andrade M., Bower J.H., Maraganore D.M., Uhl G.R. Human brain derived neurotrophic factor (BDNF) genes, splicing patterns, and assessments of associations with substance abuse and Parkinson's Disease. Am. J. Med. Genet. B. Neuropsychiatr. Genet. 2005;134:93–103. doi: 10.1002/ajmg.b.30109. [DOI] [PubMed] [Google Scholar]
- 38.Reis E.M., Louro R., Nakaya H.I., Verjovski-Almeida S. As antisense RNA gets intronic. Omics. 2005;9:2–12. doi: 10.1089/omi.2005.9.2. [DOI] [PubMed] [Google Scholar]
- 39.Reis E.M., Nakaya H.I., Louro R., Canavez F.C., Flatschart A.V., Almeida G.T., Egidio C.M., Paquola A.C., Machado A.A., Festa F., et al. Antisense intronic non-coding RNA levels correlate to the degree of tumor differentiation in prostate cancer. Oncogene. 2004;23:6684–6692. doi: 10.1038/sj.onc.1207880. [DOI] [PubMed] [Google Scholar]
- 40.Blumenthal T., Evans D., Link C.D., Guffanti A., Lawson D., Thierry-Mieg J., Thierry-Mieg D., Chiu W.L., Duke K., Kiraly M., et al. A global analysis of Caenorhabditis elegans operons. Nature. 2002;417:851–854. doi: 10.1038/nature00831. [DOI] [PubMed] [Google Scholar]
- 41.Chen N., Harris T.W., Antoshechkin I., Bastiani C., Bieri T., Blasiar D., Bradnam K., Canaran P., Chan J., Chen C.K., et al. WormBase: a comprehensive data resource for Caenorhabditis biology and genomics. Nucleic Acids Res. 2005;33:D383–D389. doi: 10.1093/nar/gki066. [DOI] [PMC free article] [PubMed] [Google Scholar]
- 42.Misra S., Crosby M.A., Mungall C.J., Matthews B.B., Campbell K.S., Hradecky P., Huang Y., Kaminker J.S., Millburn G.H., Prochnik S.E., et al. Annotation of the Drosophila melanogaster euchromatic genome: a systematic review. Genome Biol. 2002;3 doi: 10.1186/gb-2002-3-12-research0083. research0083.1–0083.22. [DOI] [PMC free article] [PubMed] [Google Scholar]
- 43.Jones S.J., Riddle D.L., Pouzyrev A.T., Velculescu V.E., Hillier L., Eddy S.R., Stricklin S.L., Baillie D.L., Waterston R., Marra M.A. Changes in gene expression associated with developmental arrest and longevity in Caenorhabditis elegans. Genome Res. 2001;11:1346–1352. doi: 10.1101/gr.184401. [DOI] [PubMed] [Google Scholar]
- 44.Veeramachaneni V., Makalowski W., Galdzicki M., Sood R., Makalowska I. Mammalian overlapping genes: the comparative perspective. Genome Res. 2004;14:280–286. doi: 10.1101/gr.1590904. [DOI] [PMC free article] [PubMed] [Google Scholar]
- 45.Sun M., Hurst L.D., Carmichael G.G., Chen J. Evidence for a preferential targeting of 3′-UTRs by cis-encoded natural antisense transcripts. Nucleic Acids Res. 2005;33:5533–5543. doi: 10.1093/nar/gki852. [DOI] [PMC free article] [PubMed] [Google Scholar]
- 46.Hastings M.L., Ingle H.A., Lazar M.A., Munroe S.H. Post-transcriptional regulation of thyroid hormone receptor expression by cis-acting sequences and a naturally occurring antisense RNA. J. Biol. Chem. 2000;275:11507–11513. doi: 10.1074/jbc.275.15.11507. [DOI] [PubMed] [Google Scholar]
- 47.Gray T.A., Azama K., Whitmore K., Min A., Abe S., Nicholls R.D. Phylogenetic conservation of the makorin-2 gene, encoding a multiple zinc-finger protein, antisense to the RAF1 proto-oncogene. Genomics. 2001;77:119–126. doi: 10.1006/geno.2001.6627. [DOI] [PubMed] [Google Scholar]
- 48.Boi S., Solda G., Tenchini M.L. Shedding light on the dark side of the genome: overlapping genes in higher eukaryotes. Curr. Genomics. 2004;5:509–524. [Google Scholar]
- 49.Wutz A., Smrzka O.W., Schweifer N., Schellander K., Wagner E.F., Barlow D.P. Imprinted expression of the Igf2r gene depends on an intronic CpG island. Nature. 1997;389:745–749. doi: 10.1038/39631. [DOI] [PubMed] [Google Scholar]
- 50.Lipovich L., King M.C. Abundant novel transcriptional units and unconventional gene pairs on human chromosome 22. Genome Res. 2006;16:45–54. doi: 10.1101/gr.3883606. [DOI] [PMC free article] [PubMed] [Google Scholar]
- 51.Wang X.J., Gaasterland T., Chua N.H. Genome-wide prediction and identification of cis-natural antisense transcripts in Arabidopsis thaliana. Genome Biol. 2005;6:R30. doi: 10.1186/gb-2005-6-4-r30. [DOI] [PMC free article] [PubMed] [Google Scholar]
- 52.Crosthwaite S.K. Circadian clocks and natural antisense RNA. FEBS Lett. 2004;567:49–54. doi: 10.1016/j.febslet.2004.04.073. [DOI] [PubMed] [Google Scholar]
- 53.Alfano G., Vitiello C., Caccioppoli C., Caramico T., Carola A., Szego M.J., McInnes R.R., Auricchio A., Banfi S. Natural antisense transcripts associated with genes involved in eye development. Hum. Mol. Genet. 2005;14:913–923. doi: 10.1093/hmg/ddi084. [DOI] [PubMed] [Google Scholar]
- 54.Andreas W. Natural antisense transcripts. RNA Biol. 2005;2:53–62. doi: 10.4161/rna.2.2.1852. [DOI] [PubMed] [Google Scholar]
- 55.Ma J., Morrow D.J., Fernandes J., Walbot V. Comparative profiling of the sense and antisense transcriptome of maize lines. Genome Biol. 2006;7:R22. doi: 10.1186/gb-2006-7-3-r22. [DOI] [PMC free article] [PubMed] [Google Scholar]
- 56.Florea L., Hartzell G., Zhang Z., Rubin G.M., Miller W. A computer program for aligning a cDNA sequence with a genomic DNA sequence. Genome Res. 1998;8:967–974. doi: 10.1101/gr.8.9.967. [DOI] [PMC free article] [PubMed] [Google Scholar]
- 57.Florea L., Di Francesco V., Miller J., Turner R., Yao A., Harris M., Walenz B., Mobarry C., Merkulov G.V., Charlab R., et al. Gene and alternative splicing annotation with AIR. Genome Res. 2005;15:54–66. doi: 10.1101/gr.2889405. [DOI] [PMC free article] [PubMed] [Google Scholar]
- 58.Burset M., Seledtsov I.A., Solovyev V.V. Analysis of canonical and non-canonical splice sites in mammalian genomes. Nucleic Acids Res. 2000;28:4364–4375. doi: 10.1093/nar/28.21.4364. [DOI] [PMC free article] [PubMed] [Google Scholar]
- 59.Kim N., Shin S., Lee S. ASmodeler: gene modeling of alternative splicing from genomic alignment of mRNA, EST and protein sequences. Nucleic Acids Res. 2004;32:W181–W186. doi: 10.1093/nar/gkh404. [DOI] [PMC free article] [PubMed] [Google Scholar]
- 60.Nusbaum C., Zody M.C., Borowsky M.L., Kamal M., Kodira C.D., Taylor T.D., Whittaker C.A., Chang J.L., Cuomo C.A., Dewar K., et al. DNA sequence and analysis of human chromosome 18. Nature. 2005;437:551–555. doi: 10.1038/nature03983. [DOI] [PubMed] [Google Scholar]
- 61.Beaudoing E., Freier S., Wyatt J.R., Claverie J.M., Gautheret D. Patterns of variant polyadenylation signal usage in human genes. Genome Res. 2000;10:1001–1010. doi: 10.1101/gr.10.7.1001. [DOI] [PMC free article] [PubMed] [Google Scholar]
- 62.Legendre M., Gautheret D. Sequence determinants in human polyadenylation site selection. BMC Genomics. 2003;4:7. doi: 10.1186/1471-2164-4-7. [DOI] [PMC free article] [PubMed] [Google Scholar]
- 63.Okazaki Y., Furuno M., Kasukawa T., Adachi J., Bono H., Kondo S., Nikaido I., Osato N., Saito R., Suzuki H., et al. Analysis of the mouse transcriptome based on functional annotation of 60,770 full-length cDNAs. Nature. 2002;420:563–573. doi: 10.1038/nature01266. [DOI] [PubMed] [Google Scholar]
- 64.Nishida H., Tomaru Y., Oho Y., Hayashizaki Y. Naturally occurring antisense RNA of histone H2a in mouse cultured cell lines. BMC Genet. 2005;6:23. doi: 10.1186/1471-2156-6-23. [DOI] [PMC free article] [PubMed] [Google Scholar]
- 65.Akhmanova A., Kremer H., Miedema K., Hennig W. Naturally occurring testis-specific histone H3 antisense transcripts in Drosophila. Mol. Reprod. Dev. 1997;48:413–420. doi: 10.1002/(SICI)1098-2795(199712)48:4<413::AID-MRD1>3.0.CO;2-T. [DOI] [PubMed] [Google Scholar]
- 66.Cheng J., Kapranov P., Drenkow J., Dike S., Brubaker S., Patel S., Long J., Stern D., Tammana H., Helt G., et al. Transcriptional maps of 10 human chromosomes at 5-nucleotide resolution. Science. 2005;308:1149–1154. doi: 10.1126/science.1108625. [DOI] [PubMed] [Google Scholar]
Associated Data
This section collects any data citations, data availability statements, or supplementary materials included in this article.