

Abstract
Invasion of epithelial cells by Shigella flexneri is characterized by cytoskeletal rearrangements of the host cell membrane, promoting internalization of the bacterium. The bacterial effector IpaA is injected into the epithelial cell by a type III secretion apparatus and recruits vinculin to regulate actin polymerization at the site of entry. We analysed the complex formed between a carboxy-terminal fragment of IpaA (IpaA560−633) and the vinculin D1 domain (VD1), both in crystals and in solution. We present evidence that IpaA560−633 has two α-helical vinculin-binding sites that simultaneously bind two VD1 molecules. The interaction of IpaA560−633 with VD1 is highly similar to the interaction of the endogenous, eukaryotic proteins talin and α-actinin with VD1, showing that Shigella uses a structural mimicry strategy to activate vinculin.
Introduction
Vinculin (1,066 amino acids) is a central component of focal adhesion sites and adherens junctions, which provides a structural and functional link between F-actin and cell adhesion molecules of the cadherin and integrin families (Jockusch & Rüdiger, 1996). Vinculin interacts with many cellular components including talin, α-actinin, α-catenin, vasodilator-stimulated phospho protein, Arp2/3, paxillin and actin (Zamir & Geiger, 2001). The crystal structure of the closed conformation of vinculin showed that the amino-terminal D1 domain (vinculin D1 domain (VD1)) interacts with the carboxy-terminal tail domain, masking the binding sites for talin and α-actinin in VD1 and for F-actin in the carboxy-terminal tail domain (Bakolitsa et al, 2004; Borgon et al, 2004). On activation, vinculin is stabilized in an open conformation in which VD1 and the carboxy-terminal tail domain no longer interact (Jockusch & Rüdiger, 1996). The vinculin-binding sites (VBSs) of talin and α-actinin consist of one six-turn amphipathic α-helix. Insertion of a VBS between helices α1 and α2 of VD1 converts the VD1 N-terminal four-helix bundle into a five-helix bundle and distorts the VD1–carboxyl-terminal tail domain interface, suggesting a direct role for VBS binding in vinculin activation (Izard et al, 2004; Izard & Vonrhein, 2004; Papagrigoriou et al, 2004; Bois et al, 2005; Fillingham et al, 2005; Gingras et al, 2005). However, as VBSs are buried inside helical bundles in talin and α-actinin, the exact mechanisms that allow these molecules to activate vinculin are still under debate (Bois et al, 2006; Gingras et al, 2006; Patel et al, 2006).
Bacteria belonging to Shigella spp, the causative agents of bacillary dysentery in humans, invade epithelial cells. During entry, cytoskeletal rearrangements promote membrane ruffles around the bacterium, which leads to internalization of the bacterium within a vacuole. After lysis of the vacuole, the bacterium multiplies in the cytosol and spreads into neighbouring cells. Induction of membrane ruffles on epithelial cells depends on a virulence plasmid-encoded type III secretion (TTS) system (Parsot, 2005). Among the 25 proteins transiting through the TTS apparatus, IpaA, IpaB, IpaC and IpaD are crucial for entry. Entry is abolished by inactivation of ipaB, ipaC or ipaD and decreased tenfold by inactivation of ipaA (Ménard et al, 1993; Tran Van Nhieu et al, 1997). IpaC induces actin polymerization and triggers formation of filopodial and lamellipodial protrusions at the cell surface (Tran Van Nhieu et al, 1999). In an ipaA mutant, these protrusions are disorganized and do not allow efficient uptake of bacteria. By recruiting cytoskeletal proteins and regulating actin polymerization at the entry site, IpaA was proposed to organize the protrusions into a structure productive for entry of bacteria (Tran Van Nhieu et al, 1997).
An interaction between IpaA and vinculin was demonstrated both in vitro and in vivo (Tran Van Nhieu et al, 1997). Binding of IpaA to the N-terminal domain of vinculin stimulates the association of vinculin with F-actin and triggers, under certain conditions, depolymerization of actin filaments (Bourdet-Sicard et al, 1999). The last 74 residues of IpaA (IpaA560−633) contain two putative vinculin-binding motifs that conform to the consensus sequence proposed by Gingras et al (2005). We analysed complexes of this IpaA C-terminal fragment with VD1, both in crystals and in solution. We demonstrate that IpaA560–633 indeed has two VBSs and binds two VD1 molecules simultaneously. The close similarities between the binding modes of the bacterial virulence protein IpaA to VD1 and of the endogenous eukaryotic proteins talin and α-actinin to VD1 show that Shigella uses a structural mimicry strategy to activate vinculin. In addition, we propose that a third VBS is present in IpaA between residues 490 and 510.
Results and Discussion
The 2.74 Å resolution crystal structure of a reconstituted complex between VD1 and IpaA560−633 was determined by molecular replacement, using the structure of VD1 as a template. In electron density maps, 240 residues of VD1 were observed. Only the last 15 residues of the C-terminus and a loop between residues 23 and 33 were disordered. In addition, maps showed strong density for one α-helix located between helices α1 and α2 of VD1, transforming the N-terminal four-helix bundle of VD1 into a five-helix bundle (Fig 1). Apart from the 21 residues forming this six-turn helix, no density could be observed for the remaining parts of the VD1 interacting partner. A well-defined tyrosine side chain was observed within the first few N-terminal residues of the additional helix in the VD1/IpaA560−633 complex, providing a reliable starting point for identifying and building this α-helix (Fig 1A). Only two tyrosines are present in IpaA560−633, both of which are located in the N-terminal parts of predicted α-helices (residues 567 and 613 in α18 and α20, respectively). These putative helices are highly similar in sequence, with 11 out of their 21 residues being identical and four strongly similar (Fig 1A). Indeed, both could fit the density. The similar residues have well-defined density for their side chains and are mostly buried at the interface with VD1, whereas all non-conserved residues, located on the outer face of the helix, are exposed to the solvent and show no clear electron density for their side chains. In the refined structure, we modelled an ‘average' helix, in which identical residues of α18 and α20 were built with their side chains, whereas non-conserved residues were built as Ala. Attempts to model fully either α18 or α20, or to model both helices with 50% occupancy resulted in a substantial increase in Rfree in all cases. Intensity statistics of the diffraction data indicated the absence of crystal twinning, thus excluding twinning as a possible cause of the absence of clear electron density for the solvent-exposed side chains.
Figure 1.

Crystallographic analysis of IpaA560–633/VD1 complex. (A) Overall structure of the IpaA560−633/VD1 complex and portion of the final σA-weighted 2Fo−Fc electron density map at 1.2σ around the Tyr of IpaA at position 2. IpaA (21 residues corresponding to either α18 or α20) is in pink, and VD1 is rainbow-coloured from blue (amino terminus) to red (carboxyl terminus). For IpaA, the positions of the residues according to the consensus sequence are indicated. In the sequence of IpaA560−633 shown above, α18, α19 and α20 are in red. To the right, the sequence alignment of α18 and α20 is shown, with identical and similar residues in red and blue, respectively. These two helices are aligned with talin VBS1, VBS2 and VBS3 and the VBS consensus sequence. (A), (B), (C) and (D) show the structures of VD1 in complex with IpaA VBS (pink), talin VBS1 (yellow, PDB entry 1SYQ), VBS2 (red, PDB entry 1UH6) and VBS3 (orange, PDB entry 1RKC), respectively. All structures were superimposed using the Cα atoms of residues 1–250 of VD1 only, using the VD1/VBS1 structure as reference. Part (E) (rotated approximately 90° around the axis of the helix compared with A–D) shows the resulting (unbiased) superimposition of the four VBSs in a stick mode, using the same colour code. Conserved positions (1, 5, 8, 12, 16 and 19) of the consensus sequence are labelled, with the corresponding IpaA residues indicated in parentheses. VD1, vinculin D1 domain; VBS, vinculin-binding site.
The structure of the VD1/IpaA560−633 complex presents remarkable similarities with the structures of VD1 bound to individual VBSs of talin and of α-actinin (Izard et al, 2004; Izard & Vonrhein, 2004; Papagrigoriou et al, 2004; Bois et al, 2005; Fillingham et al, 2005; Gingras et al, 2005) (Fig 1). Superimposition of the N-terminal helix bundle of VD1 (Cα of residues 1–250) of four VD1/VBS complexes (VD1/IpaA, VD1/talin VBS1 (Protein Data Bank (PDB) entry 1SYQ), VBS2 (PDB entry 1UH6) and VBS3 (PDB entry 1RKC)) showed that only minor changes occur in the VD1 domain. VD1 bound to IpaA and VD1 bound to VBS2, which crystallized in the same crystal form, are almost identical, whereas small rearrangements, owing to different crystal contacts (rotation of the C-terminal helix bundle with respect to the N-terminal bundle and/or re-orientations of some helices), are observed in the other complexes crystallized in rhombohedral (VD1/VBS1) or tetragonal (VD1/VBS3) crystal forms. The bound helix of IpaA and the VBSs of talin are identically positioned within the N-terminal bundle of VD1 (Fig 1A–D) and adopt very similar conformations (Fig 1E). In all cases, small hydrophobic residues become buried at the interface with VD1, in agreement with the consensus sequence proposed for vinculin recognition (Gingras et al, 2005). In IpaA, these residues are also conserved in α18 and α20 (Fig 1A,E), suggesting that both α18 and α20 are VBSs. The only exception is the presence of a Lys (Lys-569), instead of an Ala, at position 4 of α18. This residue is not fully buried in the interface, but located at the side of the helix, suggesting that its larger side chain might be exposed to the solvent. Indeed, SPOT-peptide substitution analysis of talin VBS1 indicated that residues with large side chains, including Lys, are tolerated at this position (Gingras et al, 2005).
We used tryptophan fluorescence to investigate whether both helices bind to vinculin. No Trp residue is present in IpaA560−633, but modelling of Trp in place of Tyr in α18 and α20 indicated that the side chain of Trp could be accommodated in the structure and would be buried at the IpaA560−633/VD1 interface. This led us to construct two IpaA560−633 variants (IpaAY567W and IpaAY613W) by replacing Tyr-567 and Tyr-613 by Trp. If the Trp residue of IpaAY567W or IpaAY613W becomes buried on binding to VD1, a significant change in its fluorescence emission spectrum can be expected. For measurements, we used a Trp-less VD1 variant (VD1250) lacking the last 15 residues of VD1 that contain Trp-252 and Trp-257. As no electron density was observed in the crystal structure for VD1 residues 251–265, the removal of these residues was not expected to have an effect on IpaA binding. Fluorescence emission spectra of free IpaAY567W and IpaAY613W were similar, with a maximum at ≈345 nm (Fig 2), typical for a solvent-exposed Trp (Vivian & Callis, 2001). Addition of 1 equivalent of VD1250 induced a large and similar change in both spectra: the maximum became 13-nm blue-shifted and the intensity doubled (Fig 2). This indicates that both Trp567 and Trp613 become buried on addition of VD1250, demonstrating that α18 and α20 are both VBSs. As both helices bind to VD1, the crystal structure that we obtained probably corresponds to heterogeneous complexes of VD1 bound to either α18 or α20. SDS–polyacrylamide gel electrophoresis of washed crystals showed a clear band for VD1 but not for IpaA560−633 (data not shown). This result indicates that the linker between α18 and α20 is proteolysed during crystallization, explaining the absence of electron density beyond the bound α-helix. Moreover, crystal packing is incompatible with an intact IpaA560−633 fragment with residues 585–609 connecting α18/α20 helices in different asymmetric units.
Figure 2.
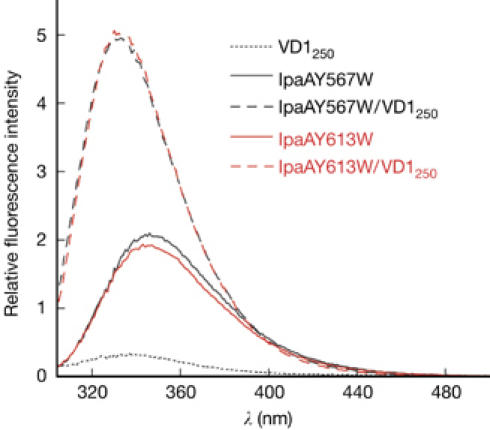
Fluorescence emission spectra of 1 μM solutions of IpaAY567W and IpaAY613W, alone and in the presence of VD1250 at 1:1 molar ratio. Excitation wavelength was 297 nm. VD1, vinculin D1 domain.
To investigate whether the two VBSs of IpaA560−633 bind two VD1 molecules simultaneously, mixtures of IpaA560−633 and VD1250 at various molar ratios were analysed by gel filtration (Fig 3). In mixtures containing an excess of IpaA560−633, both IpaA560−633/VD1250 and IpaA560−633/(VD1250)2 complexes, together with free IpaA560−633, were present in the solution. Increasing the proportion of VD1250 in the mixture led to increasing amounts of IpaA560−633/(VD1250)2 complexes and a decreasing amount of free IpaA560−633 (Fig 3B–H). Further addition of VD1250 gradually led to saturation of all IpaA560−633 VBSs, with only IpaA560−633/(VD1250)2 complexes and free VD1250 present in the solution (Fig 3I,K). These results show that the two VBSs present in this part of IpaA simultaneously bind two VD1 molecules with high affinity. Flexibility of the linker between the two VBSs, which is likely to occur considering its sensitivity to proteolysis, may facilitate the binding of two large VD1 molecules to IpaA560−633 by minimizing the risk of steric clashes. After talin (Fillingham et al, 2005; Patel et al, 2006), IpaA is the second protein for which simultaneous binding of several VD1 molecules is reported, supporting the proposal that proteins carrying several VBSs may activate several vinculin molecules (Izard & Vonrhein, 2004; Fillingham et al, 2005). Sequence alignment of the 20 predicted α-helices in IpaA further indicated that α15 (residues 490–510) has the characteristic features of a VBS, suggesting that IpaA might contain a third VBS. Gel filtration analysis with the entire C-terminal domain of IpaA (IpaAC, residues 394–633) and VD1250 in different molar ratios subsequently showed that IpaAC binds to VD1 and suggests simultaneous binding of up to three VD1 molecules by IpaAC (supplementary Fig S1 online). These results not only suggest that helix α15 indeed represents a third VBS of IpaA, but also confirm the relevance of our findings for the small IpaA560−633 fragment in the context of a much larger part of IpaA.
Figure 3.
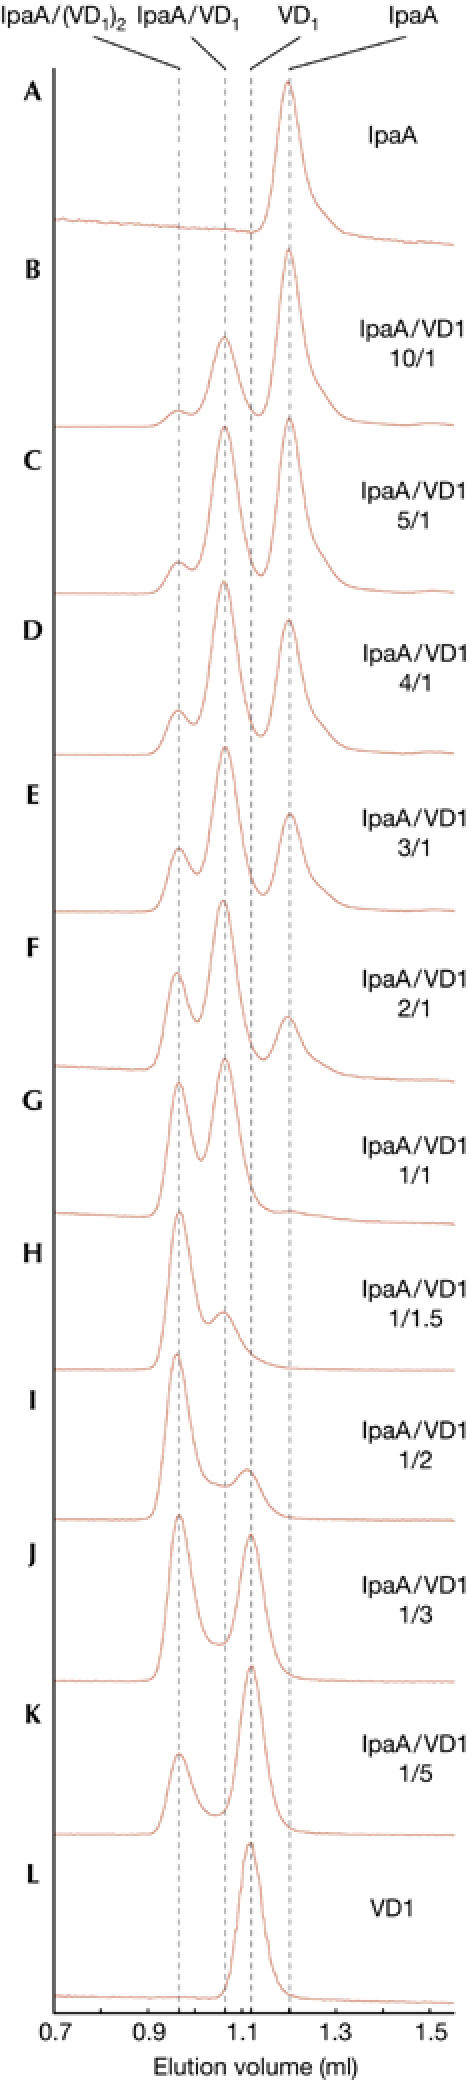
Gel filtration profiles of IpaA560−633/VD1 mixtures at different molar ratios, as indicated. Fractions were collected and analysed by SDS–polyacrylamide gel electrophoresis. VD1, vinculin D1 domain.
Activation of vinculin by IpaA is crucial for the formation of the focal adhesion-like structures that are productive for bacterial entry (Tran Van Nhieu et al, 1997). The similarity between the crystal structure of IpaA VBSs and of talin and α-actinin VBSs bound to VD1 constitutes a new example of structural mimicry used by a pathogen to manipulate cellular functions (Stebbins & Galán, 2001). In their native structures, talin and α-actinin have the hydrophobic side of their VBSs buried inside helical bundles that comprise their rod domains (Ylanne et al, 2001; Papagrigoriou et al, 2004; Bois et al, 2005; Fillingham et al, 2005; Gingras et al, 2006). Consequently, interactions of talin and α-actinin rods with vinculin (full-length or VD1) show a Kd in the micromolar range, whereas interactions of individual talin and α-actinin VBSs with VD1 have a Kd in the nanomolar range (McGregor et al, 1994; Izard & Vonrhein, 2004; Bois et al, 2005; Patel et al, 2006). By contrast, full-length IpaA binds to vinculin with high affinity (Kd of 5 nM) and interferes with the binding of full-length talin to vinculin (Bourdet-Sicard et al, 1999). This suggests that the VBSs are exposed and readily accessible in IpaA, possibly owing to their localization in the extreme C-terminal part of the protein. Such an architecture could explain the ability of IpaA to activate vinculin rapidly and efficiently at the site of bacterial entry.
Methods
Protein expression and purification. See the supplementary information online.
Crystallization, data collection and structure determination. The IpaA560−633/VD1 complex was crystallized by hanging-drop vapour diffusion at 293 K. Drops were a mixture of 1 μl of complex at 8.7 mg/ml with 1 μl of reservoir solution (100 mM Na-HEPES (pH 7.5), 10% 2-propanol and 20% PEG 4000). Very thin plates were obtained in 1–2 weeks. The mother liquor, supplemented with 20% glycerol, was used as cryoprotectant. A data set to 2.74 Å resolution was collected at BW7B (EMBL outstation at DESY, Hamburg). Data were processed with MOSFLM (Leslie, 2006) and programs from the CCP4 package (CCP4, 1994) (Table 1). The absence of twinning was confirmed with the program XTRIAGE (see http://www.phenix-online.org/). The structure was solved by molecular replacement using Phaser (McCoy et al, 2005). The starting model was the structure of VD1 in complex with talin VBS1 (PDB entry code 1SYQ; Izard & Vonrhein, 2004), in which the talin VBS1 helix was removed and the two four-helix bundles of VD1 (2–126 and 126–258) were treated as two independent models. The final model was obtained by cycles of manual building in XFIT (McRee, 1999) and refinement in Refmac5 with individual B-factor refinement for all atoms (Murshudov et al, 1999). Simulated annealing omit maps with IpaA atoms omitted were calculated with CNS (Brünger et al, 1998) during refinement. The coordinates and structure factors have been deposited in the PDB (access code 2GDC). Secondary structure prediction, performed with PSIPRED (McGuffin et al, 2000), suggested that IpaA possesses 20 α-helices. α18 is proposed to encompass residues 558–584, with much higher confidence for residues 564–584, whereas α19 and α20 are predicted between residues 587–599 and 612–629, respectively. In Fig 1, α18 and α20 are indicated on the basis of the 21 residues observed in the electron density maps (that is, spanning residues 564–584 and 610–630, respectively).
Table 1.
Data collection and refinement statistics
| Data collection | |
|---|---|
| Space group | P21212 |
| Unit cell (Å) | a=52.68; b=68.33; c=96.52 |
| Resolution (Å) | 15.18–2.74 (2.89–2.74) |
| Completeness (%) | 99.0 (100.0) |
| Mosaicity (deg) | 0.6 |
| Wavelength (Å) | 0.8423 |
| Redundancy | 4.7 |
| Unique reflections | 9,496 |
| I/σ(I) | 7.1 (2.1) |
| Rsym* (%) | 8.5 (35.1) |
| Refinement | |
| Resolution (Å) | 15.18–2.74 |
| R/Rfree‡ (%) | 24.7/29.4 |
| Total number of atoms | 2,007 |
| VD1 | 1,856 |
| IpaA | 137 |
| Water | 14 |
| Avg. B-factor (Å2) | 41.5 |
| VD1 | 41.8 |
| IpaA | 38.7 |
| Water | 32.8 |
| R.m.s.d. bonds (Å)/angles (deg) | 0.016/1.58 |
| Ramachandran plot: residues in | |
| Most favoured region | 94.50% |
| Additional favoured region | 4.30% |
| Generously favoured region | 0.80% |
| Disallowed region | 0.40% |
Values in parentheses are for the last resolution shell.
VD1, vinculin D1 domain
*Rsym=∑∣I–〈I〉∣/∑I, where I is the observed intensity and 〈I〉 the average intensity.
‡R=∑hkl,work∣∣Fobs∣−k∣Fcalc∣∣/∑hkl∣Fobs∣100%, where Fobs=observed structure factor and Fcalc=calculated structure factor. Rfree=R calculated with 5% of randomly selected data that were omitted from the refinement.
Fluorescence and size-exclusion chromatography. Tryptophan fluorescence measurements were performed on a Fluorolog3-22 (HORIBA Jobin Yvon) fluorometer. Excitation was at 297 nm and the excitation and emission bandpasses were set at 2 nm. Experiments were performed at 293 K. Solutions (1 μM) of IpaAY567W and IpaAY613W were prepared in 20 mM Tris/acetate (pH 7.6) and 150 mM NaCl. VD11−250 from concentrated stock solution (45 μM) was subsequently added to the IpaA solutions to a final concentration of 1 μM. Emission signals were corrected for background buffer solutions (with or without VD11−250) and for instrument response.
Analytical gel filtration with IpaA560–633/VD11−250 mixtures was carried out using a Superdex75 PC 3.2/30 column mounted on a SMART system (Pharmacia GE Healthcare Europe GmbH, Diegem, Belgium) at 293 K. Elution buffer was 20 mM Tris/acetate (pH 7.4), 150 mM NaCl and 1 mM EDTA. Detection was performed simultaneously at 278 (not shown) and 225 nm with a cell path length of 1 cm. Injected samples consisted of 20 μl of IpaA560−633/VD11−250 mixtures at 10/1, 5/1, 4/1, 3/1, 2/1, 1/1, 1/1.5, 1/2, 1/3 and 1/5 molar ratios. In all cases, the VD11−250 concentration in the mixture was 35 μM. Solutions were prepared and incubated for 25 min on ice before injection. Protein concentrations were experimentally determined using the Beer–Lambert law, with extinction coefficients calculated from their amino-acid sequence using the tools on the ExPASy Server.
Supplementary information is available at EMBO reports online (http://www.emboreports.org).
Supplementary Material
Supplementary Information
Acknowledgments
We thank G. Tran Van Nhieu and N. Ramarao for the kind gift of plasmids encoding GST–IpaA560−633 and MBP–vinculin, F. Fusetti for MS analysis and R. Scheek for fruitful discussions. We also acknowledge the support of the staff from the EMBL beam line BW7B at DESY, Hamburg. This work was supported by the Netherlands Foundation for Scientific Research (NWO).
References
- Bakolitsa C, Cohen DM, Bankston LA, Bobkov AA, Cadwell GW, Jennings L, Critchley DR, Craig SW, Liddington RC (2004) Structural basis for vinculin activation at sites of cell adhesion. Nature 430: 583–586 [DOI] [PubMed] [Google Scholar]
- Bois PR, Borgon RA, Vonrhein C, Izard T (2005) Structural dynamics of α-actinin–vinculin interactions. Mol Cell Biol 25: 6112–6122 [DOI] [PMC free article] [PubMed] [Google Scholar] [Research Misconduct Found]
- Bois PR, O'Hara BP, Nietlispach D, Kirkpatrick J, Izard T (2006) The vinculin binding sites of talin and α-actinin are sufficient to activate vinculin. J Biol Chem 281: 7228–7236 [DOI] [PubMed] [Google Scholar]
- Borgon RA, Vonrhein C, Bricogne G, Bois PR, Izard T (2004) Crystal structure of human vinculin. Structure 12: 1189–1197 [DOI] [PubMed] [Google Scholar]
- Bourdet-Sicard R, Rüdiger M, Jockusch BM, Gounon P, Sansonetti PJ, Tran Van Nhieu G (1999) Binding of the Shigella protein IpaA to vinculin induces F-actin depolymerization. EMBO J 18: 5853–5862 [DOI] [PMC free article] [PubMed] [Google Scholar]
- Brünger AT et al. (1998) Crystallography and NMR system: a new software suite for macromolecular structure determination. Acta Crystallogr D 54: 905–921 [DOI] [PubMed] [Google Scholar]
- Collaborative Computational Project Number 4 (CCP4) (1994) The CCP4 suite: programs for protein crystallography. Acta Crystallogr D 50: 760–763 [DOI] [PubMed] [Google Scholar]
- Fillingham I, Gingras AR, Papagrigoriou E, Patel B, Emsley J, Critchley DR, Roberts GC, Barsukov IL (2005) A vinculin binding domain from the talin rod unfolds to form a complex with the vinculin head. Structure 13: 65–74 [DOI] [PubMed] [Google Scholar]
- Gingras AR, Ziegler WH, Frank R, Barsukov IL, Roberts GC, Critchley DR, Emsley J (2005) Mapping and consensus sequence identification for multiple vinculin binding sites within the talin rod. J Biol Chem 280: 37217–37224 [DOI] [PubMed] [Google Scholar]
- Gingras AR, Vogel KP, Steinhoff HJ, Ziegler WH, Patel B, Emsley J, Critchley DR, Roberts GC, Barsukov IL (2006) Structural and dynamic characterization of a vinculin binding site in the talin rod. Biochemistry 45: 1805–1817 [DOI] [PubMed] [Google Scholar]
- Izard T, Vonrhein C (2004) Structural basis for amplifying vinculin activation by talin. J Biol Chem 279: 27667–27678 [DOI] [PubMed] [Google Scholar]
- Izard T, Evans G, Borgon RA, Rush CL, Bricogne G, Bois PR (2004) Vinculin activation by talin through helical bundle conversion. Nature 427: 171–175 [DOI] [PubMed] [Google Scholar]
- Jockusch BM, Rüdiger M (1996) Crosstalk between cell adhesion molecules: vinculin as a paradigm for regulation by conformation. Trends Cell Biol 6: 311–315 [DOI] [PubMed] [Google Scholar]
- Leslie AG (2006) The integration of macromolecular diffraction data. Acta Crystallogr D 62: 48–57 [DOI] [PubMed] [Google Scholar]
- McCoy AJ, Grosse-Kunstleve RW, Storoni LC, Read RJ (2005) Likelihood-enhanced fast translation functions. Acta Crystallogr D 61: 458–464 [DOI] [PubMed] [Google Scholar]
- McGregor A, Blanchard AD, Rowe AJ, Critchley DR (1994) Identification of the vinculin-binding site in the cytoskeletal protein α-actinin. Biochem J 301: 225–233 [DOI] [PMC free article] [PubMed] [Google Scholar]
- McGuffin LJ, Bryson K, Jones DT (2000) The PSIPRED protein structure prediction server. Bioinformatics 16: 404–405 [DOI] [PubMed] [Google Scholar]
- McRee DE (1999) XtalView/Xfit—a versatile program for manipulating atomic coordinates and electron density. J Struct Biol 125: 156–165 [DOI] [PubMed] [Google Scholar]
- Ménard R, Sansonetti PJ, Parsot C (1993) Nonpolar mutagenesis of the ipa genes defines IpaB, IpaC, and IpaD as effectors of Shigella flexneri entry into epithelial cells. J Bacteriol 175: 5899–5906 [DOI] [PMC free article] [PubMed] [Google Scholar]
- Murshudov GN, Vagin AA, Lebedev A, Wilson KS, Dodson EJ (1999) Efficient anisotropic refinement of macromolecular structures using FFT. Acta Crystallogr D 55: 247–255 [DOI] [PubMed] [Google Scholar]
- Papagrigoriou E et al. (2004) Activation of a vinculin-binding site in the talin rod involves rearrangement of a five-helix bundle. EMBO J 23: 2942–2951 [DOI] [PMC free article] [PubMed] [Google Scholar]
- Parsot C (2005) Shigella spp. and enteroinvasive Escherichia coli pathogenicity factors. FEMS Microbiol Lett 252: 11–18 [DOI] [PubMed] [Google Scholar]
- Patel BC et al. (2006) The activity of the vinculin binding sites in talin is influenced by the stability of the helical bundles that make up the talin rod. J Biol Chem 281: 7458–7467 [DOI] [PubMed] [Google Scholar]
- Stebbins CE, Galán JE (2001) Structural mimicry in bacterial virulence. Nature 412: 701–705 [DOI] [PubMed] [Google Scholar]
- Tran Van Nhieu G, Ben Ze'ev A, Sansonetti PJ (1997) Modulation of bacterial entry into epithelial cells by association between vinculin and the Shigella IpaA invasin. EMBO J 16: 2717–2729 [DOI] [PMC free article] [PubMed] [Google Scholar]
- Tran Van Nhieu G, Caron E, Hall A, Sansonetti PJ (1999) IpaC induces actin polymerization and filopodia formation during Shigella entry into epithelial cells. EMBO J 18: 3249–3262 [DOI] [PMC free article] [PubMed] [Google Scholar]
- Vivian JT, Callis PR (2001) Mechanisms of tryptophan fluorescence shifts in proteins. Biophys J 80: 2093–2109 [DOI] [PMC free article] [PubMed] [Google Scholar]
- Ylanne J, Scheffzek K, Young P, Saraste M (2001) Crystal structure of the α-actinin rod reveals an extensive torsional twist. Structure 9: 597–604 [DOI] [PubMed] [Google Scholar]
- Zamir E, Geiger B (2001) Molecular complexity and dynamics of cell–matrix adhesions. J Cell Sci 114: 3583–3590 [DOI] [PubMed] [Google Scholar]
Associated Data
This section collects any data citations, data availability statements, or supplementary materials included in this article.
Supplementary Materials
Supplementary Information