

Abstract
We have examined whether replication of the chicken β-globin locus changes during differentiation of primary erythroid progenitors into erythrocytes. In undifferentiated progenitors, four principal initiation sites and a replication fork pausing region (RFP) were observed. Forty-eight hours after induction of differentiation, the principal sites were maintained, even in the activated βA-globin gene, some minor sites were enhanced, three new sites appeared and the RFP disappeared. One of the activated origins showed increased histone H3 K9K14 diacetylation, but the others did not. These results demonstrate a broadening of DNA replication origin usage during differentiation of untransformed metazoan cells and indicate that histone H3 diacetylation, other histone modifications so far reported and transcription are not crucial determinants of origin selection in this system.
Keywords: chromatin, differentiation, erythroid progenitors, DNA replication origins, histone acetylation
Introduction
Replication is initiated at specific locations along the chromosomes of animal cells (for a review, see Gilbert, 2004). Origin types range from highly specific, efficient initiation sites (Kitsberg et al, 1993) to broad zones of multiple, inefficient sites (Dijkwel et al, 2002). No clear consensus sequence has emerged from characterized origins. Origin specification is thought to involve recognition of structural and functional features of chromatin and not simply DNA sequences.
Origin usage is developmentally regulated. In Xenopus and Drosophila, initiation sites are distributed at random sequences in early embryos, but are confined to intergenic spacers at the onset of zygotic transcription, and are further rarefied during later development (Hyrien et al, 1995; Maric et al, 1999; Sasaki et al, 1999). Origin modulation by transcription was also reported for the initiation zone located downstream of the Chinese hamster ovary (CHO) dihydrofolate reductase (DHFR) gene. Promoter deletions that eliminate transcription allow the body of the DHFR gene to become a template for initiation (Saha et al, 2004). Conversely, invasion of the initiation zone by the transcription machinery, owing to deletions of the 3′ end of the gene, inactivate the origins (Mesner & Hamlin, 2005). Thus, potential origins seem to be widespread, but transcription can inactivate them. In the fly Sciara, transcriptional regulation has also been associated with the contraction of an initiation zone during DNA puff II/9A amplification. The initiation zone spans two quiescent transcription units in pre-amplification stages, but contracts to a small area upstream of the genes simultaneously with the appearance of RNA polymerase II at the upstream gene promoter, but before intense transcription (Lunyak et al, 2002). Conversely, the binding of transcription factors to plasmid DNA can increase initiation at the factor binding site in Xenopus egg extracts (Danis et al, 2004), and the mapping of origins and RNA polymerase II along a Drosophila chromosome suggests that transcription somehow facilitates ORC localization (MacAlpine et al, 2004). Thus, cellular differentiation might influence replication initiation by a variety of mechanisms.
Developmental activation of cell-type-specific origins was first reported in the slime mould Physarum polycephalum (Maric et al, 2003) and recently for the murine IgH locus (Norio et al, 2005). Owing to the limited resolution (∼5 kb) with which the latter origins were mapped, it remains unclear whether their activation correlates with specific changes in chromatin structure. Moreover, this report compared cell lines but did not document dynamic changes as they occured (Gilbert, 2005).
We report here, for the first time, dynamic metazoan origin activation using a homogeneous ex vivo differentiation system. We have analysed how the replication of the chicken β-globin locus and surrounding sequences changes during differentiation into erythrocytes. The 55 kb region studied contains four independent chromatin domains: a folate receptor (FR) gene, a 16 kb stretch of condensed chromatin, the 30 kb β-globin gene cluster and an olfactory receptor gene, separated from one another by three DNase I-hypersensitive sites (HSA, 5′HS4 and 3′HS; Fig 1B). Previously, we analysed the replication initiation pattern of the FR/β-globin region in the transformed 6C2 cell line (Prioleau et al, 2003). The 6C2 cell line mimics the colony forming units-erythroid (CFU-E) stage, which precedes the final differentiation in erythrocytes. We identified four replication origins located at the 5′HS4 insulator, 5′ and 3′ of the silent ρ-globin gene and over a broader 1.5 kb region that covers the βA-globin gene and its promoter. We showed that the four origins fire early in S phase, even though they harbour different epigenetic modifications. The 5′HS4 origin has unmethylated CpGs and hyperacetylated histones, whereas the other origins have methylated CpGs (if any) and hypoacetylated histones. Significant histone acetylation is only found over HSA and 5′HS4 in these cells. None of these epigenetic marks seems to be an obligatory feature of active origins. Conversely, the overall condensed chromatin structure of the locus in 6C2 cells may restrain initiation to specific sites by suppressing weak potential origins. To test this possibility, we looked at whether initiation becomes more dispersed during later differentiation, when the β-globin locus starts to decondense.
Figure 1.
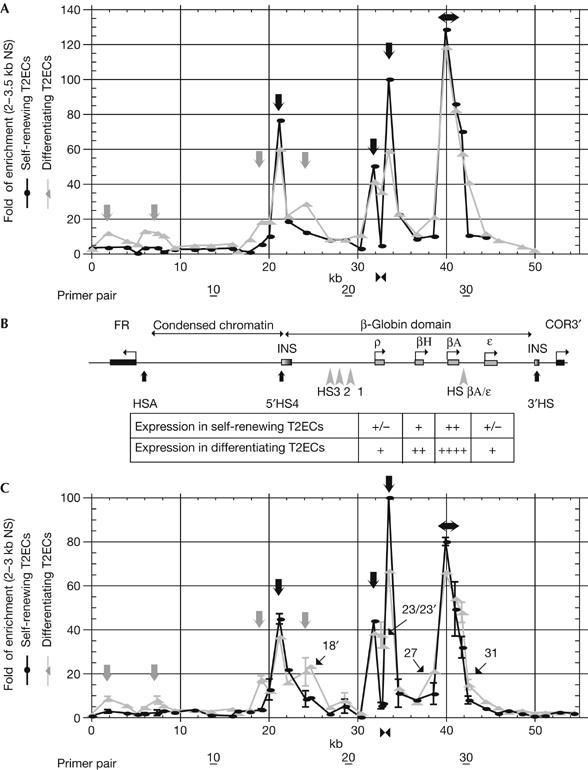
Activation of tissue-specific origins during erythroid differentiation. (A, C) Fold of enrichments of 2.0–3.5 kb (A) and 2.0–3.0 kb (C) nascent strands (NS) extracted from two independently prepared batches of either self-renewing T2ECs (black circles) or 48 h differentiating T2ECs (grey triangles) and quantified by real-time PCR. Each quantification was repeated at least twice. Error bars indicate standard deviation for samples quantified four or six times. The scale corresponds to fold of enrichments over the background. The abscissa scale is map position (nucleotide number). Black and grey arrows in the graph point towards constitutive and differentiation-activated origins, respectively. The horizontal double arrow over the βA-globin gene indicates a 1.5 kb zone of initiation. The position of a bidirectional replication fork pausing site inside the ρ-globin gene in self-renewing T2ECs is shown below each graph (double black arrowheads). The positions of primer pairs 10, 20 and 30 are shown further below. Additional primer pairs (18′, 23′, 36, 37, 38 and 39) were used for the differentiation shown in (C). The position of primer pairs 18′, 23′, 27 and 31 is shown inside the graph. (B) Map of the folate receptor gene, condensed chromatin region, β-globin domain and olfactory receptor gene (COR3′). DNase I hypersensitive sites (HSs; HSA, HS1–3, HS βA/ɛ, 5′HS4 and 3′HS) are indicated. Expression of globin genes in self-renewing and differentiating T2ECs is indicated below the map. +/− and ++++ indicate weak and very strong expression, respectively.
Results And Discussion
In vitro differentiation of chicken erythroid progenitors
We used recently developed methods to obtain large amounts of normal chicken erythrocytic progenitors and induce their differentiation into erythrocytes ex vivo (Gandrillon et al, 1999). In this system, immature eythrocytic progenitors, purified from chick bone marrow, are maintained in culture with transforming growth factor (TGF)-α, TGF-β and dexamethasone at an early immature stage (late burst forming units-erythroid (BFU-E) to early CFU-E). These normal avian progenitors, referred to as T2ECs, can be induced to synchronously undergo terminal differentiation in erythrocytes by withdrawal of TGF-α, TGF-β and dexamethasone, and by the addition of anaemic chicken serum plus insulin. The synchronous progression of differentiation was confirmed by a decrease in the expression of the immature-specific MEP26 antigen and an increase in the expression of the mature-specific antigen JS4 (supplementary Fig S1A online). As shown in supplementary Fig S1B online, activation of globin genes started during the first cell division after induction of differentiation.
To map replication origins in the chicken FR/β-globin region, we quantified the abundance of short nascent strands at different positions along this region before and after induction of differentiation in two independent batches of cells (Fig 1A,C). As a negative control, we used a primer pair located upstream of the lysozyme locus, a region confirmed to lack initiation activity (Prioleau et al, 2003). So far, we have not found regions that give a lower enrichment than this locus (our unpublished data). The fold of enrichment of short nascent strands was therefore calculated with respect to the lysozyme-negative control, which was taken as background. Only those enrichments that were reproducibly higher than fourfold were considered to be significant.
Replication initiation profile of undifferentiated T2ECs
In self-renewing T2ECs (Fig 1, dark circles), the enrichment of nascent strands ranged from one- to threefold over the FR gene, the condensed chromatin region and 3′ of the β-globin gene, suggesting a lack of significant initiation in all these regions. Four discrete peaks, however, of significant initiation (Fig 1, black arrows above black circles) were reproducibly observed at the 5′HS4 insulator (76-fold enrichment in Fig 1A and 47-fold enrichment in Fig 1C), upstream (50- and 44-fold) and downstream (100- and 100-fold) of the ρ-globin gene and over the βA-globin gene and promoter (128- and 80-fold). In addition, most of the remaining primer pairs located between HS4 and the ɛ-gene showed enrichments of 4- to 12-fold, raising the possibility that the entire β-globin locus is a single large initiation zone. The similarity of the profiles shown in Fig 1A,C illustrates the high reproducibility of the results. Furthermore, the initiation profile of undifferentiated T2ECs was virtually identical to that of the transformed 6C2 cell line (Prioleau et al, 2003), showing that it is not affected by cellular transformation.
Activation of novel origins during differentiation
After only 48 h of differentiation, which corresponds to two cell cycles, an increase in the number of potential initiation sites was observed (Fig 1, grey triangles). Although the four principal sites of initiation observed before differentiation were maintained (black arrows), three previously ‘dormant' origins were activated (grey arrows) upstream (12- and 8-fold) and downstream (12- and 8-fold) of the FR gene, and 5′ (18- and 17-fold) of HS4. In addition, a threefold increase in nascent strand enrichment was observed at the previously active site located 3′ of HS4 (final enrichments, 28- and 21-fold). Nascent strand enrichment in the 16 kb condensed chromatin region and 3′ of the β-globin gene remained in the one- to fivefold range, suggesting a lack of significant initiation, as in undifferentiated T2ECs. All these constitutive and tissue-specific origins were confirmed by analysing the 1.0–1.5 kb nascent strand fraction from the same batch of differentiating T2ECs as in Fig 1A (supplementary Fig S2 online). We also reproducibly observed an increase in nascent strand enrichment upstream (primer pair 27) and downstream (primer pair 31) of the βA-globin gene (Fig 1). The increased enrichments observed around 5′HS4 and the βA-globin gene might be interpreted as a broadening of origin usage in the β-globin initiation zone rather than as activation of a small number of discrete sites. Given the already high density of probes we used, testing these alternative interpretations is beyond the resolution of techniques that are available at present. A high-resolution mapping study of the 55 kb CHO DHFR ‘initiation zone' has previously suggested that it consists of a minimum of 20 (and possibly much more) inefficient initiation sites (Dijkwel et al, 2002).
The strong initiation signal over the βA-globin gene was confirmed by probing 0.8–1.2 and 1.0–1.5 kb nascent strands from two independent batches of differentiated T2ECs with primer pair 29 (Fig 2A; supplementary Fig S2 online). As this amplicon is located in the middle of the 1.5 kb βA-globin gene, this result demonstrates that initiation occurred in the coding region. Therefore, induction of βA expression did not repress initiation in the gene, in contrast with the situation observed for the CHO DHFR gene (Mesner & Hamlin, 2005). Our data are consistent with previous observations that transcription does not restrict initiation inside the coding region of the murine β-globin locus (Aladjem et al, 2002).
Figure 2.
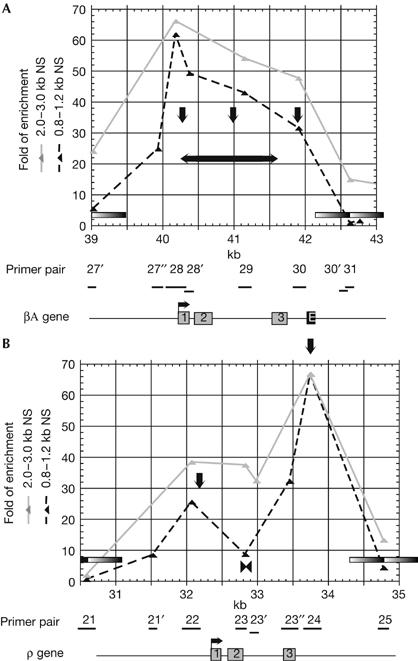
Nascent strand maturation analysis around the ρ- and βA-globin genes. Fold of enrichments of 0.8–1.2 kb (black triangles) and 2.0–3.0 kb (grey triangles) nascent strands (NS) extracted from the same batch of differentiating T2ECs as in Fig 1B and quantified with primer pairs inside and around the βA-gene (A) or the ρ-gene (B). Each quantification was performed twice. Below the graph, the coding regions of ρ- and βA-globin genes are shown. Grey rectangles, exons 1–3; black rectangle, βA/ɛ enhancer; black bars, amplicons used for real-time PCR quantifications. Grey bars inside graphs delineate 1 kb regions devoid of origin activity because of being centred on a primer pair that gives enrichment close to background level. Vertical and horizontal black arrows indicate origins and initiation zones, respectively. Parts (A, B) demonstrate continued initiation in the βA-gene and downregulation of the ρ-gene replication fork barrier, respectively, in differentiating cells.
Changes in nascent strand abundance over the ρ-gene
We previously observed that, in 6C2 cells, the abundance of nascent strands up to 5 kb in size was very low over the body of the ρ-gene, despite the close proximity of two flanking origins, and we interpreted this to suggest that replication forks orientated in either direction pause at several positions inside the ρ-globin gene (Prioleau et al, 2003). We observed a similar, anomalously low enrichment of short nascent strands with primer pair 23 in undifferentiated T2ECs, suggesting that replication forks also pause inside the ρ-globin gene in these cells (Fig 1, black double arrow below the graphs). The sharpness of the peaks flanking the putative replication fork pausing region (RFP) is nevertheless surprising. If forks moving to the right from marker 22 and to the left from marker 24 are arrested inside the ρ-gene, then the only way nascent strands initiated around primers 22 and 24 could grow to 2.0–3.5 kb is by growing past primers 21 and 25, respectively. However, primers 21 and 25 did not amplify their target sequences to an extent equal to primers 22 and 24 (Fig 1), although they did when 4.0–5.0 kb nascent strands were analysed (Prioleau et al, 2003). This discrepancy suggests that nascent strands from this region might migrate faster than their estimated size in sucrose gradients, or that nascent strands might turnover very rapidly from less than 2.0 kb to more than 3.5 kb on both sides of marker 23. In differentiating T2ECs, however, a strong (37- and 35-fold) enrichment of nascent strands was detected with primer pair 23, suggesting that replication forks then progressed unimpeded inside the ρ-globin gene (Fig 1, grey triangles). Identical results were obtained with primer pair 23′ (supplementary Table S1 online) located 3′ of primer pair 23 and overlapping it by 5 bp (Figs 1C, 2B). Analysis of 0.8–1.2 and 1.0–1.5 kb nascent strands showed that this change did not result from activation of a new origin inside the ρ-globin gene, because initiation was only detected 5′ and 3′ of the ρ-globin gene (Fig 2B; supplementary Fig S2 online). Although we cannot formally exclude the fact that unknown factors might affect the stability of replication intermediates, we suggest that an RFP inside the ρ-gene is downregulated during erythroid cell differentiation. Developmental regulation of multiple RFPs has been previously observed in Xenopus ribosomal DNA at the gastrula and neurula stages (Maric et al, 1999).
Differentiation-induced changes in histone acetylation
Histone tails are extensively modified along the β-globin locus during red-blood-cell differentiation. It was reported that only 5′HS4 is hyperacetylated in 6C2 cells, whereas in mature erythrocytes hyperacetylated histones H3 and H4 are distributed fairly uniformly over the whole locus (Litt et al, 2001b). How these modifications are established during the last six cell cycles before G1 arrest is not known. Therefore we mapped diacetylated K9 and K14 histone H3 in self-renewing and differentiating T2ECs by chromatin immunoprecipitation using two independently derived batches of cells (Fig 3A,B). In undifferentiated T2ECs, four regions of increased diacetylation of histone H3 were observed around (i) the FR promoter, (ii) the 5′HS4 insulator, (iii) the HS321 region and (iv) the βA-gene and downstream sequences in two independent experiments (Fig 3, dark circles). The histone acetylation pattern around the FR promoter and the 5′HS4 insulator did not change on differentiation (Fig 3, grey triangles). We have therefore arbitrarily set the relative recovery of diacetylated histone H3 at 100% for primer pair 5. In contrast, the relative recovery of diacetylated histone H3 over the HS321 region and the βA-gene increased 2- to 8- and 8- to 13-fold, respectively, on differentiation of T2ECs (the slight variation in the basal level of acetylation in undifferentiated cells probably reflects the variable background of spontaneously differentiating cells). To evaluate the coordination of replication origin activation with histone H3 diacetylation, we placed in Fig 3A black and grey vertical arrows corresponding to constitutive and differentiation-activated origins, respectively. As shown by the star, the enhanced activity of the origin located between HS4 and HS3 was concomitant with an increase in histone H3 diacetylation. Activation of the three previously dormant origins, however, was not accompanied by any change in histone H3 diacetylation. Two (3′ of the FR gene, 5′ of the HS4 insulator) were associated with very low levels of histone H3 diacetylation in both undifferentiated and differentiating T2ECs, whereas the third (in the FR gene upstream sequences) was significantly acetylated in both. Finally, we noted that the RFP located over the ρ-gene and downregulated during differentiation was also associated with a very low level of histone H3 diacetylation in both undifferentiated and differentiating T2ECs.
Figure 3.
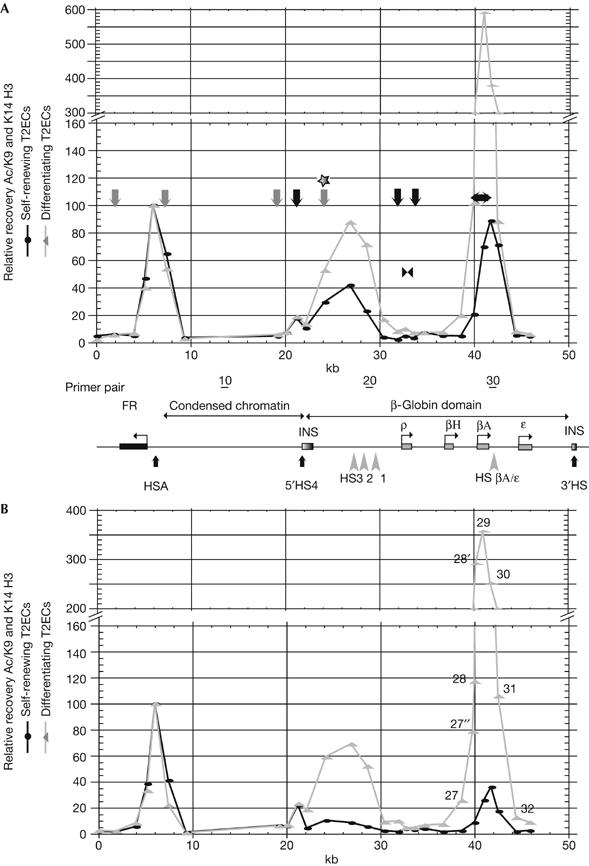
Changes in histone H3 diacetylation during differentiation and comparison with replication changes. Relative recovery of crosslinked protein–DNA complexes recovered after immunoprecipitation with anti-K9K14 diacetylated histone H3 antibody from self-renewing T2ECs (black circles) or 48 h differentiating T2ECs (grey triangles) as determined by real-time PCR with 27 primer pairs (1–7 and 13–33). Results with two independent batches of cells are shown (A, B). Each data point is the mean of two different immunoprecipitations from the same sample of crosslinked chromatin. The ordinate is a relative recovery (% Ac/K9 and K14 H3) normalized with respect to primer pair 5 (arbitrarily set as 100%). The abscissa is map position (nucleotide number). Black and grey arrows in the graph point towards constitutive- and differentiation-activated origins of replication, respectively. The star above one grey arrow indicates a differentiation-activated origin localized in a region where acetylation increases during differentiation. The position of the bidirectional replication fork pausing site inside the ρ-globin gene of undifferentiated cells is indicated (double black arrowheads). FR, folate receptor; HS, hypersensitive site.
Our results provide, for the first time, direct evidence for both a tissue-specific broadening of replication origin usage and the repression of an RFP in a vertebrate ex vivo differentiation system. Our results also indicate that origin activation may or may not, depending on the origin considered, be concomitant with an increase in histone H3 diacetylation.
The differentiation of chicken erythrocytic progenitors into erythrocytes activates at least four origins inside and upstream of the β-globin locus. Interestingly, the four origins that are active before differentiation remain active on differentiation even when located inside a transcribed coding region. This differentiation-induced broadening of origin usage thus contrasts with the developmental restriction of initiation in Xenopus and Drosophila, from random sites in non-transcribing early embryos, to intergenic zones, when nearby genes become expressed after the midblastula transition (Hyrien et al, 1995; Sasaki et al, 1999).
We also show that during differentiation, four out of eight regions of initiation are associated with undetectable levels of diacetylated histone H3. These results are consistent with our previous observation that in the 6C2 cell line three out of four sites of initiation are associated with low levels of histone acetylation (Prioleau et al, 2003). Although these results do not formally exclude a role for histone acetylation in the origin transitions observed here, taken together they indicate that histone acetylation is not crucial for origin specification in either undifferentiated or differentiating cells. Other histone modifications have been mapped at the chicken β-globin locus: di-Ac K9 and K14/H3, di-Me K4/H3, di-Me K9/H3, Ac K8/H4, Ac K9/H4, Ac K12/H4 and multi-acetylated H3 and H4 in red-blood-cell precursors and in erythrocytes by Litt et al (2001a, 2001b); acetylation of H2B and H2AZ by Myers et al (2003) and Bruce et al (2005); and di-Me R3/H4 by Huang et al (2005). Although interesting correlations and anticorrelations between these various modifications have been reported, we were unable to detect any convincing correlation between these histone modifications and origin usage.
Methods
Nascent strands preparation and quantification. Nascent strands were purified and quantified by real-time quantitative PCR, as described previously (Prioleau et al, 2003). Primer pair 24 was used as a standard in each PCR experiment.
Chromatin immunoprecipitation. Formaldehyde crosslinking and immunoprecipitation were performed as described in the supplementary information online with anti-diacetylated K9 and K14 H3 antibodies (Upstate Biotechnology, Hampshire, UK). Two independent immunoprecipitations were performed on two independent batches of differentiation. Real-time quantitative PCR was performed by using primer pair 5 as a standard in each PCR experiment.
Supplementary information is available at EMBO reports online (http://www.emboreports.org).
Supplementary Material
Supplementary Information
Acknowledgments
We thank Dr M. Weiss, Dr P. Lomonte, Dr M. Peretti, Dr T. Grange and C. Brossas for technical advice. This work was supported by grants from the Association pour la Recherche sur le Cancer to O.H., from the Association Française des Myopathes to M.-N.P. and from the Association pour la Recherche sur la Cancer, the Ligue contre le Cancer and the Région Rhônes Alpes to O.G. S.D. was a fellow of the Association pour la Recherche contre le Cancer and the Ligue nationale contre le Cancer.
References
- Aladjem MI, Rodewald LW, Lin CM, Bowman S, Cimbora DM, Brody LL, Epner EM, Groudine M, Wahl GM (2002) Replication initiation patterns in the β-globin loci of totipotent and differentiated murine cells: evidence for multiple initiation regions. Mol Cell Biol 22: 442–452 [DOI] [PMC free article] [PubMed] [Google Scholar]
- Bruce K, Myers FA, Mantouvalou E, Lefevre P, Greaves I, Bonifer C, Tremethick DJ, Thorne AW, Crane-Robinson C (2005) The replacement histone H2A.Z in a hyperacetylated form is a feature of active genes in the chicken. Nucleic Acids Res 33: 5633–5639 [DOI] [PMC free article] [PubMed] [Google Scholar]
- Danis E, Brodolin K, Menut S, Maiorano D, Girard-Reydet C, Mechali M (2004) Specification of a DNA replication origin by a transcription complex. Nat Cell Biol 6: 721–730 [DOI] [PubMed] [Google Scholar]
- Dijkwel PA, Wang S, Hamlin JL (2002) Initiation sites are distributed at frequent intervals in the Chinese hamster dihydrofolate reductase origin of replication but are used with very different efficiencies. Mol Cell Biol 22: 3053–3065 [DOI] [PMC free article] [PubMed] [Google Scholar]
- Gandrillon O, Schmidt U, Beug H, Samarut J (1999) TGF-β cooperates with TGF-α to induce the self-renewal of normal erythrocytic progenitors: evidence for an autocrine mechanism. EMBO J 18: 2764–2781 [DOI] [PMC free article] [PubMed] [Google Scholar]
- Gilbert DM (2004) In search of the holy replicator. Nat Rev Mol Cell Biol 5: 848–855 [DOI] [PMC free article] [PubMed] [Google Scholar]
- Gilbert DM (2005) Origins go plastic. Mol Cell 20: 657–658 [DOI] [PubMed] [Google Scholar]
- Huang S, Litt M, Felsenfeld G (2005) Methylation of histone H4 by arginine methyltransferase PRMT1 is essential in vivo for many subsequent histone modifications. Genes Dev 19: 1885–1893 [DOI] [PMC free article] [PubMed] [Google Scholar]
- Hyrien O, Maric C, Mechali M (1995) Transition in specification of embryonic metazoan DNA replication origins. Science 270: 994–997 [DOI] [PubMed] [Google Scholar]
- Kitsberg D, Selig S, Keshet I, Cedar H (1993) Replication structure of the human β-globin gene domain. Nature 366: 588–590 [DOI] [PubMed] [Google Scholar]
- Litt MD, Simpson M, Gaszner M, Allis CD, Felsenfeld G (2001a) Correlation between histone lysine methylation and developmental changes at the chicken β-globin locus. Science 293: 2453–2455 [DOI] [PubMed] [Google Scholar]
- Litt MD, Simpson M, Recillas-Targa F, Prioleau MN, Felsenfeld G (2001b) Transitions in histone acetylation reveal boundaries of three separately regulated neighboring loci. EMBO J 20: 2224–2235 [DOI] [PMC free article] [PubMed] [Google Scholar]
- Lunyak VV, Ezrokhi M, Smith HS, Gerbi SA (2002) Developmental changes in the Sciara II/9A initiation zone for DNA replication. Mol Cell Biol 22: 8426–8437 [DOI] [PMC free article] [PubMed] [Google Scholar]
- MacAlpine DM, Rodriguez HK, Bell SP (2004) Coordination of replication and transcription along a Drosophila chromosome. Genes Dev 18: 3094–3105 [DOI] [PMC free article] [PubMed] [Google Scholar]
- Maric C, Levacher B, Hyrien O (1999) Developmental regulation of replication fork pausing in Xenopus laevis ribosomal RNA genes. J Mol Biol 291: 775–788 [DOI] [PubMed] [Google Scholar]
- Maric C, Benard M, Pierron G (2003) Developmentally regulated usage of Physarum DNA replication origins. EMBO Rep 4: 474–478 [DOI] [PMC free article] [PubMed] [Google Scholar]
- Mesner LD, Hamlin JL (2005) Specific signals at the 3′ end of the DHFR gene define one boundary of the downstream origin of replication. Genes Dev 19: 1053–1066 [DOI] [PMC free article] [PubMed] [Google Scholar]
- Myers FA, Chong W, Evans DR, Thorne AW, Crane-Robinson C (2003) Acetylation of histone H2B mirrors that of H4 and H3 at the chicken β-globin locus but not at housekeeping genes. J Biol Chem 278: 36315–36322 [DOI] [PubMed] [Google Scholar]
- Norio P, Kosiyatrakul S, Yang Q, Guan Z, Brown NM, Thomas S, Riblet R, Schildkraut CL (2005) Progressive activation of DNA replication initiation in large domains of the immunoglobulin heavy chain locus during B cell development. Mol Cell 20: 575–587 [DOI] [PubMed] [Google Scholar]
- Prioleau MN, Gendron MC, Hyrien O (2003) Replication of the chicken β-globin locus: early-firing origins at the 5′ HS4 insulator and the ρ- and βA-globin genes show opposite epigenetic modifications. Mol Cell Biol 23: 3536–3549 [DOI] [PMC free article] [PubMed] [Google Scholar]
- Saha S, Shan Y, Mesner LD, Hamlin JL (2004) The promoter of the Chinese hamster ovary dihydrofolate reductase gene regulates the activity of the local origin and helps define its boundaries. Genes Dev 18: 397–410 [DOI] [PMC free article] [PubMed] [Google Scholar]
- Sasaki T, Sawado T, Yamaguchi M, Shinomiya T (1999) Specification of regions of DNA replication initiation during embryogenesis in the 65-kilobase DNApolα-dE2F locus of Drosophila melanogaster. Mol Cell Biol 19: 547–555 [DOI] [PMC free article] [PubMed] [Google Scholar]
Associated Data
This section collects any data citations, data availability statements, or supplementary materials included in this article.
Supplementary Materials
Supplementary Information