SYNOPSIS
Objective
This study was conducted to determine whether improvements in tuberculosis (TB) program activities correlate with incident TB cases.
Methods
National TB surveillance data and program data from patients with pulmonary and laryngeal TB and their contacts were collected. These data were analyzed using regression models to assess the association between changes in incident TB cases and indicators of program performance (a time series of percent changes in program indices).
Results
A total of 1,361,113 contacts exposed to 150,668 TB patients were identified through contact investigations. From 1987 to 1992 (the period of TB resurgence and antedating increased funding), there was a decline in several measures used by TB programs for outcomes of contact investigations. From 1993 to 1998 (the period after increases in TB funds), there was an observable improvement in the program indices. Four program indices for contacts and two for TB cases (directly observed therapy and completion of therapy) were statistically associated (p≤0.01) with the decline in TB incident cases.
Conclusions
These analyses suggest that expanded TB program activities resulted in the reduction in national TB cases and underscore the importance of treatment completion for TB disease and latent TB infection. Based on these results, we propose that further improvements in these activities will accelerate the decline of TB in the United States.
A resurgence of tuberculosis (TB) occurred in the United States in the mid 1980s and early 1990s.1 In response to this situation, new funds were appropriated for enhanced program activities in 1992–1993. Consequently, annual TB incidence since 1992 has declined continuously through year 2004, reaching a historic nadir.2 The decline in TB cases began soon after Congressional appropriations for TB control efforts more than quintupled from 1992 ($20.7 million) to 1994 ($116.8 million). These increased funds were distributed to public health department TB control programs, especially in states and metropolitan areas with high TB morbidity, to help improve the completion of TB therapy through the use of directly observed therapy and to intensify other core TB control activities, 3–6 such as the investigation of contacts to TB cases.
In this report, we describe the relationship found between declining incident TB cases since 1993 and the expansion of important TB control measures, especially the contact investigation. The contact investigation is the primary activity used by health departments to identify and evaluate high-risk individuals (contacts) who were exposed to infectious TB patients.7,8 Through medical evaluations, performed in conjunction with contact investigations, health departments can find and provide treatment for secondary TB cases. The activities performed during contact investigations interrupt further transmission of TB and identify individuals who may benefit from treatment for latent TB infection (LTBI). The correlation between incident TB cases and contact investigations and treatment for LTBI has not been fully studied. We analyzed national TB program and surveillance data reported by state and local health departments to the Centers for Disease Control and Prevention (CDC) from 1987–1992 (the resurgent period) and 1993–1998 (the recovery period) to assess the association between TB program activities and TB incidence.
METHODS
Data sources
Every six months from 1972 through 1998, local and state health departments reported aggregate data on TB program indices to CDC describing the number of contacts identified and evaluated, the number of contacts found to have a positive tuberculin skin test (TST) or TB disease, and the number of contacts that started and completed treatment for LTBI. Starting in 1987, the data were entered into an electronic database that was used for this analysis. All states—except Arkansas, Idaho, Illinois, and Nebraska, owing to lack of program outcome data—and the District of Columbia (classified with the Group 2 states in the paired indices analysis) were included in this analysis. While the precise definition may vary among reporting areas, in general, contacts are defined as people who had recently shared the same air space with a person who had infectious TB. Data analyses were limited to pulmonary and laryngeal TB cases because they constitute the main sources of TB contagion.
We used data on TB cases and treatment follow-up reported from the same states and the District of Columbia to CDC's national TB surveillance system using a standardized case report form.9 Data on the mode of treatment (directly observed or self-administered) and treatment completion were from case reports submitted from 1993 through 1998.
Program indices
The program report data were arranged into seven indices to measure program performance associated with contact investigations. These program indices were: (1) Cases with contacts—the number of cases with at least one contact identified divided by the total number of cases; (2) Contacts per case—the number of contacts identified divided by the number of cases with contacts identified; (3) Contacts evaluated—the number of contacts medically evaluated (TST read and chest radiograph done) divided by the number of contacts identified; (4) Start LTBI therapy—the number of contacts (<15 and ≥15 years of age) started on treatment for LTBI, divided by the number of contacts infected without disease minus contacts previously treated for LTBI; (5) Complete LTBI therapy—the number of contacts completing therapy divided by the number of contacts (<15 and ≥15 years of age) starting therapy minus exclusions (TB disease, died, moved and referred, or discontinued therapy due to an adverse reaction); (6) TB infection—the number of contacts with LTBI divided by the number of contacts evaluated; and (7) TB disease—the number of new TB cases identified divided by the number of contacts evaluated.
In addition to the above defined program indices, analysis for the 1993–1998 period included two indices for the treatment for TB cases: (1) Directly observed therapy (DOT)—the proportion of patients whose treatment was observed by a health care worker, and (2) Completion of therapy (COT)—the proportion of patients for whom six months of therapy was indicated and completed within 12 months.
Data analyses
Paired indices consisted of a time series leading indicator (incident TB cases) and percent changes in program indices. Because the leading indicator and program indices have different units, we standardized the leading indicator and the indices for each annual interval by dividing the data from each index by the mean, then multiplying the resulting values by 100. To account for the fact that program activities have an effect on TB future cases, the time frame of the leading indicator was shifted by two years so that 1987 program indices were related to 1989 incident cases; succeeding years were paired in similar fashion. A two-year frame shift was used because it is the time of greatest risk for progression from TB infection to active disease.10 Using a paired indices analysis for predicting changes in longitudinal data, 11 we compared the observed indices with the trend in incident TB cases to determine whether TB program activity (measured by the program indices) was correlated with incident TB cases.
We used a generalized linear regression model for the data so that heterogeneity could be explicitly modeled.12 The GENMOD procedure with AR(1) option in SAS13 was used to study the relationship between the paired indices and incident TB cases (Written communication, Kleinbaum DG. Comparison of several SAS procedures for the analysis of clustered data; 1995). The 95% two-sided partially maximum likelihood confidence interval of each index was obtained under the normality assumption for the indices.12
The paired indices analysis and the univariate linear regression models were stratified by two factors. To control for the appreciable change in funding, which impacts program capacity and performance, we studied associations in two distinct periods: 1987 to 1992 (the low funding period) and 1993 to 1998 (the higher funding period). And to adjust for the interaction between funding and the national decline in TB cases, we stratified the states into two groups by greater than or equal to (Group 1) or by less than (Group 2) the decline in the national TB incident cases. Group 1 states had a greater than or equal decline in TB cases compared with the decline in the national case rate and consisted of 25 states. Group 2 states had a decline in cases less than the decline in the national case rate and consisted of 22 states.
RESULTS
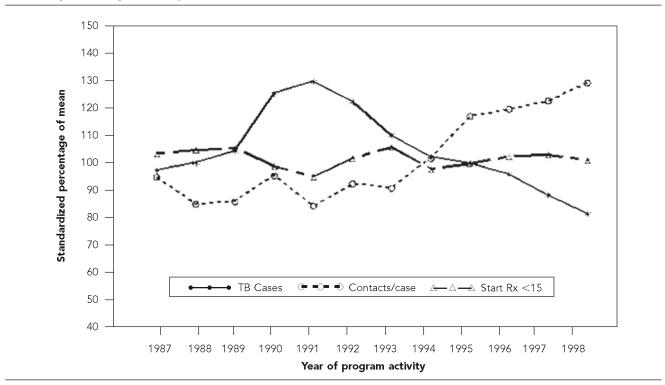
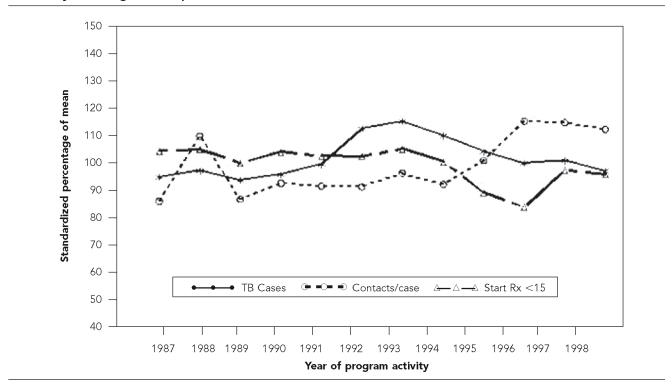
From 1987 through 1998, 189,983 cases of pulmonary and laryngeal TB were reported, along with programmatic data regarding their corresponding contact investigations. Contact investigations for 150,668 (79.3%) TB cases identified at least one contact. TB cases that had at least one contact identified increased every year from 1993 (the year with the lowest percentage) through 1998 from 72.4% to 84.3% (p<0.001, chi-square for linear trend). The mean number of contacts identified per case through contact investigations in 1991 was 8.5; it steadily increased until 1998 when the mean was 11.0 contacts per case. The increase in contacts identified per case occurred earlier in Group 1 states (1994, Figure 1) than in Group 2 states(1995, Figure 2).
Figure 1.
Trend for the indices Contacts per case and Start therapy for LTBI <15 years of age in Group 1 states, 1987–1998
a Year for TB cases precedes the index year by two years.
Figure 2.
Trend for the indices Contacts per case and Start therapy for LTBI <15 years of age in Group 2 states, 1987–1998
A total of 1,361,113 individuals exposed to an infectious TB case was identified through contact investigations. The percentage of contacts that completed evaluation for TB disease and infection varied slightly over the study period for an average of 89.2%. Overall, 287,242 contacts (21.1%) were found to have LTBI; the percentage of contacts with LTBI increased steadily from 21.0% in 1991 to 25.0% in 1998. Likewise, the index TB disease shows that the percentage of TB cases found among evaluated contacts increased from 0.7% in 1991 to 0.9% in 1998.
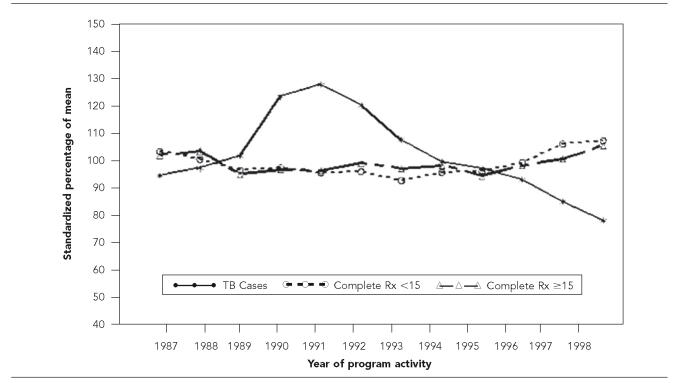
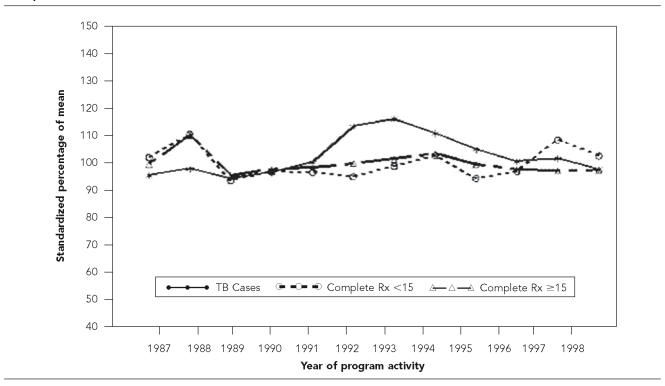
After the increase in TB program funding, an increasing percentage of infected contacts started treatment for LTBI. The Start of LTBI therapy index for contacts <15 years of age increased in 1995 for Group 1 states (Figure 1) and in 1997 for Group 2 states (Figure 2). Starting in 1993, after several years of decline, Complete LTBI therapy for child contacts increased from 73.0% to 83.4% and from 63.9% to 70.8% for adult contacts. Similarly, the Complete LTBI therapy index for child contacts increased earlier in Group 1 states (1994, Figure 3) than in Group 2 states (1996, Figure 4). For adult contacts, Complete LTBI therapy has increased in group 1 states since 1996 (Figure 3), but has declined in Group 2 states since 1994 (Figure 4).
Figure 3.
Trend for the indices Complete LTBI therapy for <15 and ≥15 years of age in Group 1 states, 1987–1998
a Year for TB cases precedes the index year by two years.
Figure 4.
Trend for the indices Complete LTBI therapy for <15 and ≥15 years of age in Group 2 states, 1987–1998
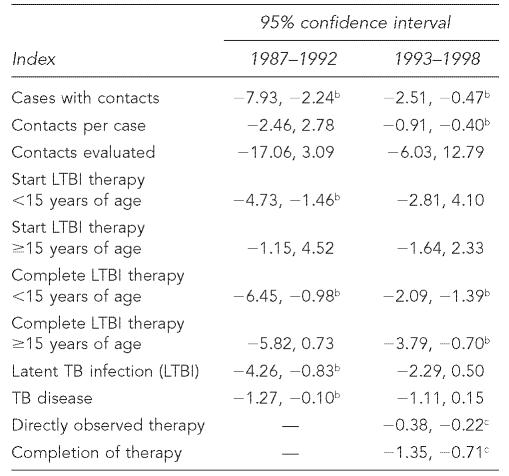
Because the impact of funding has a complex effect on program performance, we present regression models that control for funding by stratifying the data in two periods: the low funding period (1987–1992) and the higher funding period (1993–1998). In the low funding period, program indices for Group 1 states that correlated (p≤0.01) with increasing TB cases were Cases with contacts, Start LTBI therapy for contacts <15 years, and Complete LTBI therapy for contacts ≥15 years, Latent TB infection, and TB disease. There were no statistically significant associations for Group 2 states.
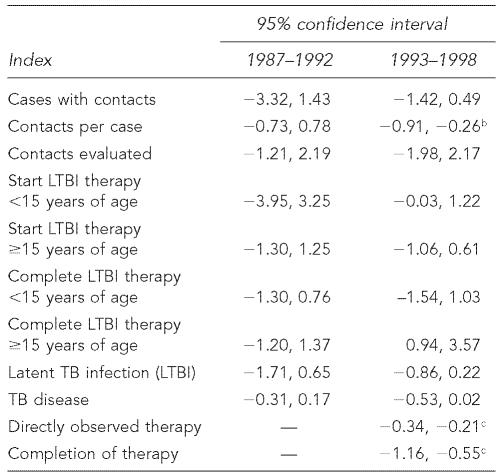
In the higher funding period, the program indices that were associated with declining incident TB cases for Group 1 states were Cases with contacts, Contacts per case, Complete LTBI therapy for contacts <15 years, and Complete LTBI therapy for contacts ≥15 years (Table 1). For Group 2 states, only Contacts per case was associated with the declining trend in incident TB cases (Table 2). In contrast, worse outcomes for Complete LTBI therapy for contacts ≥15 years were associated with decreasing trends during the higher funding period.
Table 1.
Regression analysis of program indices for Group 1 states, 1987–1992 and 1993–1998a
Group 1 are states where the decline in incident TB cases was equal to or more pronounced than the national average.
p≤0.01
p<0.001
Table 2.
Regression analysis of program indices for Group 2 states, 1987–1992 and 1993–1998a
Group 2 states are where the decline in incident TB cases was less than the national average.
p≤0.01
p<0.001
Finally, Directly observed therapy and Completion of therapy showed a high degree of correlation with decreasing incident TB cases in both Group 1 and Group 2 states (p<0.001).
DISCUSSION
This analysis suggests that improvements in TB treatment by using DOT and expanding contact investigations are associated with decreasing incident TB cases. The examination of the effects of enhanced program activities on reductions in incident TB cases for more than 150,000 TB cases and almost 1.4 million of their contacts offers a model for outcomes based public health programs. Focused activities to enhance treatment completion for individuals with TB and expanding the scope of contact investigations are fundamental changes in TB control activities that helped to reverse the recent resurgence in TB. An earlier analysis by McKenna et al. showed that the initial decline in incident TB cases was associated with several factors: improvements in completion of therapy for TB cases, bacteriologic sputum conversion (shortening of the infectious period), and an increase in the number of contacts identified per case.14 Two of the factors implicated in controlling TB—improved rates of completion of therapy and shorter time to sputum conversion—in large part reflect the greater use of DOT that was widely introduced by health departments after TB funding appreciably increased.2,3,15 The third factor, expanding contact investigations, is a broader public health activity that seeks to determine the social pathway through which TB is transmitted and to interrupt ongoing transmission.
Completion of treatment for LTBI among individuals identified through contact investigations is a cornerstone of U.S. efforts to accelerate the decline in TB cases. The primary purposes of contact investigations are to provide treatment to contacts for LTBI and to identify secondary TB cases.8 The early identification of secondary cases among individuals who had not yet sought medical care reduces further transmission of TB.16 Since TB programs have received increased funding, steady progress has been made in completing treatment for LTBI, thereby reducing the pool of future TB cases. Assuming that 5%–10% of contacts with LTBI develop TB disease without treatment, 17,18 enhanced contact investigations in this study cohort would prevent an estimated 600 TB cases.
The increase in the median number of contacts identified through contact investigations, the decrease in the percentage of cases with no contacts identified, and the percentage of contacts having TB disease are indicators of improved case finding. These findings suggest that by expanding the scope of contact investigations, health departments can prevent transmission of TB by promptly evaluating and treating secondary TB cases and recently infected individuals who are at high risk for progression to TB disease. In contrast, nonimprovement in program indices correlated with increases in TB cases from 1987 to 1992 of the study period.19
A patient-centered approach that uses public health outreach workers or nurses to deliver and directly observe the treatment of individuals with infectious pulmonary TB is one of the most important innovations taken to combat the latest rise in TB in the United States.3–5 In the present study, data collected since 1993 indicate that both Group 1 and Group 2 states evidenced the strongest correlation between DOT and COT with declining TB cases. Increased use of DOT may improve initial adherence to treatment when patients continue to be infectious and reduces the relapse of TB resulting from partial treatment. Chaulk and colleagues reviewed studies that used nonsupervised approaches to TB treatment and those that used DOT with and without incentives and enablers to help patients adhere to treatment.20 That review and other studies conclude that treatment completion rates sufficient to control the TB epidemic are unachievable with nonsupervised approaches to TB treatment.5,21
This study has limitations. It is easier to measure outbreaks that were not prevented than those that are prevented.21,22 The associations found could also be influenced by other, more difficult to measure, program improvements. Another limitation is that the data were collected from numerous local sites over several years. It is possible that data quality varied by both place and time. In addition, data on the completion of therapy for contacts with LTBI may not have been available from providers outside the health department, thus underestimating completion of therapy. Finally, classification bias may exist for the program activities occurring in 1991, the low funding period, which are examined in connection to TB cases in 1993, the higher funding period. However, neither a one-year nor a three-year lag produced appreciable differences in the models and the contribution of any bias would be small compared to the entire period studied.
Treatment completion for TB cases, contact investigations, and treatment for LTBI are vital public health activities. As health departments assimilate the experiences and lessons from conducting contact investigations, they will be substantive instruments for interrupting TB transmission and preventing future cases.23,24 Owing to structural change in the conditions in which public health departments operate, further evaluation of the effectiveness of TB programs is needed to identify those activities that most significantly contribute to accelerating the decline of TB in the United States.25–28
Acknowledgments
The authors thank Robert Pratt and Linda Leary from the Division of Tuberculosis Elimination for providing surveillance data and program data management. In addition, the authors thank TB control staff throughout the country for their diligent collection of surveillance and program data.
REFERENCES
- 1.Cantwell MF, Snider DE, Cauthen GM, Onorato IM. Epidemiology of tuberculosis in the United States, 1985 through 1992. JAMA. 1994;272:535–9. [PubMed] [Google Scholar]
- 2.Centers for Disease Control and Prevention (US) Reported tuberculosis in the United States, 2004. Atlanta: U.S. Department of Health and Human Services, CDC, September 2005; [cited 2005 Oct 17]. Available from: URL: http://www.cdc.gov/nchstp/tb/surv/surv2004/default.htm. [Google Scholar]
- 3.Chaulk CP, Moore-Rice K, Rizzo R, Chaisson RE. Eleven years of community-based directly observed therapy for tuberculosis. JAMA. 1995;274:945–51. [PubMed] [Google Scholar]
- 4.Frieden TR, Fujiwara PI, Washko RM, Hamburg MA. Tuberculosis in New York City—turning the tide. N Engl J Med. 1994;333:229–33. doi: 10.1056/NEJM199507273330406. [DOI] [PubMed] [Google Scholar]
- 5.Weis S, Slocum P, Blais FX, King B, Nunn M, Matney GB, et al. The effect of directly observed therapy on the rates of drug resistance and relapse in tuberculosis. N Engl J Med. 1994;330:1179–84. doi: 10.1056/NEJM199404283301702. [DOI] [PubMed] [Google Scholar]
- 6.Jasmer RM, Hahn JA, Small PM, Daley CL, Behr MA, Moss AR, et al. A molecular epidemiologic analysis of tuberculosis trends in San Francisco, 1991–1997. Ann Intern Med. 1999;130:971–8. doi: 10.7326/0003-4819-130-12-199906150-00004. [DOI] [PubMed] [Google Scholar]
- 7.Control of tuberculosis in the United States. American Thoracic Society. Am Rev Respir Dis. 1992;146:1623–33. doi: 10.1164/ajrccm/146.6.1623. [DOI] [PubMed] [Google Scholar]
- 8.Centers for Disease Control and Prevention (US) Self-Study Modules on Tuberculosis, No. 6. Contact investigations for tuberculosis. [cited 2005 Oct 3]. Available from: URL: http://www.cdc.gov/nchstp/tb/pubs/ssmodules/pdfs/6.pdf.
- 9.Talbot EA, Moore M, McCray E, Binkin NJ. Tuberculosis among foreign-born persons in the United States, 1993–1998. JAMA. 2000;284:2894–900. doi: 10.1001/jama.284.22.2894. [DOI] [PubMed] [Google Scholar]
- 10.Ferebee SH, Mount FW. Tuberculosis morbidity in a controlled trial of the prophylactic use of isoniazid among household contacts. Amer Rev Respir Dis. 1962;85:490–510. doi: 10.1164/arrd.1962.85.4.490. [DOI] [PubMed] [Google Scholar]
- 11.Makridakis S, Wheelwright SC, McGee VE. Forecasting: methods and applications. 2nd edition. New York: John Wiley – Sons; 1983. [Google Scholar]
- 12.Liang KY, Zeger SL. Longitudinal data analysis using generalized linear models. Biometrics. 1986;73:13–22. [Google Scholar]
- 13.SAS/STAT User's Guide, Version 6. 4th edition. Carey (NC): SAS Institute, Inc; 1997. [Google Scholar]
- 14.McKenna MT, McCray E, Jones JL, Onorato IM, Castro KG. The fall after the rise: tuberculosis in the United States, 1991 through 1994. Am J Public Health. 1998;88:1059–63. doi: 10.2105/ajph.88.7.1059. [DOI] [PMC free article] [PubMed] [Google Scholar]
- 15.Moore M, Onorato IM, McCray E, Castro KG. Trends in drug-resistant tuberculosis in the United States, 1993–1996. JAMA. 1997;278:833–7. [PubMed] [Google Scholar]
- 16.Marks SM, Taylor Z, Qualls NL, Shrestha-Kuwahara RJ, Wilce MA, Nguyen CH. Outcomes of contact investigations of infectious tuberculosis patients. Amer J Respir Crit Care Med. 2000;162:2033–8. doi: 10.1164/ajrccm.162.6.2004022. [DOI] [PMC free article] [PubMed] [Google Scholar]
- 17.Ferebee SH. Controlled chemoprophylaxis trails in tuberculosis. A general review. Bibl Tuberc. 1970;17:28–106. [PubMed] [Google Scholar]
- 18.Sutherland I. Recent studies in the epidemiology of tuberculosis, based on the risk of being infected with tubercle bacilli. Adv Tuberc Res. 1976;19:1–63. [PubMed] [Google Scholar]
- 19.Brudney K, Dobkin J. Resurgent tuberculosis in New York City. Human immunodeficiency virus, homelessness, and the decline of tuberculosis control programs. Am Rev Respir Dis. 1991;144:745–9. doi: 10.1164/ajrccm/144.4.745. [DOI] [PubMed] [Google Scholar]
- 20.Chaulk CP, Kazandjian VA. Directly observed therapy for treatment completion of pulmonary tuberculosis. Consensus Statement of the Public Health Tuberculosis Guidelines Panel. JAMA. 1998;279:943–8. doi: 10.1001/jama.279.12.943. [DOI] [PubMed] [Google Scholar]
- 21.Fitzpatrick LK, Hardacker JA, Heirendt W, Agerton T, Streicher A, Melnyk H, et al. A preventable outbreak of tuberculosis investigated through an intricate social network. Clin Infect Dis. 2001;33:1801–6. doi: 10.1086/323671. [DOI] [PubMed] [Google Scholar]
- 22.49. Vol. 52. King County, Washington 2002–2003: MMWR Morb Mortal Wkly Rep; 2003. TB outbreak among homeless persons; pp. 1209–10. [PubMed] [Google Scholar]
- 23.30. Vol. 49. United States, 1996–1997: MMWR Morb Mortal Wkly Rep; 2000. Missed opportunities for prevention of tuberculosis among persons with HIV infection—selected locations; pp. 685–7. [PubMed] [Google Scholar]
- 24.15. Vol. 49. Baltimore, Maryland and New York City area, 1998–2000: MMWR Morb Mortal Wkly Rep; 2000. HIV-related tuberculosis in a transgender network; pp. 317–20. [PubMed] [Google Scholar]
- 25.MacIntyre CR, Plant AJ. Preventability of incident cases of tuberculosis in recently exposed contacts. Int J Tuberc Lung Dis. 1998;2:56–61. [PubMed] [Google Scholar]
- 26.Behr MA, Hopewell PC, Paz EA, Kawamura LM, Schecter GF, Small PM. Predictive value of contact investigation for identifying recent transmission of Mycobacterium tuberculosis. Am J Respir Crit Care Med. 1998;158:465–9. doi: 10.1164/ajrccm.158.2.9801062. [DOI] [PubMed] [Google Scholar]
- 27.Lobato MN, Mohle-Boetani JC, Royce SE. Missed opportunities for preventing tuberculosis among children younger than five years of age. Pediatrics. 2000;106:e75. doi: 10.1542/peds.106.6.e75. [DOI] [PubMed] [Google Scholar]
- 28.Reichler MR, Reves R, Bur S, Thompson V, Mangura BT, Ford J, et al. Evaluation of investigations conducted to detect and prevent transmission of tuberculosis. JAMA. 2002;287:991–5. doi: 10.1001/jama.287.8.991. [DOI] [PubMed] [Google Scholar]


