

Abstract
Sitosterolaemia (also known as phytosterolaemia, MIM 210250) is a rare recessive autosomal inherited disorder, characterised by the presence of tendon and tuberous xanthomas, accelerated atherosclerosis and premature coronary artery disease. The defective gene is hypothesised to play an important role in regulating dietary sterol absorption and biliary secretion, thus defining a molecular mechanism whereby this physiological process is carried out. The disease locus was localised previously to chromosome 2p21, in a 15 cM interval between microsatellite markers D2S1788 and D2S1352 (based upon 10 families, maximum lodscore 4.49). In this study, we have extended these studies to include 30 families assembled from around the world. A maximum multipoint lodscore of 11.49 was obtained for marker D2S2998. Homozygosity and haplotype sharing was identified in probands from non-consanguineous marriages from a number of families, strongly supporting the existence of a founder effect among various populations. Additionally, based upon both genealogies, as well as genotyping, two Amish/Mennonite families, that were previously thought not to be related, appear to indicate a founder effect in this population as well. Using both homozygosity mapping, as well as informative recombination events, the sitosterolaemia gene is located at a region defined by markers D2S2294 and Afm210xe9, a distance of less than 2 cM.
Keywords: genetics, homozygosity mapping, linkage, cholesterol, atherosclerosis, diet
Introduction
Sitosterolaemia is a sterol disorder characterised by the presence of tendon and tuberous xanthomas, premature atherosclerotic disease, but with normal to mildly elevated plasma cholesterol levels.1 – 3 Sitosterolemia can be distinguished from the more common familial hypercholesterolaemia (FH), based upon its recessive mode of inheritance (although rare forms of recessively-inherited FH are now known), by only moderately elevated plasma LDL cholesterol levels, but diagnostically elevated plant sterol in their plasma.1 – 3 Phytosterols are normally almost undetectable in plasma from normal individuals. This condition may be under reported as the detection of plasma phytosterols requires the use of HPLC or capillary GLC, and the standard cholesterol measurement does not distinguish between cholesterol and many non-cholesterol sterols. Affected individuals have significantly elevated levels of non-cholesterol sterols of dietary origin, such as plant sterols, shellfish sterols etc.4 Sitosterol is the major plant sterol species, and is significantly elevated in affected individuals, hence the name sitosterolaemia.3 Under normal circumstances, our diets contain almost equal amounts of cholesterol and plant sterols. However, only 30 – 60% of total dietary cholesterol and less than 5% of total plant sterols are retained by the body. The liver excretes most of the absorbed non-cholesterol sterols rapidly into bile, almost unchanged, such that the net absorption of these sterols is almost negligible. In sitosterolaemia, affected individuals show an increase in the absorption of all dietary sterols, with failure to discriminate between different sterol species and a failure to excrete absorbed non-cholesterol species rapidly into bile.1,5 – 7
Segregation analyses of the trait in a large Amish pedigree showed an autosomal recessive pattern of inheritance.8 More recently, the gene defect has been mapped to chromosome 2p21, to within a 15 cM region.4 The true prevalence of this disorder is not known, but over 40 individuals with this condition have been reported worldwide, many of which are represented in this study.4,9 The elucidation of this gene disorder is important, as it will identify molecular mechanisms whereby noncholesterol sterols of dietary origin are selectively excluded from the body. Indeed, it is the very existence of this disease that has given credence to the hypothesis that a biochemical pathway regulates net dietary cholesterol absorption.1,5
In this study, we report an extension of our previous studies, further refining the mapping of the sitosterolaemia locus to an interval of less than 2 cM. Additionally, in characterising pedigrees assembled from many different geographic areas, we have uncovered founder effects in the Finnish/Norwegian and Japanese probands, as well as within the Amish/Mennonite population in the US.
Methods
Pedigrees
All pedigrees (Figure 1) were recruited, based upon previously defined criteria.4,9 Clinical features of some of the probands and their family members have been described previously.1,4,8 – 17 Briefly, all probands had both clinical features compatible with a diagnosis of sitosterolaemia, and all probands had to have diagnostically elevated plasma sitosterol levels. The pedigrees include seven Japanese families (700, 800, 2100, 2800, 3300, 3500 and 3700), two Amish/Mennonite families (2200 and 2700), two Finnish (400, 3900), one Norwegian (2900), two white South African families (600 and 3600), one Asian South African family (500), one Colombian family (3400, 2nd cousin marriage) and one Dutch family (2500). The remaining families are from the US, and have Caucasian origins, except for family 3800, which is Black.
Figure 1.
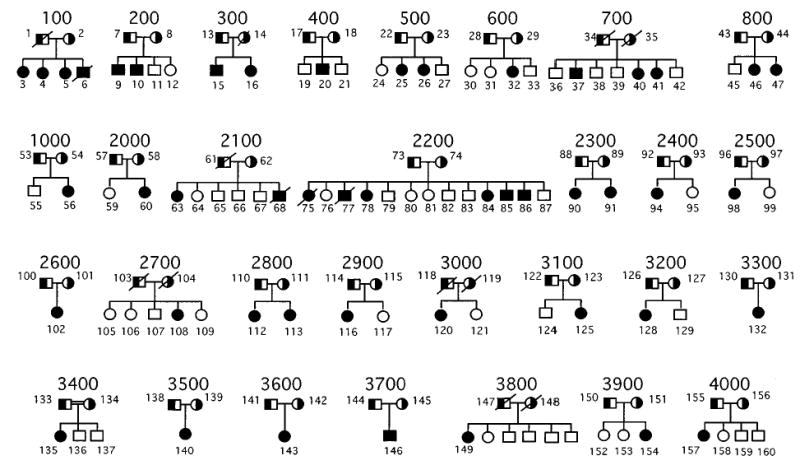
Sitosterolaemia pedigrees. The pedigrees analysed in this study are shown above. All parents are shown as obligate carriers. The one known consanguineous marriage, pedigree 3400, is as indicated. Although family members for pedigree 3800 are known, they were not available for analyses.
Non-paternity was detected in two families and non-maternity in one family. Two of these families (one non-paternity and one non-maternity) were referred to us and had been assembled previously. These families were excluded from multipoint analyses (see below) but the probands showed homozygosity for alleles spanning the disease locus and were thus informative.
Genotyping and linkage analysis
Genomic DNA was extracted from whole blood or transformed lymphoblastoid cell line, and genotyping performed as previously described.4,9 Linkage analyses were performed using 22 primer sets from CHLC and six newly identified microsatellite markers identified from three working draft sequences of BACs, as well as from inter-Alu PCR product from a YAC contig (Lu et al, manuscript submitted). These markers are D2S1346, D2S2272, D2S2328, Afm335xc1, GA-TA194B06, D2S2306, D2S2259, D2S1356, D2S414, D2S4010, D2S2294, D2S119, D2S4009, D2S1761, D2S2298, D2S4018, Afm210xe9, D2S4016, D2S4014, D2S2174, D2S4015, D2S2291, D2S2240, D2S2378, D2S39, D2S2156, D2S123, D2S2153.
Pedigree statistics and disease model
Two-point, multipoint, haplotype and linkage disequilibrium analyses were performed on 28 sitosterolaemia pedigrees (Figure 1), with 143 individuals. The average pedigree size was 5.1 individuals, and pedigree size ranged from three individuals (father, mother and affected child) to 15 individuals. Twenty-eight markers were used for the two-point analysis, all markers coming from the 2p21 region of chromosome 2. Twenty-one individuals had missing genotypes at all markers (14.7% of individuals). For the remaining individuals, 29.2% of the genotypes were missing. For all linkage analyses, a fully penetrant recessive mode of inheritance with no phenocopies was assumed. The marker-allele frequencies were estimated from the data using observed and reconstructed genotypes of founders within the pedigrees. To avoid computation errors due to observed allele frequencies of 0.0, marker alleles for all markers were recoded using the RECODE program.18 This re-coding program insured that alleles were numbered sequentially, and that every allele frequency was non-zero. In addition, the recoding had no effect on any of the analyses, in terms of power of the methods. The disease allele frequency was set at 0.014, corresponding to a population prevalence of 0.02%4 for a fully penetrant recessive disorder with no phenocopies.19
Two-point analysis
Two-point analyses were carried out using the MLINK program of the FASTLINK suite of programs.20 – 22
Multipoint and haplotype analyses
Multipoint and haplotype analyses were carried out using the SIMWALK program version 2.6.23 This software was chosen because it employs a Markov chain Monte Carlo approach, which allows for both a large number of founders in a pedigree and multiple markers in the computation of lod scores. Markers were chosen for the multipoint analysis according to the following steps: (1) all markers that showed 0.0 recombination fractions according to the Marshfield map24 with other markers were put into distinct groups; (2) among markers in the distinct groups, those markers with the largest heterozygosity were chosen for multipoint analysis. This procedure was followed since the method used in SIMWALK has computational limitations for markers with 0.0 recombination distances (E. Sobel, personal communication and see Results, Multipoint and haplotype analyses). A list of the 12 markers used in the multipoint analysis and the positions entered (for SIMWALK) may be found in Table 1. Recombination distances between markers were computed using the sex-averaged Marshfield map.24 Haplotype analysis using the same set of markers (Table 1) was performed using SIMWALK 2. Informative recombination events are discussed in the Results section. Those pedigrees that showed more than one recombination event per offspring were rerun at least five times, to see if haplotype reconfigurations with fewer recombination events were possible.
Table 1.
Markers used for the SIMWALK program
| Marker | Position |
|---|---|
| D2S1346 | 0.0 |
| GATA194B06 | 2.3 |
| D2S2306 | 4.05 |
| D2S2259 | 4.93 |
| D2S4010 | 5.48 |
| D2S4009 | 6.03 |
| D2S2298 | 6.58 |
| D2S4015 | 8.22 |
| D2S2240 | 10.41 |
| D2S2378 | 10.95 |
| D2S123 | 14.25 |
| D2S2153 | 17.51 |
All markers that had recombination distances of 0.0 specified in the databases were grouped and a representative marker from each of these groups is shown (see Methods).
Linkage disequilibrium analysis
In addition to multipoint and haplotype analysis, a linkage disequilibrium analysis (LD) was performed to finemap the disease locus. Linkage to chromosome 2p21 had already been established in previous set of families.4 LD was suspected as several of the families come from genetically isolated populations. Two family-based linkage disequilibrium tests, HRR-LRT and HRR-2× n25 were therefore used to test for linkage disequilibrium.
The HRR-LRT approach captures LD at loci with multiple alleles through a single parameter, λ, where λ is a measure of the strength of association (λ=0 for no association, λ=1.0 for complete association). In the HRR-2× n approach, a standard chi-square is computed in a 2× n table for n alleles (Terwilliger 1995).
Results
Two-point analyses
As Table 2 indicates, all but four markers ( D2S4014, D2S2156, D2S123, D2S2153) show highly significant evidence for linkage (lod scores > > 3.0), the maximum lod score over all markers being 8.39 at a recombination of 0.0 for locus D2S4009. If we consider a 1-unit support interval26 for the location of the disease locus, our search interval would include the region from markers D2S119 to Afm210xe9 (excluding D2S4018), and a 5-cM interval around GA-TA194B06 (Table 2) (since linkage had already previously been established,4 the more stringent 3-unit support interval is not warranted here). Note that a 1-unit support interval corresponds to all locations that have an odds ratio of less than 10 : 1 in favour of the D2S4009 locus.
Table 2.
Two-point lod scores for 28 polymorphic markers on chromosome 2p21 in 28 sitosterolaemia pedigrees
| Recombination fraction, θ | |||||||
|---|---|---|---|---|---|---|---|
| Marker | 0.0 | 0.01 | 0.05 | 0.1 | 0.2 | 0.3 | 0.4 |
| D2S1346 | 6.12 | 5.96 | 5.29 | 4.46 | 2.84 | 1.42 | 0.39 |
| D2S2272 | 5.83 | 5.69 | 5.14 | 4.43 | 3.02 | 1.66 | 0.52 |
| D2S2328 | 6.32 | 6.17 | 5.57 | 4.81 | 3.29 | 1.82 | 0.56 |
| Afmb335xcl | −∝ | 1.72 | 3.74 | 3.95 | 3.13 | 1.83 | 0.58 |
| GATA194B06 | −∝ | 7.7 | 7.41 | 6.48 | 4.37 | 2.34 | 0.7 |
| D2S2306 | −∝ | 6.33 | 6.2 | 5.46 | 3.73 | 2.04 | 0.63 |
| D2S2259 | −∝ | 3.94 | 4.11 | 3.74 | 2.71 | 1.57 | 0.52 |
| D2S1356 | 6.51 | 6.36 | 5.75 | 4.96 | 3.35 | 1.8 | 0.53 |
| D2S414 | −∝ | 4.16 | 4.98 | 4.76 | 3.53 | 2.01 | 0.62 |
| D2S4010 | 3.44 | 3.43 | 3.23 | 2.87 | 2 | 1.1 | 0.34 |
| D2S2294 | −∝ | 6.21 | 6.64 | 6 | 4.15 | 2.24 | 0.67 |
| D2S119 | 8.16 | 7.96 | 7.17 | 6.18 | 4.19 | 2.29 | 0.69 |
| D2S4009 | 8.39 | 8.18 | 7.36 | 6.32 | 4.26 | 2.32 | 0.7 |
| D2S1761 | 7.03 | 6.87 | 6.24 | 5.39 | 3.63 | 1.93 | 0.57 |
| D2S2298 | 7.39 | 7.23 | 6.56 | 5.66 | 3.81 | 2.03 | 0.59 |
| D2S4018 | 3.38 | 3.29 | 2.93 | 2.5 | 1.68 | 0.93 | 0.3 |
| Afm210xe9 | −∝ | 8.44 | 8.08 | 7.07 | 4.79 | 2.57 | 0.76 |
| D2S4016 | −∝ | 4.3 | 4.36 | 3.88 | 2.69 | 1.47 | 0.45 |
| D2S4014 | −∝ | 1.47 | 2.4 | 2.39 | 1.77 | 0.98 | 0.29 |
| D2S2174 | −∝ | 5.14 | 5.23 | 4.72 | 3.34 | 1.87 | 0.58 |
| D2S4015 | 5.39 | 5.24 | 4.67 | 3.94 | 2.54 | 1.32 | 0.39 |
| D2S2291 | −∝ | 4.44 | 4.68 | 4.31 | 3.1 | 1.75 | 0.54 |
| D2S2240 | −∝ | 6.09 | 6.23 | 5.66 | 4.03 | 2.26 | 0.7 |
| D2S2378 | −∝ | 2.98 | 3.17 | 2.85 | 1.95 | 1.04 | 0.31 |
| D2S391 | 4.33 | 4.22 | 3.77 | 3.22 | 2.13 | 1.13 | 0.33 |
| D2S2156 | −∝ | −3.89 | −0.27 | 0.81 | 1.16 | 0.77 | 0.25 |
| D2S123 | −∝ | −1.5 | 0.84 | 1.44 | 1.41 | 0.86 | 0.26 |
| D2S2153 | −∝ | −3.06 | −0.09 | 0.77 | 0.98 | 0.64 | 0.2 |
Two-point lod scores, at the recombination fractions shown, were determined as described in Methods. Lod scores >3.0 are highlighted in bold.
The most convincing evidence for the location of the disease locus includes markers D2S119, D2S4009, D2S1761, and D2S2298. The lod scores are all very high for these markers, and there are no observed recombination events between these markers and the disease locus. According to Marshfield web site,24 the estimated map distance between D2S119 and D2S2298 is 0.55 cM.
It should also be noted that while the 5-cM region around marker GATA194B06 is within the 1-unit support interval for the location of the disease, this peak is singular; no neighbouring markers share such a large lod score. To investigate the possibility of locus heterogeneity, a test of heterogeneity in the presence of linkage (27; pp. 225) was performed on all 28 markers. No significant evidence for locus heterogeneity was found with any of the marker loci, suggesting that there is only one disease locus occurring in all of these families.
Multipoint and haplotype analyses
Multipoint and haplotype analyses were performed with the hope of narrowing the location of the disease locus. The maximum multipoint lod score of 11.49 occurred at the position of marker D2S2298 (Figure 2). Unfortunately, the 1-unit support interval did not narrow the peak of search region, rather it placed the disease locus somewhere between 0.33 cM distal to D2S4009 to 1.1 cM proximal to D2S4015. It should be noted, though, that multipoint analysis did eliminate marker GATA194B06 from consideration, based on 1-unit support, since the maximum multipoint lod score in the interval between D2S1346 and D2S2306, including GATA194B06, was 8.73.
Figure 2.
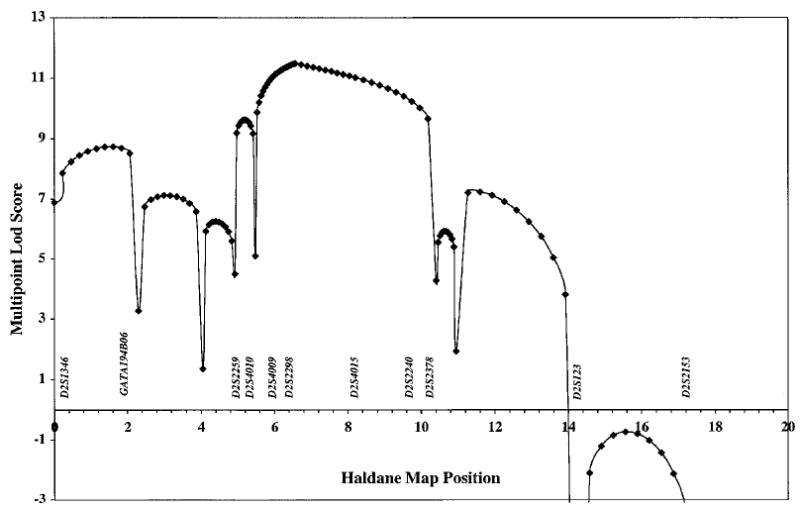
Multipoint analyses of markers genotyped in the sitosterolaemia pedigrees. Multipoint analysis was performed using SIMWALK, using markers indicated in Table 1, as described in Methods. Although pedigree 4000 showed a recombination event for markers Afm210xe9 and D2S4016 (see Results and Figure 3), since these markers have a recombination distance of 0.0, this event is not detected by SIMWALK (see text).
Haplotype analysis showed two informative recombinants, one in each of two different pedigrees (Figure 3). In Pedigree 200, a pedigree from the US, between markers D2S2240 and D2S2153, a recombination event was detected in one affected child and not in the other (cf. affected individuals 9 and 10, left pedigree, Figure 3). Note that marker D2S2291 is noninformative on the maternal chromosomes, thus the exact upper boundary for the recombination has not been established. This recombination places the disease locus distal to D2S2240. In Pedigree 700, a Japanese pedigree (middle panel, Figure 3), a recombination event, involving markers GA-TA194B06 to D2S2294 was detected in individual 37. Note that the distal boundary could not be accurately established, since the next polymorphic marker, D2S119, was uninformative in this family. The parental haplotypes were predicted, as the parental DNA was not available for direct genotyping.
Figure 3.
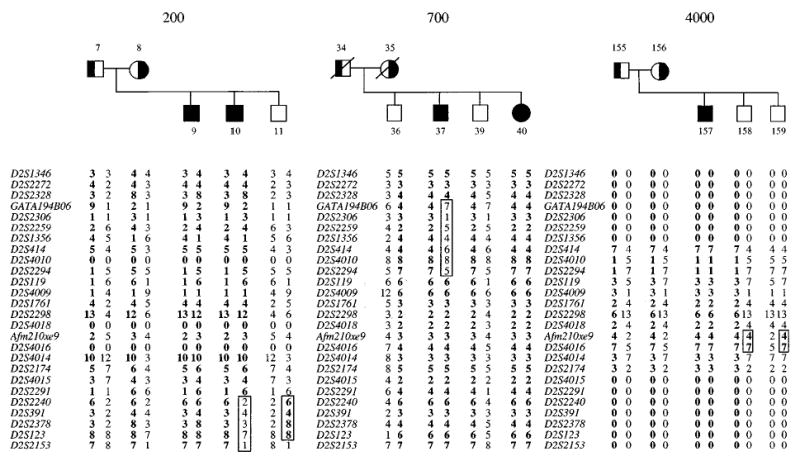
Recombination events that narrow the localisation of the sitosterolaemia gene. The lower limit of the sitosterolemia gene is defined by a recombination event detected in family 200, and the upper limit is defined by a recombination in pedigree 700. The parents in pedigree 700 are not available for genotype analyses. Additionally, two contiguous markers, Afm210xe9 and D2S4016, were recombinant in pedigree 4000, placing the sitosterolaemia locus either above or below these markers.
A summary of all the informative recombinant events detected in our cohort is shown in Figure 4A. Using SIMWALK (see Methods), a number of microsatellite markers had recombination distances of 0.0. We were able to order these markers, based upon a complete BAC contig constructed across this area (Lu et al, manuscript submitted). Thus, in family 4000 (Figure 3, right panel), we were able to detect a recombination event for two markers (Afm210xe9 and D2S4016), that was not reflected by the SIMWALK analyses. This would place the sitosterolaemia locus to lie in one of two intervals, D2S2294-Afm210xe9, or D2S4016-D2S2240. However, based upon homozygosity mapping (Figure 4B), we were able to localise the defect to the first interval and narrowed it to lie between D2S2294 – Afm210xe9 (see below).
Figure 4.
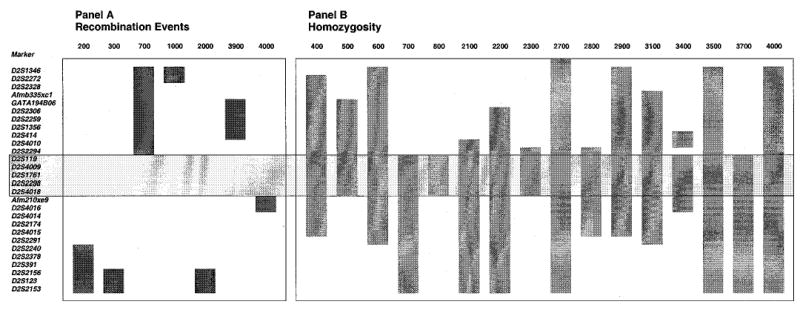
A summary of informative recombination events and homozygosity detected in all of the pedigrees. A indicates all the informative recombinant events detected, B shows probands that showed contiguous homozygosity for more than three markers, and where parental alleles were fully informative, either by direct analyses, or based upon predicted genotypes. Although the recombination events localise the sitosterolaemia gene to one of two regions, when combined with the homozygosity patterns, the gene can be localised to lie between D2S2294 and Afm210xe9 (boxed area, see text). Note that only pedigree 3400 is known to be consanguineous.
Linkage disequilibrium analysis
As the P values in Table 3 indicate, there is evidence for LD in this data-set, and the strongest evidence is at marker D2S2298. This marker is significant at the 0.05 level for both tests (HRR-LRT and HRR-2× n), and the estimated proportion of LD between marker and disease locus is λ=0.486, i.e., almost 50% LD. Sixty-three per cent of the affected children, who were genotyped for D2S2298, were homozygous at this marker, and this homozygosity was observed across families of different ethnic backgrounds (US, Finnish, Japanese, Amish, etc), illustrating why we observed such strong evidence for LD at this locus.
Table 3.
Linkage disequilibrium analysis for 28 markers
| Locus | HRR-LRT P value | HRR-2xn P value | λ |
|---|---|---|---|
| D2S1346 | 0.5 | 0.344 | 0 |
| D2S2272 | 0.014 | 0.039 | 0.348 |
| D2S2328 | 0.5 | 0.893 | 0 |
| Afmb335xcl | 0.5 | 0.187 | 0 |
| GATA194B06 | 0.5 | 0.986 | 0 |
| D2S2306 | 0.008 | 0.035 | 0.364 |
| D2S2259 | 0.5 | 0.525 | 0 |
| D2S1356 | 0.5 | 0.768 | 0 |
| D2S414 | 0.231 | 0.026 | 0.205 |
| D2S4010 | 0.5 | 0.067 | 0 |
| D2S2294 | 0.003 | 0.006 | 0.277 |
| D2S119 | 0.5 | 0.841 | 0 |
| D2S4009 | 0.051 | 0.02 | 0.183 |
| D2S1761 | 0.285 | 0.049 | 0.152 |
| D2S2298 | 0.0008 | 0.008 | 0.486 |
| D2S4018 | 0.5 | 0.559 | 0 |
| Afm210xe9 | 0.5 | 0.157 | 0 |
| D2S4016 | 0.481 | 0.026 | 0.031 |
| D2S4014 | 0.434 | 0.01 | 0.041 |
| D2S2174 | 0.5 | 0.084 | 0 |
| D2S4015 | 0.5 | 0.211 | 0 |
| D2S2291 | 0.5 | 0.481 | 0 |
| D2D2240 | 0.5 | 0.105 | 0 |
| D2S2378 | 0.5 | 0.729 | 0 |
| D2S391 | 0.5 | 0.788 | 0 |
| D2S2156 | 0.5 | 0.453 | 0 |
| D2S123 | 0.5 | 0.453 | 0 |
| D2S2153 | 0.5 | 0.051 | 0 |
The results from two LD tests are shown above (see Methods). Significant P values (<0.05) are highlighted in bold (see Results).
Other markers that show significance at the 0.05 level for both tests are D2S2294, D2S2306, and D2S2272. In each case, λ≥0.25, indicating more than 25% LD between marker and disease locus. Additionally, the set of markers D2S4009, D2S1761, and D2S2298 all show significant P values at the 5% level for the HRR-2× n (Table 3). These three markers, along with marker D2S119, also showed greatest two-point evidence for linkage (Table 2), and had maximum likelihood estimates of 0.0 recombination between disease and marker locus.
A visual examination of the haplotype data for markers in the 28 sitosterolaemia pedigrees suggests why we observe such strong evidence for LD, particularly with the D2S2298 marker. A number of affected individuals, including those from Amish (2200 and 2700), Japanese (700, 800, 2800, 3500 and 3700) and Caucasian US (2300, 3100 and 4000) pedigrees are homozygous for one allele at marker D2S2298 (see below). In addition, all affected children from the Amish pedigrees share the identical haplotype bounded by markers D2S4010 and D2S2240 (all genotypes are homozygous).
Homozygosity and founder effects
A priori, we expected to detect homozygosity for markers in affected individuals from the one known consanguineous marriage (pedigree 3400). Unexpectedly, we detected homozygosity in a number of affecteds from the other pedigrees (summarised in Figure 4B). All but one of the Japanese probands showed homozygosity for a number of contiguous markers. Only the proband from family 3300 was heterozygous for many of the markers in the critical region. The proband from one of the South African families (pedigree 500) was also homozygous. Two of the Caucasian American families (pedigrees 2300 and 3100) also showed homozygosity. The extent of the homozygosity is summarized in Figure 4B. Based upon homozygosity alone, the sitosterolaemia defect can be localised to lie between markers D2S2294 and D2S4018.
Interestingly, in addition to homozygosity, we also detected haplotype sharing, summarised in Figure 5. Thus, the two Amish/Mennonite families (pedigrees 2200 and 2700) showed extensive haplotype sharing across the sitosterolaemia locus. Although these two families were not known to be related initially, a concerted genealogical search allowed us to trace their lineages back to a potential of five founders,28 dating back to around the early 1700s (Figure 6). The four obligate carriers are indicated by large diamonds at the bottom. The first two are from family 2700 (individuals 103 and 104, Figure 6, see Figure 1) and the last two from family 2200 (individuals 73 and 74, Figure 6). The possible founders are indicated at the top. The names of the founders and their brief historical background are well-documented.28 The fewest number of generations linking any two of the obligate carriers is three, with a minimum of six generations linking all four together (Figure 6).
Figure 5.
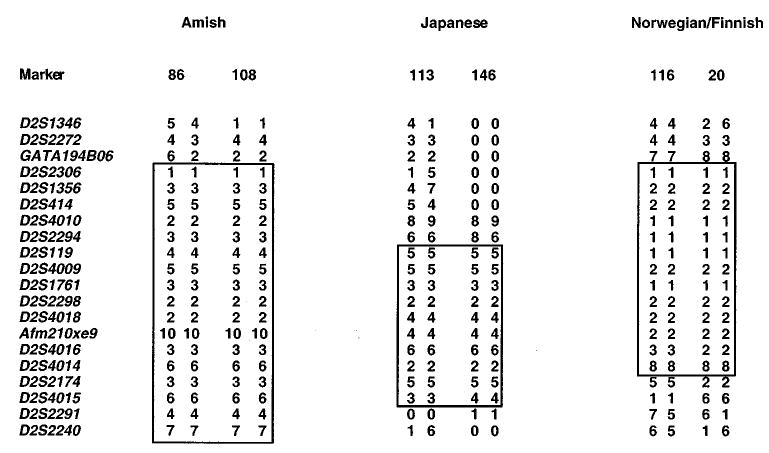
Haplotype sharing in some of the pedigrees. Comparison of haplotypes within the narrowed area of interest showed that the probands from the Amish and Mennonite families (left hand side), showed significant haplotype sharing as did two Japanese probands (middle panel). Additionally, a Norwegian and a Finnish proband (right hand side) also showed both homozygosity and haplotype sharing.
Figure 6.
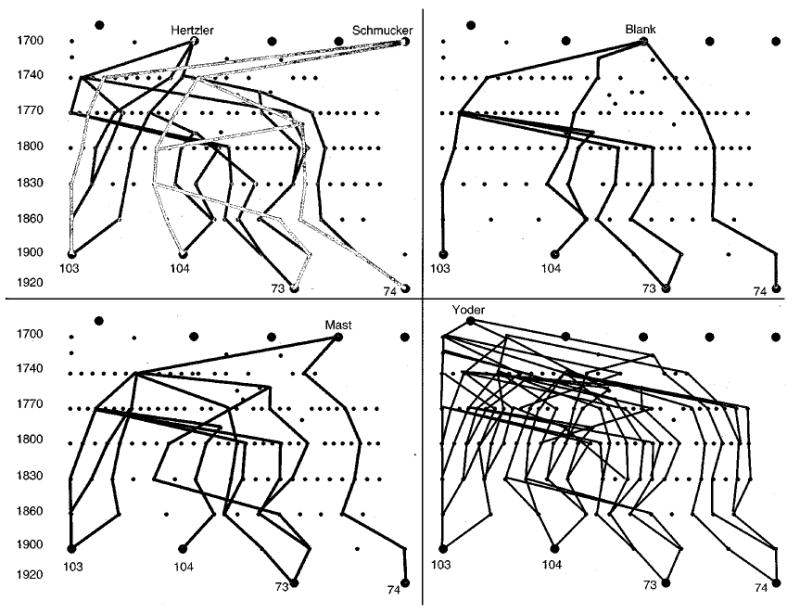
Genealogical analyses of the Amish and Mennonite families in this study. A genealogical analysis of the parents from pedigrees 2700 and 2200 (as indicated) was performed as described in Methods. Five possible founders, that link all four parents, were identified. An approximate time index is as shown in the left margin for temporal orientation. As can be seen, individual 74 is the least related to all of the remaining three obligate carriers. Of the possible founders, the Yoder line has the most frequent interconnections, and the Blank lines the least. The small dots indicate a generation. The ‘Amish’ mutation is at least 200 years old.
We have three families/probands from Scandinavia (400, 2900, and 3900). Of these pedigrees, 400 and 3900 are Finnish, and pedigree 2900 is Norwegian. Interestingly, homozygosity and haplotype-sharing between probands from family 400 and 2900 was detected (Figures 4 and 5). All of the probands showed considerable allelic variance outside of the region of interest, suggesting that DNA contamination or experimental artifacts were not the reason for this. Apparent homozygosity can be detected if there is a deletion of a chromosomal region on one of the alleles (the proband being heterozygous for the mutant alleles). However, as the parents were available for genotyping and were informative, chromosome deletion was an unlikely possibility. Allele frequency for markers D2S2294 and D2S119 were examined in randomly selected normal individuals from Finland and Norway (Table 4). Compared to the general population, the frequency of the alleles for these two markers in the parents of the affected individuals (obligate carriers) was almost double, further supporting the concept of a founder effect. There does not appear to be a more recent genealogical link between these families (L Ose and T Miettnen, personal observations). Additionally, the two ‘Finnish’ families appear to be unrelated to each other and do not share any of the haplotypes. The proband in the Finnish family 3900 is heterozygous for all of the informative markers in this region, suggesting that she may be a compound heterozygote for the sitosterolaemia gene mutation. Finally, although several of the Japanese probands show homozygosity across the region of interest, only two of them (pedigrees 2800 and 3700) share the haplotypes (Figure 5). These families also do not appear to be related through more recent generations.
Table 4.
Allele frequencies in normals, parents and probands from Norway and Finland
| Marker | Allele | Finnish (n=62) | Norwegian (n=98) | Parents (n=12) | Probands (n=8) |
|---|---|---|---|---|---|
| D2S119 | 1 | 0.19 | 0.16 | 0.5 | 0.88 |
| 2 | 0 | 0 | |||
| 3 | 0 | 0.02 | |||
| 4 | 0.16 | 0.09 | |||
| 5 | 0.19 | 0.22 | 0.17 | ||
| 6 | 0.44 | 0.28 | 0.33 | 0.1 | |
| 7 | 0.02 | 0.18 | |||
| 8 | 0 | 0.02 | |||
| 9 | 0 | 0.03 | |||
| D2S2294 | 1 | 0.16 | 0.21 | 0.33 | 0.75 |
| 2 | 0.02 | 0.04 | |||
| 3 | 0.21 | 0.17 | 0.33 | 0.25 | |
| 4 | 0.05 | 0 | |||
| 5 | 0.35 | 0.26 | 0.33 | ||
| 6 | 0.15 | 0.06 | |||
| 7 | 0.06 | 0.26 | |||
| 8 | 0 | 0 |
Allele frequencies from normal unrelated individuals, parents and probands from two Finnish and one Norwegian family were computed for the markers shown. D2S119, allele 1 and D2S2294, allele 1 show considerably increased frequencies in the parents and probands than the normal population.
Discussion
Under normal circumstances, mammals can distinguish between dietary cholesterol and non-cholesterol sterols, such that only cholesterol is absorbed and retained by the body. The majority of non-cholesterol sterols that are thus excluded by the human body comprise mainly of plant sterols (as we eat a mixed diet), such as sitosterol, campesterol, stigmasterol etc. In addition, sterols found predominantly in shellfish, such as 22-dehydrocholesterol, isofucosterol, brassicasterol are also normally not retained by the body. The molecular mechanism(s) by which this exclusion process is carried out is unknown. Elucidation of the autosomal recessive disorder of sitosterolaemia may shed light on this process. In this condition, affected individuals hyperabsorb all sterols and loose the ability to selectively absorb only cholesterol from the diet. Affected probands also show a defect in sterol excretion via the bile, with a consequent expansion of whole-body sterol pools and increase in premature atherosclerotic disease, with fatal consequences.3,29
We have previously mapped the sitosterolaemia locus to human chromosome 2p21, to a 15 cM interval.4 We report in this study, a further delineation of the sitosterolaemia locus to an area no larger than 2 cM and characterise the genetics further, by examining a total of 30 pedigrees.
All the pedigrees assembled to date map to chromosome 2p21 and to date, no evidence for genetic heterogeneity has been found. Our pedigrees have been assembled from a number of different geographical and ethnic origins. Based upon informative recombination events, the sitosterolaemia locus can be localised to an area bounded by the micro-satellite markers DS2294 and D2S2298, a distance of approximately 1 MB (Lu et al, manuscript submitted). Additionally, we have identified homozygosity in apparently nonconsanguineous marriages and haplotype sharing within probands from geographical areas. The region of homozygosity and haplotype sharing is concordant with the localisation of the sitosterolaemia locus based upon recombination events, further narrowing the locus to lie within the D2S2294-Afm210xe9 interval.
Homozygosity was detected in probands of Japanese, Finnish/Norwegian, Indian South African, Amish/Mennonite and US White Caucasian extraction. Only one family was known to be consanguineous, even though sitosterolaemia is relatively rare. In two previously ‘unrelated’ Amish/Mennonite families, we were able to establish, both by genealogy, as well as by genotyping, that the mutated disease allele may have brought to the US by the first Amish settlers.28 Although many of the Amish/Mennonite founders originated from German-speaking Switzerland, many had lived in the Alsace and Palatinate regions before emigrating to the US.28 We are not aware of any reports of sitosterolaemia in current residents of Switzerland or France. The closest geographical family is a Dutch family (pedigree 2500), that did not share any haplotypes with the affected Amish-Mennonite probands. Interestingly, two out of three pedigrees from the Norway/Finland not only showed homozygosity, but they also exhibited haplotype sharing. Furthermore, markers from the region of interest showed a significantly different allele frequency compared with randomly chosen individuals from Norway and Finland. This would suggest that a single founder gave rise to the ‘Finnish/Norwegian’ mutation and is responsible for the occurrence of the disease. An alternative interpretation is that the two families are linked by genealogy more recently (cf. the Amish above), and that a more recent emigration of the carriers may account for the observations. While founder effects have been identified for the Finnish population for other disease loci,30 – 32 to date, there are no reports of common founders that link the Norwegian and Finnish populations. This would be the first report of such an occurrence.
Using recombination events, the sitosterolaemia gene can be localised to lie between microsatellite markers D2S2294 and D2S2291, a distance of about 5 cM. Additionally, combining the data from homozygosity and haplotype sharing, we can further narrow the region to lie between D2S2294 and Afm210xe9, a distance of 2.5 cM. However, from our BAC contig maps (Lu et al, manuscript submitted), this area is no larger than about 1 MB.
Acknowledgments
We are indebted to Marian Payne, David Smucker (Lancaster Mennonite Society), and Janice A Egeland for help with Amish genealogy, and Ajay Sood for help with Figure 6. We also thank Dr Marcella Devoto for discussions about linkage disequilibrium, Dr Anand Srivastava for expert advice and Starr Hazard and the BioMolecular Computing Resource for assistance with computation. This work was funded by a Scientist Development Award from the American Heart Association grant 9730087N (SB Patel), by the National Institutes of Health grants HL60616 (SB Patel), HG00008 (J Ott), MO1 RR01070-25 (MUSC GCRC), and by an intramural award from the University Research Committee, Medical University of South Carolina (SB Patel).
References
- 1.Bhattacharyya AK, Connor WE. Beta-sitosterolemia and xanthomatosis. A newly described lipid storage disease in two sisters. J Clin Invest. 1974;53:1033 – 1043. doi: 10.1172/JCI107640. [DOI] [PMC free article] [PubMed] [Google Scholar]
- 2.Bjorkhem I, Boberg KM: in Scriver CR, Beaudet AL, Sly WS, Valle D (eds): The Metabolic Basis of Inherited Disease McGraw-Hill Inc., New York, 1995 pp 2073 – 2102.
- 3.Salen G, Shefer S, Nguyen L, et al. Sitosterolemia. [Review] J Lipid Res. 1992;33:945 – 955. [PubMed] [Google Scholar]
- 4.Patel SB, Salen G, Hidaka H, et al. Mapping a gene involved in regulating dietary cholesterol absorption. The sitosterolemia locus is found at chromosome 2p21. J Clin Invest. 1998;102:1041 – 1044. doi: 10.1172/JCI3963. [DOI] [PMC free article] [PubMed] [Google Scholar]
- 5.Bhattacharyya AK, Connor WE, Lin DS, McMurry MM, Shulman RS. Sluggish sitosterol turnover and hepatic failure to excrete sitosterol into bile cause expansion of body pool of sitosterol in patients with sitosterolemia and xanthomatosis. Arteriosclerosis Thrombosis. 1991;11:1287 – 1294. doi: 10.1161/01.atv.11.5.1287. [DOI] [PubMed] [Google Scholar]
- 6.Salen G, Shore V, Tint GS, et al. Increased sitosterol absorption, decreased removal, and expanded body pools compensate for reduced cholesterol synthesis in sitosterolemia with xanthomatosis. J Lipid Res. 1989;30:1319 – 1330. [PubMed] [Google Scholar]
- 7.Salen G, Tint GS, Shefer S, Shore V, Nguyen L. Increased sitosterol absorption is offset by rapid elimination to prevent accumulation in heterozygotes with sitosterolemia. Arteriosclerosis Thrombosis. 1992;12:563 – 568. doi: 10.1161/01.atv.12.5.563. [DOI] [PubMed] [Google Scholar]
- 8.Beaty TH, Kwiterovich Jr P, Khoury MJ, et al. Genetic analysis of plasma sitosterol, apoprotein B, and lipoproteins in a large Amish pedigree with sitosterolemia. Am J Hum Genet. 1986;38:492 – 504. [PMC free article] [PubMed] [Google Scholar]
- 9.Patel SB, Honda A, Salen G. Sitosterolemia: exclusion of genes involved in reduced cholesterol biosynthesis. J Lipid Res. 1998;39:1055 – 1061. [PubMed] [Google Scholar]
- 10.Kwiterovich Jr P, Bachorik PS, Smith HH, et al. Hyperapober-alipoproteinaemia in two families with xanthomas and phytosterolaemia. Lancet. 1981;1:466 – 469. doi: 10.1016/s0140-6736(81)91850-x. [DOI] [PubMed] [Google Scholar]
- 11.Salen G, Horak I, Rothkopf M, et al. Lethal atherosclerosis associated with abnormal plasma and tissue sterol composition in sitosterolemia with xanthomatosis. J Lipid Res. 1985;26:1126 – 1133. [PubMed] [Google Scholar]
- 12.Hidaka H, Nakamura T, Aoki T, et al. Increased plasma plant sterol levels in heterozygotes with sitosterolemia and xanthomatosis. J Lipid Res. 1990;31:881 – 888. [PubMed] [Google Scholar]
- 13.Hidaka H, Yasuda H, Kobayashi M, et al. Familial spinal xanthomatosis with sitosterolemia. Int Med. 1992;31:1038 – 1042. doi: 10.2169/internalmedicine.31.1038. [DOI] [PubMed] [Google Scholar]
- 14.Berger GM, Deppe WM, Marais AD, Biggs M. Phytosterolaemia in three unrelated South African families. Postgrad Med J. 1994;70:631 – 637. doi: 10.1136/pgmj.70.827.631. [DOI] [PMC free article] [PubMed] [Google Scholar]
- 15.Lutjohann D, Bjokhem I, Ose L. Phytosterolaemia in a Norwegian family: diagnosis and characterization of the first Scandinavian case. Scand J Clin Lab Invest. 1996;56:229 – 240. doi: 10.3109/00365519609088612. [DOI] [PubMed] [Google Scholar]
- 16.Hidaka H, Sugiura H, Nakamura T, et al. beta-Sitosterolemia with generalized eruptive xanthomatosis. Endocrin J. 1997;44:59 – 64. doi: 10.1507/endocrj.44.59. [DOI] [PubMed] [Google Scholar]
- 17.Berger GM, Pegoraro RJ, Patel SB, et al. 3-hydroxy 3-methylglutaryl coenzyme A reductase is not the site of the primary defect in phytosterolemia. J Lipid Res. 1998;39:1046 – 1054. [PubMed] [Google Scholar]
- 18.Weeks DE: RECODE a program for recoding base-pair sized alleles into interger-numbered alleles. ftp://watsonhgenedu/pub/recodetarZ 2000.
- 19.Terwillinger JD, Ott J: Handbook of Human Genetic Linkage Johns Hopkins University Press, Baltimore, 1994.
- 20.Lathrop GM, Lalouel JM, Julier C, Ott J. Strategies for multilocus linkage analysis in humans. Proc Natl Acad Sci USA. 1984;81:3443 – 3446. doi: 10.1073/pnas.81.11.3443. [DOI] [PMC free article] [PubMed] [Google Scholar]
- 21.Cottingham Jr RW, Indury RM, Schaffer AA. Faster sequential genetic linkage computations. Am J Hum Genet. 1993;53:252 – 263. [PMC free article] [PubMed] [Google Scholar]
- 22.Schaffer AA, Gupta SK, Shriram K, Cottingham Jr RW. Avoiding recomputation in linkage analysis. Hum Hered. 1994;44:225 – 237. doi: 10.1159/000154222. [DOI] [PubMed] [Google Scholar]
- 23.Sobel E, Lange K. Descent graphs in pedigree analysis: applications to haplotyping, location scores, and marker-sharing statistics. Am J Hum Genet. 1996;58:1323 – 1337. [PMC free article] [PubMed] [Google Scholar]
- 24.Broman KW, Murray JC, Sheffield VC, White RL, Weber JL. Comprehensive human genetic maps: individual and sex-specific variation in recombination. Am J Hum Genet. 1998;63:861 – 869. doi: 10.1086/302011. [DOI] [PMC free article] [PubMed] [Google Scholar]
- 25.Terwilliger JD. A powerful likelihood method for the analysis of linkage disequilibrium between trait loci and one or more polymorphic marker loci. Am J Hum Genet. 1995;56:777 – 787. [PMC free article] [PubMed] [Google Scholar]
- 26.Edwards AFW: Likelihood Expanded Johns Hopkins University Press, Baltimore, 1992.
- 27.Ott J: Analysis of Human Genetic Linkage Johns Hopkins University Press, Baltimore, 1999.
- 28.Gingerich HF, Kreider RW: Amish and Amish Mennonite Genealogies Pequea Publishers, Gordonville, PA, 1986.
- 29.Miettinen TA. Phytosterolaemia, xanthomatosis and premature athersclerotic arterial disease: a case with high plant sterol absorption, impaired sterol elimination and low cholesterol synthesis. Eur J Clin Invest. 1980;10:27 – 35. doi: 10.1111/j.1365-2362.1980.tb00006.x. [DOI] [PubMed] [Google Scholar]
- 30.Hastbacka J, de la Chapelle A, Kaitila I, et al. Linkage disequilibrium mapping in isolated founder populations: diastrophic dysplasia in Finland [published erratum appears in Nat Genet 1992 Dec;2(4):343] Nat Genet. 1992;2:204 – 211. doi: 10.1038/ng1192-204. [DOI] [PubMed] [Google Scholar]
- 31.Peltonen L. Molecular background of the Finnish disease heritage. Ann Med. 1997;29:553 – 556. doi: 10.3109/07853899709007481. [DOI] [PubMed] [Google Scholar]
- 32.de la Chapelle A, Wright FA. Linkage disequilibrium mapping in isolated populations: the example of Finland revisited. Proc Natl Acad Sci USA. 1998;95:12416 – 12423. doi: 10.1073/pnas.95.21.12416. [DOI] [PMC free article] [PubMed] [Google Scholar]