

SYNOPSIS
Objectives
The purpose of this work is to formally model patterns of intimate partner violence (IPV) separately for males and females and to assess the unique contributions of different types of violence exposure to health related outcomes.
Methods
sing data from the National Violence Against Women Survey—a national probability sample of U.S. men and women—latent class analyses produced a map of the underlying structure of IPV for both males and females that is defined by specific types of violent acts. Multivariable logistic regression analyses assessed the differential physical health, mental health, and substance use consequences of exposure to IPV by gender.
Results
Women and men experience similar types of IPV, although the prevalence of the different types of violence is much greater for women than men. Second, exposure to IPV for both women and men is associated with a range of negative health outcomes including increased odds of poor physical health and physical disability, psychological distress and mental illness, and heightened recreational and non-recreational substance use. Finally, there is some evidence that experiences with IPV have stronger and broader associations with negative health outcomes among women, likely reflecting differences in the severity of violence experienced by men and women.
Conclusions
More attention to the ways in which interpersonal violence is conceptualized, measured, and screened for is crucial. Specifically, while women have greater exposure to IPV, and subsequently a greater range of health problems, the effects on men should not be ignored.
Evidence from a wide variety of sources shows intimate partner violence (IPV) to be associated with negative physical and psychological health effects.1,2 Although early assessments of the consequences of IPV were based on clinical samples and data from mental health professionals, recent evidence from population-based studies shows similar associations both in the immediate and long term.3–7 This study adds to existing research in three ways: first, we formally model specific patterns or types of IPV that characterize intimate relationships over time. Virtually all of the extant research in this area considers IPV as an event or operationalizes it in terms of the severity or extent of violence experienced. In contrast, our approach formally examines IPV as a multi-dimensional experience that includes the patterning of a range of behaviors. Second, we examine the effects of different types of IPV on a wide range of health outcomes. These include: (1) self-perceived health, the presence of injury or disease-based disability, and (among women) the likelihood of experiencing a miscarriage; (2) psychological well-being as indicated by depressive symptoms and mental health disability; and (3) substance use, including alcohol consumption and a range of palliative and recreational drugs. Third, we examine similarity and difference in associations by gender, specifically by explicitly examining differences in health outcomes between men and women.
METHODS
For this research, we analyzed data from the National Violence Against Women Survey (NVAWS) contracted to Tjaden and Thoennes.8 This survey used random-digit dialing to survey 8,005 men and 8,000 women representative of the non-institutionalized U.S. population. They drew a simple random sample of working residential phone numbers and conducted interviews from November 1995 to May 1996. Reported response rates were 72.1% for females and 68.9% for males,8 which compare favorably to other national surveys. Extensive in scope, the survey covered individuals’ perceptions of safety and their victimization experiences—sexual assault, physical assault in both childhood and adulthood, threats, and stalking—from a wide range of perpetrators, including strangers, various acquaintances, dates, boyfriends and girlfriends, parents, caregivers and other family members, and both current and former partners. In addition to initial screening questions, respondents who reported experiences with violence responded to a follow-up incident module. The interview also included questions on the demographic characteristics and health status of the respondent. Due to our focus on IPV, we restricted our sample to those respondents who reported having at least one intimate partner (N=5,991 for females and N=5,867 for males). This could include both cohabiting relationships and marriages.
Measures of lifetime intimate partner violence
IPV is defined in this study as experiences with physical victimization, sexual assault, and stalking by either a current or former spouse or a cohabiting intimate partner. In the NVAWS, respondents were asked a series of questions that resembled items from the conflict tactics scale (CTS).9 Specific items include: pushing/shoving, pulling hair, slapping, kicking, choking, beating up, throwing or hitting with an object, and the threat or use of a weapon (i.e., gun, knife, or other). Although these items are behaviorally similar to those in the CTS, NVAWS respondents were not provided with the traditional CTS “lead in,” which asks respondents to reflect on ways couples try to resolve conflicts. Instead, the NVAWS respondents were explicitly asked to report on “physical violence” they may have experienced within given relationships. Sexual assault was defined as forced sex by an intimate partner and included completed vaginal, anal, or oral sex. Stalking was measured using a range of items and included an intimate partner who followed or spied on you, sent unsolicited letters or written correspondence, made unsolicited calls, stood outside a home, place of work, or recreation, showed up at places even though he or she had no business being there, left unwanted items for you to find, or tried to communicate against your will. Respondents were also afforded the opportunity to include other behaviors, and a small proportion did (e.g., killed a pet, kidnapped, trespassed, threatened family members). Respondents were coded as “stalked” if they reported that the behavior had occurred on more than one occasion and that they were either “very frightened” by these behaviors or believed that they or someone close to them would be seriously harmed or killed during the harassment. Although our measures are quite broad in comparison to most prior work in this area, they do not include other behaviors sometimes considered within the constellation of IPV. Notably, we do not include measures of “emotional” or “psychological” abuse because we wish to be reasonably consistent with prior work on the health consequences of IPV and because there is less professional or social scientific consensus on what constitutes these types of abuse, particularly with respect to the conceptual and operational boundaries of the phenomenon. Still, such inquiry is an important vein of future research and something we are considering in our ongoing investigations of IPV.
Socio-demographic characteristics
In light of well-recognized social differentiation in physical health, mental health, and substance use, our examination of the health consequences of IPV statistically controls for a number of salient respondent characteristics. First, we implicitly control for sex by examining IPV-health associations for males and females. Second, we control for characteristics that have been shown to influence physical and psychological well-being.10–12 These include age (ranging from 18 to 65), race (white [reference], African American, Hispanic, Asian, Native American or multi-racial, or Missing), educational attainment (ranging from 1=no schooling to 7=post-graduate degree), marital status (married, divorced, separated, or widowed [reference]) and main activity (full-time employed, part-time employed, unemployed and looking for work, or other [e.g., student, retired] [reference]). We also controlled for household income (from 1=less than $5,000 to 10=More than $100,000); in cases in which data on household income was missing, we performed mean substitution and included a dummy variable indicating that information was missing. Effects for the missing dummy were never statistically significant. Finally, we also controlled for poverty (a proxy variable measuring whether the respondent was without phone service during the previous year [coded 1]). Preliminary regression analysis shows that household income and race are very strong predictors of the loss of phone service, supporting the contention that it serves as a useful proxy for poverty or extremely low income.
Health status
Health status in the NVAWS data is measured with an extensive battery of outcomes. In general, we consider (1) physical health, (2) mental health, and (3) substance use. Current physical health is measured by a self-report item asking respondents, “In general, would you say your health was . . . excellent, very good, good, fair or poor?” To be consistent with prior work,3 we created a dichotomous variable that distinguished respondents reporting “poor health” (2% for males; 3% for females) from all others. Injury disability is measured by the question, “Have you ever sustained a serious injury, such as a spinal cord, neck, or head injury, that is disabling or interferes with your normal activities?” Eleven percent of males and 8% of females reported such a disability. Identification of chronic disability was based on a similar question and focused on such conditions as heart and circulatory problems, connective tissue disease, lung disease, diabetes, cancer, muscle and nerve disorders, stomach ailments, severe headaches, osteoporosis, chronic pain or fatigue, or HIV/AIDS. Ten percent of males and 11% of females reported such a disability. A third health outcome, having had a miscarriage, was asked explicitly of women and was reported by just over a quarter (26%) of sampled women.
A second domain of health status is mental health and psychological distress. Current depressive symptoms were assessed using questions drawn from the SF-36 Health Survey.13 Specifically, eight of the original 13 items which comprise the Beck Depression Inventory (BDI)14 were included. These items provided information on how often in the previous week respondents reported feeling “nervous,” “down in the dumps,” “downhearted and blue,” “worn out,” “tired,” and “full of pep,” having a “lot of energy,” and being a “happy person” (the last three are reverse-coded). Again, to be consistent with prior work,3 we used a cut point of >20 (on a scale ranging from 8 to 32) to create a dichotomous measure. Seven percent of males and 13% of females reported significant depressive symptoms. Even more extreme mental distress is measured by an item assessing mental health disability. This is based on an item asking, “Do you have a chronic mental health disease or condition . . . that is disabling or interferes with your normal activities?” Conditions identified included depression, anxiety, bipolar personality, schizophrenia, and chronic fatigue. Mental health disability was reported by 2% of both males and females.
The final domain of health we considered is substance use. Alcohol consumption is measured by an item asking, “During the last 12 months, how often did you usually drink any alcoholic beverage?” To measure chronic alcohol consumption, we recoded this measure to distinguish those who drank “every day” from all others. Four percent of males and 2% of females reported drinking every day. We further considered a range of drug use, including tranquilizers, sleeping pills or sedatives, antidepressants, and prescription pain pills, as well as recreational drugs such as amphetamines, marijuana, crack, heroin, or angel dust. Prevalence of use varied, with the lowest use being for recreational drugs (3% for males and 2% for females) and the highest prevalence for prescription pain pills (8% for males and 11% for females). Descriptions and univariate statistics for all measures can be found in Table 1.
Table 1.
Descriptive statistics, NVAWS 1995–96

NVAWS = National Violence Against Women Survey
SD = standard deviation
In most cases, temporal order is established with IPV occurring prior to current self-reported health, current depressive symptoms, and current alcohol and drug use. Temporal order is less clear in the cases of disability and miscarriage, as it is impossible to date when specific violent incidents occurred. The survey instrument asked questions only about when a specific incident first happened and when it last happened. As our research strategy explicitly examines multiple incidents from multiple intimate partners, it is very difficult if not impossible to pinpoint with any real precision when a pattern of violence took place. We did, however, examine an extensive list file with the specific year of onset for the three forms of disability and the best estimate of the beginning and end for our IPV profiles. In the vast majority of cases, IPV appears before disability in the life course.
Exclusions
We included two restrictions in generating our analytic samples. First, as indicated earlier, we included only respondents who reported having had a previous intimate partner. This was based on three questions in the NVAWS data.15 The first was, “Are you currently . . . married, common-law relationship, divorced, separated, widowed, single and never married?” The second was, “(Not counting your current husband (wife)/common-law partner) how many (other) men (women) have you been married to?” The third was, “(Not counting any current partner or previous husbands (wives)) how many other men (women) have you lived with as a couple?” From these three questions, we identified all respondents who reported that they had lived at some point with an intimate partner. Second, we restricted our sample to include only respondents under the age of 65 so as to be consistent with recent work with these data.3 As we also have respondents who have missing data on specific items, our analytic samples fluctuate somewhat. For males, sample sizes range from 5,434 to 5,559. For females, sample sizes range from 5,520 to 5,626.
Analytic strategy
Our analyses proceeded in two stages. In the first, we modeled patterns of IPV based on eight measures of physical violence, sexual assault, and stalking. We included the latter two variables in our models to incorporate other dimensions of physical aggression that prior work has associated with significant multifaceted or “power-controlling” violence.8,16–18 In order to limit sparseness in the cross-classification (which can undermine estimation), we combined two of the physical violence items, specifically “choking” with “beating up,” and “throw object” with “hit with object.” Sensitivity analyses showed that combining these items did not significantly alter the latent classes that were generated. We used latent class analysis to model patterns of IPV that are comprised of multiple items. Latent class analysis is a means of assessing the underlying association between a set of categorical variables.19,20 It does so by assuming that each observation is a member of one and only one of T latent or unobserved classes and that manifest variables are independent of one another conditional on latent class membership. The model can be expressed in terms of unconditional probabilities of belonging to each latent class and the conditional response probabilities for manifest variables given latent class. The case of three manifest variables yields the following model:
 |
where πtX denotes the probability of being in latent class t=1, 2, . . .T of latent variable X; πitA|X denotes the conditional probability of obtaining the ith response to variable A from members of class t, i=1, 2, . . .I; and πjtB|X and πltC|X, j=1, 2, . . . J and k=1, 2, . . .K, denote the corresponding conditional probabilities for variables B and C. A typical goal is to identify the smallest number of latent classes that explain the associations between manifest variables.
For the current project, this approach has specific utility. First, it can map out the underlying structure of IPV defined by specific types of violent acts. The number of latent classes reveals the extent of heterogeneity in IPV within the population. Second, specific classes of violence are defined by the conjoint conditional probabilities of specific violent acts. Third, latent class probabilities indicate prevalence of each given class of violence in the sampled population. This allows us to see more common and less common patterns of violence. Finally, akin to cross-sample reliability assessment, we can then compare conditional probabilities and latent class probabilities for particular patterns or classes of violence across gender to assess similarity and difference in the fundamental structure of IPV for males and females.
The second aspect of our research examined the association between IPV and the various health outcomes described earlier. To do so, we modeled the relative odds of particular health consequences using multivariable logistic regression. This approach models the probability of a particular health outcome as a function of a set of covariates. Formally, this model takes the form:
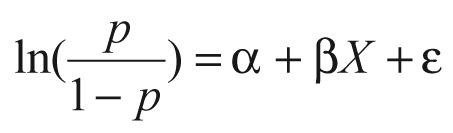 |
where ln is the natural logarithm, p is the probability that a particular health outcome is observed (e.g., injury disability), α is the coefficient on the constant term, β is a coefficient(s) on the independent variable(s), X is an independent variable(s), and ε is the error term.21 In each of our models, we focused attention on the increase or decrease in the odds of a particular health outcome associated with experiences with IPV while controlling for the sociodemographic characteristics described earlier. We exponentiated the β coefficient associated with the different types of IPV to indicate the adjusted odds ratios (OR) of a particular health outcome. In doing so, we were able to differentiate the effects of IPV both within and across gender and gain a more nuanced understanding of the health consequences of IPV.
RESULTS
The first stage of our research modeled IPV using latent class analysis. We began by examining goodness of fit for one, two, three, and four classes of IPV. In both cases, the models of independence (or one-class models) showed an extremely poor fit to the data, revealing that IPV manifests itself as configurations or patterns of violent acts. At the same time, two, three, and four class models all fit the data based on the likelihood ratio chi-square statistic and corresponding degrees of freedom. As each of these models can be seen as suitable representations of the data, we used Raftery’s Bayesian Information Criterion (BIC)22 to select the most parsimonious model. For both genders, the four-class model had the lowest BIC statistic. This four-class model was selected as the most parsimonious, based on the BIC statistics and the adequate fit determined by the likelihood ratio chi-square statistic and index of dissimilarity. General information on model fit statistics in latent class analysis can be found in Clogg23 and McCutcheon.24 Full details of the goodness of fit statistics may be obtained from the first author.
Patterns of IPV
Given four class models, Table 2 shows conditional probabilities of specific violent acts within given latent classes, as well as latent class probabilities that show the prevalence of specific classes or patterns of violence within the sampled population of American men and women. The first class (Class I) for both males and females is restricted to involve no IPV. For all items, the conditional probability of experiencing specific violent acts is 0.00. While these models reveal the substantive fact that most interpersonal relationships are not characterized by violence, the estimation of this class also provides us with non-victims as a comparison group in our logistic regression models. This class characterizes 91.7% of American males. It is, however, less prevalent among women, as only 77% of U.S. women reported no IPV.
Table 2.
Latent class and conditional probabilities; lifetime partner victimization, NVAWS 1995–1996

NOTES: Goodness of fit statistics (males): Lambda=0.748; chi-square=174.338; degrees of freedom=485; Bayesian Information Criterion = –4,071.047
Goodness of fit statistics (females): Lambda=0.801; chi-square=448.006; degrees of freedom=482; Bayesian Information Criterion = –3,797.339
NVAWS = National Violence Against Women Survey
IPV = intimate partner violence
A second class for both genders is characterized by a low prevalence of any specific violent act. Such low probabilities indicate that this type of violence is not likely to be multifaceted. Following Macmillan and Gartner, we consider this interpersonal conflict violence (Class II).25 This pattern of violence characterizes 3.4% of the sampled male population, and all probabilities of violence are less than 0.25; seven of nine are less than 0.09. For males, the only violent acts that have any substantive probability are having been hit with or having an object thrown at them (0.24) and having been slapped (0.22). This type of violence is more prevalent among women and characterizes 11.3% of the sampled population. Still, as with men, it involves a generally low likelihood of violence as all conditional probabilities are less than 0.50 and six of nine are less than 0.10. Here, a woman has the highest probability of being pushed (0.48) and being slapped (0.31). Although the likelihood for females of each type of violent act is somewhat higher than it was in Class II for males, the overall pattern for both genders is quite similar in that it is not multifaceted and is restricted to specific violent acts.
A third type of violence is characterized by more extensive and more varied probabilities. In general, this class suggests a pattern of violence that is multifaceted, but not involving acts requiring a sustained activity or use of force (such as stalking and sexual assault). We consider this pattern physical aggression (Class III). Characterizing 3.3% of the U.S. men, likelihood is particularly high among males for having been pushed (0.92), having been slapped (0.82), and having been hit or had an object thrown at them (0.68). Likelihood is somewhat lower for the other types of physical violence (<0.25) as well as for sexual assault and stalking (0.00).
Again, a similar type of violence is more prevalent among women, characterizing 8.2% of the female sample. Here, a woman’s likelihood is very high for having been pushed (0.97), slapped (0.97), and having been choked or beaten up (0.72). She also has an elevated probability of having had hair pulled (0.54) and having been hit by or having an object thrown at her (0.41), having been kicked (0.27), and having been threatened or attacked with a weapon (0.24). The probability of being stalked (0.15) or sexually assaulted (0.12) is considerably lower. Thus, while women have elevated probabilities of additional violent acts, the overall pattern is similar to that of men; the violence experienced by both males and females in this class tends not to involve sustained activity or use of force.
The final type of violence is least prevalent for both genders and involves extensive, multifaceted violence. In light of both the high probability of multiple forms of violence and a higher likelihood of experiencing violence requiring a sustained use of force (e.g., choking, beating) and stalking, this pattern of violence can be seen as systematic abuse (Class IV).25 This pattern of violence characterizes 1.6% of the male sample. Here there is a very high likelihood of a man having been pushed (0.99), having been slapped (0.99), having been kicked (1.00), and having been hit by or having had an object thrown at him (1.00). Importantly, likelihood is also high for having had hair pulled (0.75), having been threatened or attacked with a weapon (0.55) and having been choked or beaten up (0.41). Although the probablity of sexual assault is low in this class (0.01), likelihood of having been stalked is comparatively high (0.16).
Women in our sample experienced systematic abuse at a rate more than two times that of men (3.5% versus 1.6%). Women in this class also experienced multifaceted types of violence, including a substantial likelihood of sexual assault and stalking. The women’s probabilities are extremely high for having been pushed (0.99), having had hair pulled (0.97), being slapped (0.99), being kicked (0.83), being hit with or having an object thrown at her (1.00), and being choked or beaten up (0.96). Likelihood is also substantial for having been threatened or attacked with a weapon (0.62). Equally important, this class of violence is characterized by comparatively high probabilities of having been stalked (0.47) and having been sexually assaulted (0.24).
Associations with physical health outcomes
Table 3 shows the adjusted odds ratios (ORs) for the associations between the different types of IPV described above and various measures of physical health. Each dimension of health is defined by the rows of the table, with IPV and gender defining the columns. Corresponding cell entries include the adjusted odds ratio and 95% confidence intervals (CIs) for the estimates in parentheses. These odds ratios are interpreted as the increase or decrease in the odds of a respondent who experienced a particular pattern of IPV reporting a particular health outcome relative to those who did not experience any IPV.
Table 3.
Adjusted odds ratios and confidence intervals—physical health

OR = odds ratio
CI = confidence interval
Beginning with males, experiencing interpersonal conflict violence (Class II) was associated with two and a half times (OR=2.50; 95% CI 1.02, 6.10) greater odds of “poor” self-reported health but has no significant associations with either injury or illness disability. Effects for females are broader, with almost twice the likelihood of self-perceived poor health (OR=1.95; 95% CI 1.18, 3.23), injury disability (OR=1.85; 95% CI 1.36, 2.51), and having had a miscarriage (OR=1.55; 95% CI 1.27, 1.89).
Physical aggression has similar associations with physical health among males, showing increased odds of self-perceived “poor” health that are more than two times that of males not experiencing any IPV (OR=2.24; 95% CI 1.02, 4.92), but no greater odds of either injury or illness disability. Negative health associations are more pronounced among women. Here, women have elevated odds of both injury (OR=1.78; 95% CI 1.30, 2.45) and illness disability (OR=1.45; 95% CI 1.09, 1.94), as well as having had a miscarriage (OR=1.32; 95% CI 1.07, 1.63).
Men experiencing the systematic abuse form of IPV are more than two and a half times as likely to report an injury disability (OR=2.60; 95% CI 1.63, 4.17) and almost twice as likely to report an illness disability (OR=1.93; 95% CI 1.08, 3.45). Male victims of systematic abuse do not have elevated odds of self-perceived poor health. In contrast, women experiencing systematic abuse have almost two and a half times the increased odds of self-perceived poor health (OR=2.31; 95% CI 1.21, 4.40), more than three times the increased odds of an injury disability (OR=3.29; 95% CI 2.28, 4.76), and twice the likelihood of having a miscarriage (OR=2.04; 95% CI 1.54, 2.69).
Associations with mental health and substance use
Table 4 shows associations between the different types of IPV and the measures of mental health and substance use. Again, beginning with men, interpersonal conflict violence is associated with almost twice the odds of serious depression (OR=1.94; 95% CI 1.12, 3.36) and almost three times the odds of a mental health disability (OR=2.87; 95% CI 1.17, 7.04). Associations with substance use are more variable as the odds of using antidepressants are over three and a half times greater (OR=3.66; 95% CI 1.84, 7.29) and, albeit to a lesser extent, the odds of recreational drug use are also higher (OR=2.04; 95% CI 1.02, 4.09). For women, mental health sequelae of interpersonal conflict violence are somewhat similar. Here, women experiencing this form of IPV have twice the odds of serious depression (OR=2.09; 95% CI 1.64, 2.66) and mental health disability (OR=2.27; 95% CI 1.33, 3.88). Still, associations with substance use are slightly more varied with significantly elevated odds for the use of tranquilizers, sleeping pills, or sedatives (OR=2.16; 95% CI 1.53, 3.04), antidepressants (OR=1.97; 95% CI 1.39, 2.79), and recreational drugs (OR=2.78; 95% CI 1.52, 5.10).
Table 4.
Adjusted odds ratios and confidence intervals—mental health

OR = odds ratio
CI = confidence interval
When looking at the mental health sequelae of physical aggression, men interestingly have no significant associations. The odds of neither mental health nor substance use are significantly elevated among men experiencing this form of IPV. In contrast, women with similar experiences show a number of mental health detriments. Specifically, their odds are higher for serious depression (OR=1.82; 95% CI 1.41, 2.33) and are over two and a half times as great in terms of reporting a mental health disability (OR=2.66; 95% CI 1.60, 4.41). Their odds are also greater in terms of the use of tranquilizers, sleeping pills, or sedatives (OR=2.18; 95% CI 1.53, 3.11), antidepressants (OR=1.97; 95% CI 1.37, 2.83), prescription pain pills (OR=2.10; 95% CI 1.63, 2.72), and recreational drugs (OR=3.50; 95% CI 1.96, 6.23).
In general, associations between systematic abuse and mental health and substance use are both more extensive and stronger. For males, the odds of serious depression are almost two and a half times greater (OR=2.41; 95% CI 1.40, 4.16), while the odds of mental health disability are even greater (OR=2.87; 95% CI 1.14, 7.24). Associations with substance use are less consistent, with increased odds seen only for the use of antidepressants, although the effect is quite large (OR=4.32; 95% CI 2.07, 9.04). More negative health indicators are associated with systematic abuse among females, and in general the effects seem larger when compared to males. Here, women experiencing systematic abuse are almost three times as likely to report serious depression (OR=2.95; 95% CI 2.16, 4.04) and almost four times as likely to report a mental health disability (OR=3.77; 95% CI 2.06, 6.90). Moreover, women with such experiences are more than two and a half times as likely to use tranquilizers, sleeping pills, or sedatives (OR=2.65; 95% CI 1.67, 4.19), more than three times as likely to use anti-depressants (OR=3.20; 95% CI 2.08, 4.91), more than twice as likely to use prescription pain pills (OR=2.28; 95% CI 1.61, 3.24) and more than twice as likely to report drinking alcohol “everyday” (OR=2.83; 95% CI 1.24, 6.46), compared to females with no history of IPV.
Discussion
Consistent with prior research, we found extensive co-morbidity associated with IPV violence, including health problems, psychological distress, and substance abuse among both men and women.3 However, in several important respects our work extends what we know about IPV and the consequences of living with IPV.
First, our findings confirm that men are much less likely than women to have experienced IPV, but also show that men and women appear to experience IPV as a similar patterned phenomenon. For both sexes, the majority experience no violence; a subset experiences violence that is not multidimensional (interpersonal conflict violence); a smaller subset experiences violence that is multi-dimensional but is less likely to include violence requiring sustained activity, use of force, or other aspects of power-controlling aggression such as stalking and sexual assault (physical aggression); and a final subset experiences significant, severe, multifaceted violence, as well as other forms of power-controlling aggression (systematic abuse).
Such similarity across genders, however, masks some important differences. Within each class of violence, the prevalence of violence is lower among men. For example, while both groups experience interpersonal conflict violence, the prevalence of being pushed or shoved for males is only one-sixth (0.08 versus 0.48) that of females. Within this class of violence, women are more likely to be slapped, choked, or beaten up, and sexually assaulted. Men have a greater probability of having been kicked or being hit with or having an object thrown at them. A similar conclusion holds for both physical aggression and systematic abuse; even within classes of violence, women’s experiences are more extensive. These conclusions suggest that the gender differential in prevalence of discrete violent acts is greater with physical aggression and systematic abuse.
Equally important, the population prevalence of each pattern of violence is much greater for women than it is for men. While just over 3% of men experience interpersonal conflict violence, 11% of women experience this form of IPV. Likewise, the likelihood of physical aggression (8.2 % versus 3.3 %) and systematic abuse (3.5 % versus 1.6 %) among women is more than twice the probability for men. In general, this highlights important similarities in the way in which violence is patterned in interpersonal relationships, but also demonstrates the heightened exposure of women to such violence. Such differences have important implications for the health consequences of IPV.
This leads to our second conclusion: variations in exposure to, and the content of, different patterns of violence differentiate men and women with respect to their physical and mental health outcomes. Based on the total number of statistically significant associations between IPV and the health outcomes, women have greater odds than men of experiencing poor physical and mental health and drug use. Specifically, women showed higher odds of negative health outcomes in 26 cases, while men showed higher odds in only 11 cases. It is also reasonable to conclude that the gender disparity in health outcomes appears to be greater for physical aggression, but nonetheless exists for all types of IPV.
Explanations for this disparity warrant further investigation. In particular, we need to determine to what extent men’s experiences with this kind of violence are a product of victimization or victim precipitation. That is, is it the case that men who are experiencing physical aggression are the initiators of violence and, as a result, their self-reports of victimization are a product of their partners’ defensive reactions to their aggression? Being the primary aggressor in an act of IPV might explain why any associated violence they experience would likely have minimal physical and mental health consequences. We have some indirect evidence to support this in that the use of weapons and other objects in attacks, which may reflect efforts to balance sex differences in physical strength,26 are nearly as, or in some cases more, prevalent in physical aggression experiences among men than women.
Another potential explanation relates to the stigma males may feel in reporting such victimization experiences. Again, there is some interesting indirect evidence to support this contention. Specifically, males who report interpersonal conflict violence and systematic abuse have the largest number of health associations (six significant associations and five significant associations, respectively), and the majority of these are for mental health related outcomes. In contrast, the number of health associations among women is roughly equal across all three types of IPV, although the sizes of the associations are greatest for systematic abuse. Still, the evidence we offer is somewhat speculative and is contradicted by men’s willingness to relate their experiences with and health consequences of interpersonal conflict and systematic abuse.
As with any research, our analyses do have limitations. For example, critics have argued that the CTS and like measures do not provide information about the context of the situation and do not differentiate whether an action was done in self-defense or take into account the relative size and strength of each individual in the relationship.27,28 While the NVAWS uses items similar to the CTS without introducing them as “conflict tactics,” issues of context are still unanswerable and yet important. Another criticism is that the NVAWS includes only self-report information and does not allow for medical verification of the extent and seriousness of injuries or disabilities. As a result, our measures likely possess the same biases that haunt a wide number of prior studies.
However, despite these limitations, our findings have important implications for health research. Quite simply, we need to focus more attention on how we both conceptualize and measure interpersonal violence. We need to determine the extent to which there are gender differences in screening for IPV or gender stereotypes that prevent doctors from probing about the etiology of depressive episodes or substance abuse problems that may be directly linked to IPV. Women have been the primary beneficiaries of the expanded public concern about IPV, and in some respects our work suggests that this is well justified, given their greater exposure to all types of IPV. Nevertheless, our work also indicates that it is time we expand our understanding of the population at risk for this problem. While women may have greater exposure to IPV, and as a result, a greater range of health problems, the effects on men should not be ignored. Certainly our efforts to curb interpersonal violence will hinge on acknowledging not only gender differences, but also similarities.
Finally, it is important to consider implications for policy and practice. For over a decade now, there have been varied calls to enhance screening of interpersonal violence in clinical settings.29–31 The underlying logic is two-fold. First, screening for IPV can lead to the application of more immediate victim services and medical help. Second, if IPV can be identified early, both prevention and intervention efforts could be implemented to both prevent the genesis of more serious violence and offset some of the long-terms costs. Our findings highlight the importance of both sets of efforts. Screening would be clearly important to identify what types of IPV women and men are experiencing and hence provide a context for developing more sensitive and appropriate intervention efforts.
Beginning with the recognition that IPV has various forms and varied consequences is central to both understanding IPV as a public health problem and formulating appropriate responses. We hope our work provides a springboard for further work on prevention and intervention in violence among intimate relationships.
REFERENCES
- 1.Crowell NA, Burgess AW, editors. Understanding violence against women. Washington: National Academy Press; 1996. [Google Scholar]
- 2.Kruttschnitt C, McLaughlin BL, Petrie CV, editors. Advancing the federal research agenda on violence against women. Washington: National Research Council, National Academies Press; 2004. [Google Scholar]
- 3.Coker AL, Davis KE, Arias I, Desai S, Sanderson M, Brandt HM, Smith PH. Physical and mental health effects of intimate partner violence for men and women. Am J Prev Med. 2002;23:260–8. doi: 10.1016/s0749-3797(02)00514-7. [DOI] [PubMed] [Google Scholar]
- 4.Danielson KK, Moffitt TE, Caspi A, Silva PA. Comorbidity between abuse of an adult and DSM-III-R mental disorders: evidence from an epidemiological study. Am J Psychiatry. 1998;155:131–3. doi: 10.1176/ajp.155.1.131. [DOI] [PMC free article] [PubMed] [Google Scholar]
- 5.Moffitt TE, Caspi A. Findings about partner violence from the Dunedin multidisciplinary health and development study. Research in brief. Washington: National Institute of Justice, U.S. Department of Justice; 1999. [Google Scholar]
- 6.Hathaway JE, Mucci LA, Silverman JG, Brooks DR, Mathews R, Pavlos CA. Health status and health care use of Massachusetts women reporting partner abuse. Am J Prev Med. 2000;19:302–7. doi: 10.1016/s0749-3797(00)00236-1. [DOI] [PubMed] [Google Scholar]
- 7.Lemon SC, Verhoek-Oftedahl W, Donnelly EF. Preventive healthcare use, smoking, and alcohol use among Rhode Island women experiencing intimate partner violence. J Womens Health Gend Based Med. 2002;11:555–62. doi: 10.1089/152460902760277912. [DOI] [PubMed] [Google Scholar]
- 8.Tjaden P, Thoennes N. Full report of the prevalence, incidence, and consequences of violence against women: findings from the National Violence Against Women Survey. Washington: Department of Justice (US), Office of Justice Programs, National Institute of Justice; 2000. (Report No. NCJ 183781. [Google Scholar]
- 9.Straus M. Measuring intrafamily conflict and violence: the conflict tactics (CT) scales. J Marriage Fam. 1979;41:75–88. [Google Scholar]
- 10.Ross C, Wu C. The links between education and health. Am Sociol Rev. 1995;60:719–45. [Google Scholar]
- 11.Browne A, Salomon A, Bassuk SS. The impact of recent partner violence on poor women’s capacity to maintain work. Violence Against Women. 1999;5:393–426. [Google Scholar]
- 12.Sutherland CA, Sullivan CM, Bybee D. Effects of intimate partner violence versus poverty on women’s health. Violence Against Women. 2001;7:1122–43. [Google Scholar]
- 13.Ware JE, Gandek B IQOLA Project Group. The SF-36® Health Survey: development and use in mental health research and the IQOLA Project. Int J Ment Health. 1994;23:49–73. [Google Scholar]
- 14.Beck AT, Beck RW. Screening depressed patients in family practice. A rapid technique. Postgrad Med. 1972;52:81–8. doi: 10.1080/00325481.1972.11713319. [DOI] [PubMed] [Google Scholar]
- 15.Tjaden P, Thoennes N. Violence and threats against women and men in the United States, 1994–1996. [Computer file]. ICPSR version. Denver: Center for Policy Research; 1998. [Google Scholar]
- 16.Phoenix: Risk and Needs Assessment, Inc. Domestic violence inventory. Risk and needs assessment. 1996. [cited 2006 Feb 27]. Available from: URL: http://www.riskandneeds.com.
- 17.Johnson MP. Patriarchal terrorism and common couple violence: two forms of violence against women. J Marriage Fam. 1995;57:283–94. [Google Scholar]
- 18.Johnson MP, Leone JM. The differential effects of intimate terrorism and situational couple violence: findings from the National Violence Against Women Survey. J Fam Issues. 2005;26:322–49. [Google Scholar]
- 19.Goodman L. The analysis of systems of qualitative variables when some of the variables are unobservable. Part I – a modified latent structure approach. AJS. 1974;79:1179–259. [Google Scholar]
- 20.Clogg C, Goodman L. Latent structure analysis of a set of multidimensional contingency tables. J Am Stat Assoc. 1984;79:762–71. [Google Scholar]
- 21.Long JS. Regression models for categorical and limited dependent variables. Thousand Oaks (CA): Sage Publicatons; 1997. [Google Scholar]
- 22.Raftery A. Bayesian model selection in social research. Sociol Methodol. 1995;25:111–63. [Google Scholar]
- 23.Clogg C. Latent class models. In: Arminger G, Clogg CC, Sobel ME, editors. Handbook of statistical modeling for the social and behavioral sciences. New York: Plenum Press; 1995. [Google Scholar]
- 24.McCutcheon AL. Latent class analysis. Newbury Park (CA): Sage Publications; 1987. [Google Scholar]
- 25.Macmillan R, Gartner R. When she brings home the bacon: labor-force participation and the risk of spousal violence against women. J Marriage Fam. 1999;61:947–58. [Google Scholar]
- 26.Wilson MI, Daly M. Who kills whom in spouse killings? On the exceptional sex ratio of spousal homicides in the United States. Criminology. 1992;30:189–215. [Google Scholar]
- 27.Smith PH, Tessaro I, Earp JAL. Women’s experiences with battering: a conceptualization from qualitative research. Women’s Health Issues. 1995;5:173–82. doi: 10.1016/1049-3867(95)00615-X. [DOI] [PubMed] [Google Scholar]
- 28.Kurz D. Old problems and new directions in the study of violence against women. In: Bergen RK, editor. Issues in intimate violence. Thousand Oaks (CA): Sage Publications; 1998. [Google Scholar]
- 29.Emergency medicine and domestic violence. American College of Emergency Physicians. Ann Emerg Med. 1995;25:442–3. [PubMed] [Google Scholar]
- 30.American Medical Association diagnostic and treatment guidelines on domestic violence. Arch Fam Med. 1992;1:39–47. doi: 10.1001/archfami.1.1.39. [DOI] [PubMed] [Google Scholar]
- 31.Family violence: an AAFP white paper. The AAFP Commission on Special Issues and Clinical Interests. Am Fam Physician. 1994;50:1636–46. [PubMed] [Google Scholar]