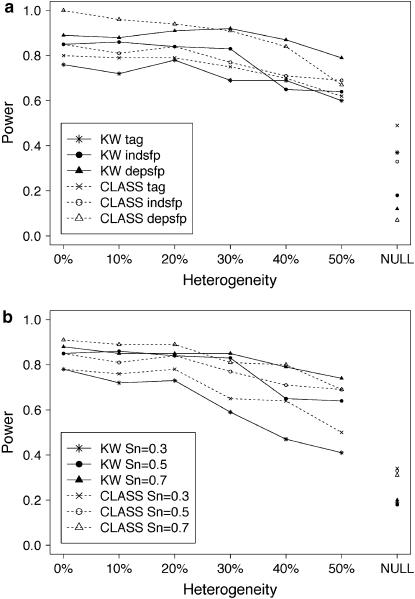
Figure 3.
Power conditioned on the heterogeneity parameter p for minor allele frequency in the 10–15% range and Y = 10. (NULL indicates the false-positive rate.) (a) Power shown for Kruskal–Wallis (KW) and CLASS methods on tag SNPs, independent SFPs, and dependent SFPs. (b) Power shown for KW and CLASS with varying sensitivity (Sn) on independent SFPs.

