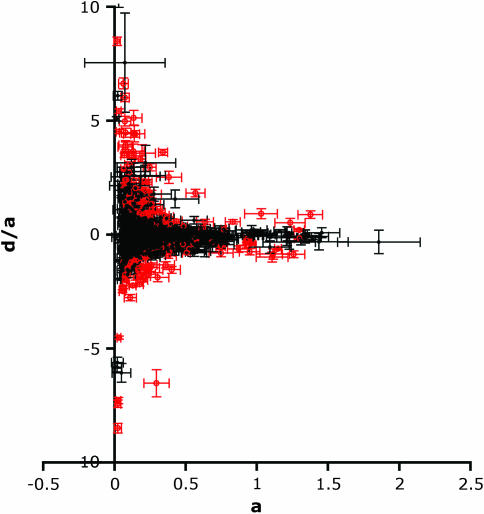
Figure 3.—
Values of d/a vs. a. Five points are not shown to retain reasonable detail in the graph. These points are, for cross 33 × 83, a, d/a pairs, 0.002, 154; 0.002, 86.8; 0.014, 42.4; 0.004, 40.3; and for cross 33 × 483 a, d/a pairs, 0.012, 22.7. Red symbols indicate transcripts for which d was significantly different from 0; black symbols indicate transcripts for which d was not significant. Horizontal bars show standard errors for a; vertical bars show standard error for d/a (calculated by propagating of error). Note the different scales for a and d/a.

