Abstract
A second-generation linkage map was constructed for the silkworm, Bombyx mori, focusing on mapping Bombyx sequences appearing in public nucleotide databases and bacterial artificial chromosome (BAC) contigs. A total of 874 BAC contigs containing 5067 clones (22% of the library) were constructed by PCR-based screening with sequence-tagged sites (STSs) derived from whole-genome shotgun (WGS) sequences. A total of 523 BAC contigs, including 342 independent genes registered in public databases and 85 expressed sequence tags (ESTs), were placed onto the linkage map. We found significant synteny and conserved gene order between B. mori and a nymphalid butterfly, Heliconius melpomene, in four linkage groups (LGs), strongly suggesting that using B. mori as a reference for comparative genomics in Lepidotera is highly feasible.
BOMBYX mori, the domesticated silkworm, is one of the most genetically well-studied insects, with 246 mutations that have been sorted into 27 linkage groups (LGs) (Banno et al. 2005). Genome projects and related work are underway using B. mori as a model organism for Lepidoptera, the most serious group of agricultural pests (for recent review, see Goldsmith et al. 2004). Large-scale sequencing projects of expressed sequence tags (ESTs) (Mita et al. 2003; Cheng et al. 2004) and whole-genome shotgun (WGS) sequences (Mita et al. 2004; Xia et al. 2004) have been performed, and our knowledge of silkworm genes and genome sequence has dramatically increased. However, basic genome research on this insect is still far behind compared with other model organisms such as Drosophila melanogaster, and assignment of fundamental information such as genome sequences, ESTs, BAC contigs, mutant phenotypes, and chromosomal locations on detailed linkage maps is an urgent priority.
Two preliminary molecular linkage maps were first published for B. mori in 1995. One was based on RAPDs (Promboon et al. 1995), and the other on RFLPs using cDNA probes (Shi et al. 1995). In 1998, we constructed a dense linkage map mainly based on RAPD markers consisting of 28 LGs corresponding to the 28 chromosomes of B. mori (Yasukochi 1998). Twenty-six of the 28 LGs of the RAPD map have now been assigned to the classical LGs: the remaining LGs, P and U, were recently found to be unassigned to the classical LGs because morphological markers with similar phenotypes had been confounded (Yasukochi et al. 2005). An AFLP map was published in 2001 (Tan et al. 2001), and recently, two additional maps based on simple sequence repeats (SSRs) (Miao et al. 2005; Prasad et al. 2005), as well as an independent RFLP map based on cDNA probes (Nguu et al. 2005), were reported.
In a large-scale linkage analysis, PCR-based markers like RAPDs, AFLPs, and SSRs greatly decrease the disadvantages of low yield of progeny DNA due to the relatively small body size of B. mori. However, since these markers are usually highly strain specific, it is difficult to compare results on the basis of different parental strains. Moreover, such anonymous markers are poor in biological information by themselves. Therefore, PCR-based markers that can be widely utilized for a variety of strains and are based on identified genes or sequences have been critically needed.
Cleaved amplified polymorphic sequence markers have been used to localize a number of conserved genes in a largely SSR-based map (Miao et al. 2005); while universally applicable, this procedure requires several steps to establish conditions for revealing polymorphism among different strains. We showed that codominant and conserved markers could be established by conformation-sensitive gel electrophoresis of PCR products amplified from single-copy genes and unique genome sequences differing at the nucleotide level without the need for additional manipulation (Yasukochi 1999).
A bacterial artificial chromosome (BAC)-based approach for integration of genome information has a definite advantage for facilitating further functional analysis. Recently, a detailed linkage map including 190 BACs was reported for the red flour beetle, Tribolium castaneum (Lorenzen et al. 2005). We have constructed two BAC libraries for B. mori and developed a PCR-based screening system for identifying known genes on individual clones as sequence-tagged sites (STSs) (Wu et al. 1999). Using this screening system, we used BAC clones carrying mapped genetic markers as probes for fluorescence in situ hybridization (BAC–FISH) analysis, which enabled us to recognize each chromosome of B. mori directly (Yoshido et al. 2005).
It is not yet feasible to carry out large-scale genome projects like EST and WGS sequencing in many species. If the genome structure is well conserved among Lepidoptera, the genome information from B. mori can be effectively used for analysis of other lepidopteran species, including serious pests. However, little is known about the extent of synteny that exists between lepidopteran species due to a shortage of mapping information for lepidopteran species except B. mori.
In this report, we describe the construction of BAC contigs by the use of WGS sequences, which include most of the known genes of B. mori appearing in public databases. Additionally, a comparison of our mapping of a set of conserved genes recently reported in a nymphalid butterfly, Heliconius melpomene (Jiggins et al. 2005), provides the first strong evidence of synteny between relatively distantly related Lepidoptera.
MATERIALS AND METHODS
Establishment of sequence-tagged sites:
Sequences of silkworm genes and ESTs were obtained from the DNA databank of Japan nucleotide sequence databases (http://srs.ddbj.nig.ac.jp/index-j.html) and Silkbase (Mita et al. 2003; http://papilio.ab.a.u-tokyo.ac.jp/silkbase/index.html). The sequences were sorted into WGS sequence contigs, “Ramen assembled contigs” (Mita et al. 2004), and “WGS contig sequences of the Southwest Agricultural University” (Xia et al. 2004) in KAIKO BLAST (http://kaikoblast.dna.affrc.go.jp/) by similarity search. Genomic sequences containing putative single-copy genes and ESTs were obtained from KAIKO BLAST, and primers were designed with the program Oligo version 4.0 (National Biosciences, Plymouth, MA). The resultant PCR products were screened for polymorphisms using heteroduplex formation as described previously (Yasukochi 1999).
Isolation of BAC clones with STS and RAPD markers:
The BAC library used in these experiments was reported previously (Wu et al. 1999). STS primer pairs described above and RAPD markers in the previous work (Yasukochi 1998) were used for PCR-based screening of the library. Isolation of BACs was performed in a two-step screening method described previously (Yasukochi 2002). For STS landmarks, the PCR amplification was carried out with a 3-min denaturation at 94°, followed by 45 cycles with a 1-min denaturation at 94°, 2-min annealing at 55°, and 3-min elongation at 72°, ending with a 5-min final extension at 72°. RAPD markers were assayed by a 3-min denaturation at 94°, followed by 45 cycles with a 1-min denaturation at 94°, 2-min annealing at 36°, and 3-min elongation at 72°, ending with a 5-min final extension at 72°. Eight microliters of the reaction was loaded on a binary gel [a mixture of 0.7% agarose (Takara, Kyoto) and 0.7% Synergel (Diversified Biotech, Boston) in 0.5× TBE buffer] and separated by electrophoresis for 80–100 min in an ice-cold chamber. Gels were stained with ethidium bromide and photographed under UV light with a CCD-imaging processor (ATTO, Tokyo). BAC–DNA was prepared from the positive clones with an automatic plasmid isolator (Kurabo PI 50) and amplified with primers used for initial identification to confirm the presence of the expected markers.
Establishment of BAC-based STSs:
BAC–DNA of clones to be mapped was digested with the restriction enzymes AluI or HindIII and subcloned into pUC vectors. Randomly selected BAC subclones were sequenced with ABI-377 or ABI-3700 automatic sequencers, and the sequences obtained were used for similarity search and primer design in the same manner as described above.
Linkage analysis and map construction:
Genomic DNAs used for linkage analysis here were identical to that used in the previous work (Promboon et al. 1995; Yasukochi 1998, 1999). The PCR amplification for linkage analysis was carried out in the same conditions as used for isolation of BAC clones. The completed reaction was denatured at 95° for 5 min and annealed at 55° for 15 min to promote heteroduplex formation. When heteroduplex bands could not be well resolved by the binary gel described above, the reaction was loaded on a 55-mm binary gel [a mixture of 0.75% Metaphor agarose (Cambrex, Rockland, ME), 0.25% Takara L03 agarose (Takara), and 1.0% Synergel (Diversified Biotech) in 0.5× TBE containing 1 m urea or 0.67× MDE gel (Cambrex) in 0.5× TBE].
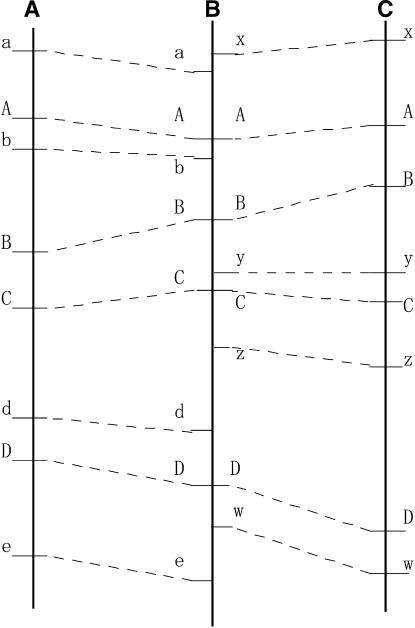
The data obtained for codominant, C108-dominant, and p50-dominant markers were separately processed with the program MAPMAKER/Exp version 3.0 (Lander et al. 1987) in the same manner as described previously (Yasukochi 1998), and the three types of data were integrated as shown in Figure 1.
Figure 1.—
Schematic of linkage map construction for autosomes. The linkage map shown in Figure 2 is represented by B, which is constructed from genetic distances among codominant markers (capital letters) calculated from two types of F2 individuals (for detailed explanation, see Yasukochi 1998). A and C represent genetic distances among C108-dominant and codominant markers calculated from F2 individuals harboring p50-derived nonrecombinant chromosomes and genetic distances among p50-dominant and codominant markers calculated from F2 individuals harboring C108-derived nonrecombinant chromosomes, respectively. Dominant markers (small letters) located between two codominant markers were added at map positions determined by dividing the genetic distances between neighboring codominant markers in B (the integrated map) in proportion to genetic distances between the dominant marker and the neighboring codominant markers in A (C108 reference map) or in C (p50 reference map). Dominant markers located distally to codominant markers were added at genetic distances calculated between the dominant marker and the nearest codominant marker.
Fluorescence in situ hybridization of BAC clones:
Chromosomes were prepared from p50 females according to the methods previously described (Sahara et al. 1999; Yasukochi et al 2004). The BAC–FISH analysis involving BAC–DNA extraction, probe labeling, hybridization, washing, and digital image acquisition and processing was carried out according to Sahara et al. (2003) and Yoshido et al. (2005). FISH images taken with a Photometrics CoolSNAP CCD camera attached to a Leica HC fluorescence microscope and processed by Adobe Photoshop version 7.0 were routinely given false colors—red for Cy3, green for fluorescein, and light blue for DAPI images.
RESULTS AND DISCUSSION
Design of STS primer pairs based on known genes and ESTs:
For selection of STS candidates, we gave preference to genes published in public nucleotide databases, since it was expected that functional analyses had been carried out with them. We performed BLASTN searches of known genes to obtain flanking genome sequences, to estimate copy numbers of genes, and to avoid designing duplicate STSs for the same gene having multiple accession numbers (supplemental Table 1 at http://www.genetics.org/supplemental/). Nucleotide sequences of B. mori, excluding ESTs and repeated sequences appearing in public databases, were used as queries for BLASTN searches against WGS genome sequences (Mita et al. 2004; Xia et al. 2004) using Kaikoblast (http://kaikoblast.dna.affrc.go.jp/).
WGS sequences containing single-copy genes were then used to design STS primer pairs, and the primers were used for PCR screening of a BAC library of strain p50 containing 23,027 clones (5.8 genome equivalents). BLASTN searches were also performed for ESTs obtained from a B. mori EST database, Silkbase (http://papilio.ab.a.u-tokyo.ac.jp/silkbase/index.html), and STSs were designed for randomly selected single-copy ESTs, which were not identical to or neighboring known genes. As a result, STSs were established for 472 independent gene sequences and 132 ESTs (supplemental Table 2 at http://www.genetics.org/supplemental/).
Isolation of BAC clones with RAPD markers:
We have previously reported mapping 1010 RAPD markers for B. mori (Yasukochi 1998). A number of these were used for PCR screening of the BAC library to confirm the localization of the isolated BAC clones on the assigned chromosomal positions by FISH analysis (Yoshido et al. 2005). To increase the number of anchors between the genetic and physical maps, the remaining RAPD markers positive for strain p50 were used to screen BAC clones by PCR in the same manner as STS landmarks, resulting in the isolation of positive BAC clones with a total of 387 markers.
Since the sensitivity and reliability of RAPD markers in PCR screening might be lower than that of specific STS primers, specific primer pairs were designed from WGS genome sequences that incorporated sequences of the isolated BACs. The STS primers were used for the identification of novel and false-negative clones from the first screening using RAPDs. Some of the primers generated polymorphic PCR products between the two parental strains and were utilized for linkage analysis to confirm map positions.
As a result, BAC contigs containing 288 RAPD markers were localized on the linkage map (supplemental Table 3 at http://www.genetics.org/supplemental/). These included 17 cases in which STS primers were monomorphic but the same clone was found to be positive for multiple closely linked RAPD markers (supplemental Table 3 at http://www.genetics.org/supplemental/). In all, we found that 271 of 288 (94.0%) RAPD markers in BAC contigs were localized in expected map positions. Unlike other PCR-based anonymous markers, RAPDs can be used for direct isolation of clones without additional sequencing effort. High reliability of RAPD–PCR screening of BAC libraries shows that it is a powerful tool especially for species with little sequence information.
Construction of BAC contigs:
BAC clones isolated by PCR screening were incorporated into contigs on the basis of the presence of common amplicons. In addition, to maximize the coverage of BAC contigs, we established novel STSs from sequences of BAC clones not yet assigned to any BAC contigs. In all, we constructed 874 contigs harboring 5067 clones (22% of the library). Considering false-negative clones in PCR screening, the coverage of contigs is presumably higher than this estimate. The number of BAC clones per contig ranged from 1 to 91 and averaged 5.7.
Map construction:
We previously reported a linkage map of B. mori composed of 1010 RAPDs and eight known genes (Yasukochi 1998). New polymorphic STS landmarks were designed in this experiment and integrated into the linkage map using the same F2 population. Since genetic recombination does not occur in lepidopteran oogenesis, no F2 individual can be homozygous for both maternal and paternal dominant markers on the same autosome, which makes it impossible to calculate the genetic distance between maternal and paternal dominant markers on autosomes. Therefore, it was necessary to calculate three measures of genetic distance separately and use codominant markers to integrate them into a single value (Figure 1). We did this using a relative measure of distances between codominant and dominant markers obtained on the reference map derived from each parental strain.
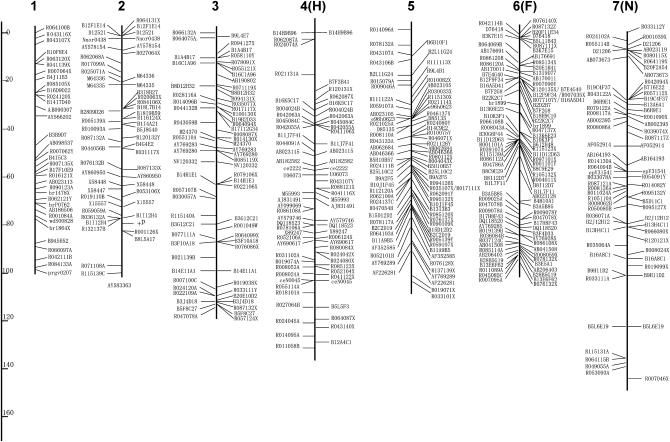
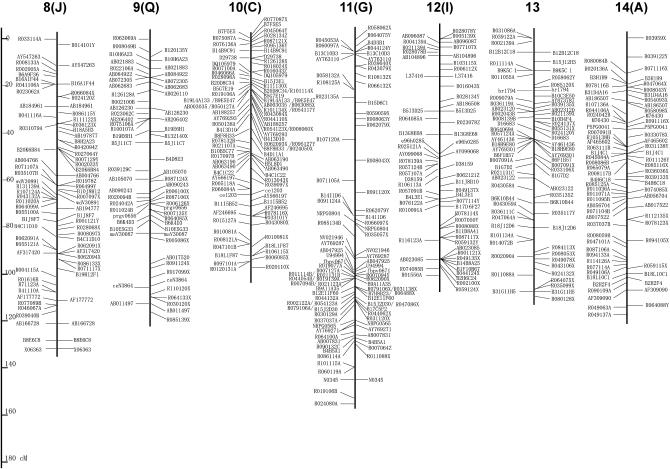
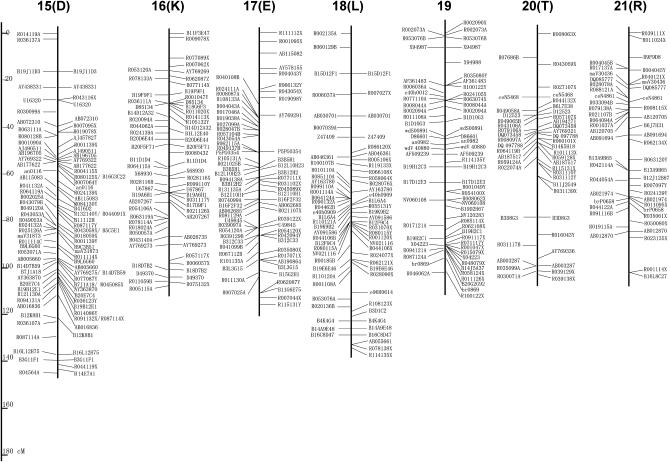
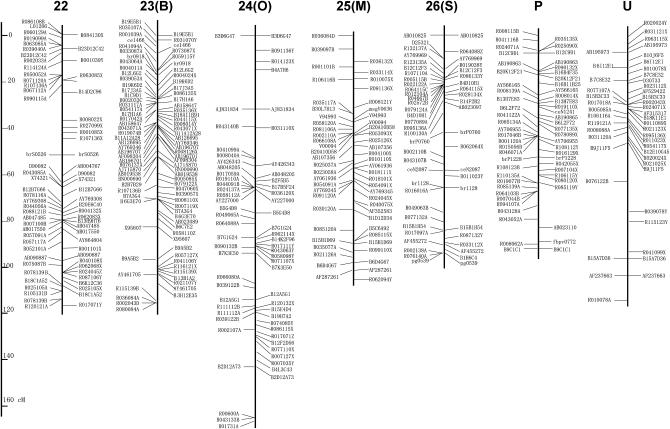
Figure 2 shows the linkage map newly constructed in this report. Since STSs on the map are based on published WGS sequences, primer sequences can be modified even if the original STS does not generate polymorphic products between different combinations of parental strains. The genetic distance of each LG ranges from 92.0 to 165.9 cM, and the total length is 3229.4 cM (Table 1). This is ∼1.5 times as large as the former version (Yasukochi 1998) and similar to ∼3432 cM of a recently published map of microsatellite markers (Miao et al. 2005).
Figure 2.—
A linkage map for B. mori. Capital letters in parentheses indicate former designations for LGs in Yasukochi (1998). Markers listed on the left or right of the bars represent C108-dominant markers and p50-dominant markers, respectively. Codominant markers are listed on both sides of the bars. Detailed information about RAPD markers (named with the first letter R) can be obtained from Bombmap (http://sgp.dna.affrc.go.jp/bombmap/index.html).
TABLE 1.
Summary of genetic and physical mapping for each linkage group
| Genetic distance (cM) | Relative physical sizea | No. of:
|
Coverage (%)b | ||||
|---|---|---|---|---|---|---|---|
| LG | BAC contigs | Known genes | ESTs | Isolated BACs | |||
| 1(Z) | 98.4 | 1.162 | 23 | 9 | 11 | 113 | 18.1 |
| 2 | 100.3 | 0.582 | 14 | 10 | 3 | 115 | 21.9 |
| 3 | 114.1 | 0.877 | 18 | 8 | 1 | 140 | 18.3 |
| 4 | 131.1 | 1.073 | 17 | 14 | 2 | 139 | 15.0 |
| 5 | 105.8 | 1.108 | 19 | 15 | 2 | 174 | 19.2 |
| 6 | 96.1 | 0.941 | 24 | 21 | 4 | 363 | 47.3 |
| 7 | 144.1 | 0.712 | 17 | 12 | 2 | 110 | 16.3 |
| 8 | 131.8 | 0.980 | 21 | 13 | 1 | 130 | 15.1 |
| 9 | 110.4 | 1.002 | 19 | 14 | 4 | 113 | 14.7 |
| 10 | 98.5 | 0.946 | 28 | 20 | 3 | 219 | 25.3 |
| 11 | 160.2 | 2.008 | 23 | 16 | 6 | 197 | 13.1 |
| 12 | 100.8 | 0.900 | 15 | 12 | 2 | 129 | 14.9 |
| 13 | 110.0 | 0.921 | 23 | 11 | 1 | 150 | 18.3 |
| 14 | 116.2 | 0.856 | 15 | 8 | 1 | 105 | 16.4 |
| 15 | 143.1 | 1.291 | 30 | 25 | 7 | 224 | 21.1 |
| 16 | 107.5 | 0.988 | 20 | 10 | 0 | 102 | 12.9 |
| 17 | 115.5 | 1.130 | 17 | 10 | 3 | 106 | 12.5 |
| 18 | 134.2 | 0.935 | 20 | 8 | 6 | 107 | 14.8 |
| 19 | 102.3 | 0.799 | 19 | 9 | 8 | 109 | 13.9 |
| 20 | 102.7 | 0.759 | 12 | 15 | 1 | 73 | 9.5 |
| 21 | 105.8 | 0.949 | 11 | 9 | 4 | 92 | 12.7 |
| 22 | 117.2 | 1.010 | 16 | 15 | 1 | 93 | 10.8 |
| 23 | 115.5 | 1.165 | 27 | 19 | 2 | 156 | 16.3 |
| 24 | 165.9 | 1.857 | 18 | 5 | 1 | 104 | 8.0 |
| 25 | 107.0 | 1.010 | 17 | 11 | 1 | 104 | 12.7 |
| 26 | 93.7 | 0.724 | 15 | 6 | 4 | 75 | 12.5 |
| P | 92.0 | 0.567 | 14 | 8 | 4 | 74 | 13.9 |
| U | 108.8 | 0.748 | 12 | 9 | 0 | 82 | 15.6 |
| Total | 3229.0 | 524 | 342 | 85 | 3698 | 16.06 | |
| Unmapped | 352 | 139 | 62 | 1356 | 5.89 | ||
The average relative size of all chromosomes is defined as 1, calculated from 12 karyotyped cells (Yoshido et al. 2005).
c = n × 28 × p/23027 (autosomes); c = n × 28 × p/23027/0.75 (Z chromosome). c, coverage; n, number of isolated BACs; p, relative physical size.
A total of 523 BAC contigs (16.1% of the library), which carried 342 independent characterized genes and 85 ESTs, were positioned on the linkage map by one or more polymorphic markers (Table 1 and supplemental Table 3 at http://www.genetics.org/supplemental/). In addition, three genes (AB012870, AY461705, and X06363) and two ESTs (ce–1466 and maV30436) were mapped but not included in contigs (supplemental Tables 1 and 2 at http://www.genetics.org/supplemental/). In all, we localized 345 known genes and 87 ESTs to this map.
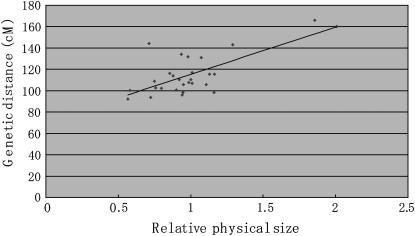
We previously estimated the physical length of each chromosome by BAC–FISH analysis (Yoshido et al. 2005). This enabled us to analyze the correlation between genetic and physical sizes of each linkage group (Figure 3). In general, physical size was positively correlated with genetic distance (r = 0.718), and recombination rates tended to be higher in relatively small chromosomes (Figure 3), presumably because there is a relatively constant number of crossovers per chromosome (Hunt and Page 1995).
Figure 3.—
Correlation of genetic and physical lengths of each chromosome. The average relative size of all chromosomes is defined as 1.
Coverage of BAC contigs:
Coverage of BAC contigs in each LG was estimated on the basis of the assumption that the density of BAC clones was constant for all chromosomes (Table 1). Coverage in LG6 is the highest, 47.3%, since chromosome walking has been performed in the region around the homeobox genes (Yasukochi et al. 2004). LGs 2, 5, 10, and 15 are relatively well covered with BAC contigs, since there are many RAPD markers and known genes on them.
The chromosome corresponding to LG24 is the second largest chromosome, which also harbors the largest autosomal heterochromatic region (Yoshido et al. 2005). Genes and ESTs mapped onto LG24 are localized in a limited region (supplemental Table 3 at http://www.genetics.org/supplemental/, contigs 24_2–24_7). It is difficult to perform PCR-based screening in heterochromatin due to a lower guanine–cytosine pair content and accumulation of repetitive sequences. Therefore, we suppose that the low gene density and BAC coverage in LG24 may be an artifact caused by its heterochromatin-rich chromosomal structure.
Synteny and conserved gene order between B. mori and H. melpomene:
Recently, a linkage map was reported in a butterfly, H. melpomene, including 19 anchor loci of unique and conserved genes (Jiggins et al. 2005). Since H. melpomene, a nymphalid, is not closely related to B. mori, a bombycid, it provides a good case to determine the extent of synteny among lepidopteran species. Fourteen Bombyx orthologs of 19 Heliconius anchor loci were found in public databases according to the definitions of submitters. We mapped 9 of them and found that the genes for ribosomal protein L3 (RpL3) and dopa decarboxylase colocalized in LG4 of B. mori, consistent with the linkage of these two genes in LG1 of H. melpomene (Table 2).
TABLE 2.
Anchor loci used for comparison between B. mori and H. melpomene
|
B. mori
|
H. melpomene
|
||||
|---|---|---|---|---|---|
| Anchor loci | Accession no. | LG | Map position | LG | Map position |
| apterous | AB024903 | 1(Z) | 17.4 | Z | Unknown |
| Triosephosphate | AY734490 | 1(Z) | Unknown | Z | 87.7 |
| Isomerase | |||||
| Ribosomal | AY769280 | 3 | 48.7 | 5 | 71.1 |
| Protein L11 | |||||
| Ribosomal | AB024901 | 4 | 78 | 1 | 57.2 |
| Protein L3 | |||||
| Dopa | AF372836 | 4 | 84.7 | 1 | Unknown |
| Decarboxylase | |||||
| Ribosomal | AY769289 | 5 | 89.5 | 10 | 0 |
| Protein L19 | |||||
| Elongation | D13338 | 5 | Unknown | 10 | 42.7 |
| factor 1 α | |||||
| patched | AADK01000387 | 5 | 37.5 | 10 | 45.4 |
| decapentaplegic | BAAB01102755 | 12 | 53.6 | 19 | 24.2 |
| Ribosomal | AJ457827 | 15 | 48.4 | 11 | 18.4 |
| Protein P0 | |||||
| Ribosomal | AY769279 | 15 | 52.8 | 11 | Unknown |
| Protein L10A | |||||
| Ribosomal | AY769322 | 15 | 55.1 | 11 | 32.1 |
| Protein S8 | |||||
| Bomopsin1 | AB047924 | 15 | Unknown | 11 | 48.1 |
| Ribosomal | AY769319 | 15 | Unknown | 11 | 53.8 |
| Protein S5 | |||||
| Ribosomal | AY769272 | 15 | Unknown | 11 | 65 |
| Protein L5 | |||||
| Cubitus interruptus | AF529422 | U | 27.5 | 18 | 53.6 |
Moreover, on the basis of synteny with H. melpomene, we speculated that the genes triosephosphate isomerase (Tpi), elongation factor 1α subunit (EF-1α), RpS5, and RpL5, which were unmapped in B. mori, were included in LG1, -5, and -15, respectively (Table 2). BAC–FISH is a high-throughput technology that determines the organization of genes directly on chromosomes, even with monomorphic loci. Therefore, we carried out BAC–FISH analysis to confirm synteny and to test the order of the anchor loci mapped in these three LGs in H. melpomene.
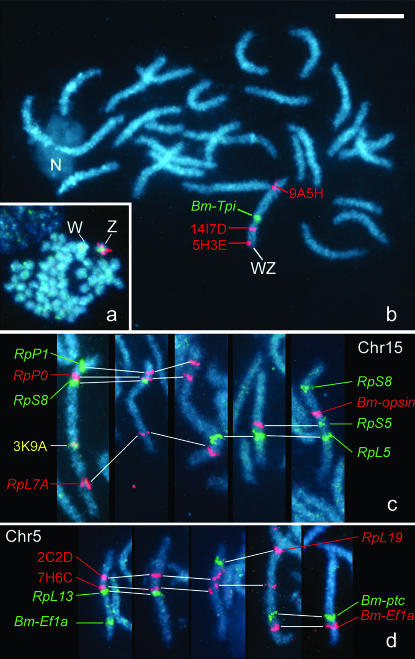
Two Z-linked genes, Tpi and apterous, were reported in H. melpomene (Jiggins et al. 2005). Using BAC–FISH, the sex (Z) linkage of the Tpi gene was confirmed by the colocalization of a Tpi-containing BAC probe with three known Z-BACs on the Z chromosome of a female mitotic complement (2n = 54 + WZ, Figure 4a). The Tpi-containing BAC appeared to be located between the signals of 14I7D (contig 01_7) and 9A5H (contig 01_21) in the WZ pachytene bivalent (Figure 4b). Since the Bombyx ortholog of the apterous gene was also mapped in LG1(Z) of B. mori, synteny was observed in these two genes (Table 2)
Figure 4.—
Localization of genes of interest by BAC–FISH mapping. (a and b) A 6C1E BAC covering Bm-Tpi (green signal) was colocalized with three Z-BACs (9A5H, 14I7D, and 5H3E; red signals) (a) on the Z chromosome in a female mitotic complement and (b) mapped on the Z chromatid between 9A5H and 14I7D in a female pachytene complement. (c) Five independent BAC–FISH preparations with 18B2A (RpP1), 10D5C (RpP0), 15I9C (RpS8), 18D1A (Bm-opsin), 20A1F (RpS5), 8L11B (RpL5), and 10A11H (RpL7A) probes defining the representative gene order on the chromosome corresponding to LG15 (Chr 15). The yellow signal was produced with a mixture of BAC probes, 3K9A (a Chr 15 marker) labeled with Cy-3 and fluorescein. (d) The order of genes, RpL19 (9C1F), RpL13 (5D7C), Bm-EF1α(11K9B), and patched (5C10F), on the chromosome corresponding to LG5 (Chr 5) was confirmed by three BAC–FISH mapping experiments with two red-labeled BAC probes (2C2D and 7H6C).
Three additional anchor loci, RpP0, RpS8, and opsin genes (Table 2), known to be linked in H. melpomene (Jiggins et al. 2005), were also observed to be localized on a single LG in B. mori. Therefore, we tried to confirm whether the gene order for RpP0, RpS8, opsin, RpS5, and RpL5 in LG11 of H. melpomene was conserved in LG15 of B. mori. The RpS5 and RpL5 genes were unmapped in B. mori and the Bomopsin1(Boceropsin) gene was not precisely mapped due to irreproducible segregation data. Thus, we carried out a BAC–FISH analysis using seven clones involving the RpP1, RpP0, RpS8, Bm-opsin1, RpS5, RpL5, and RpL7A genes, respectively. The gene order from the proximal side was exactly the same with no inconsistency with that of H. melpomene (Figure 4c).
Other candidate loci to confirm synteny were the RpL19, EF-1α, and patched (ptc) genes in LG10 of H. melpomene. Since the Bombyx ortholog of the ptc gene had not been reported, we performed a TBLASTN search in Kaikoblast using the deduced amino acid sequence of the ptc gene of H. melpomene as a query and found a genome sequence (AADK01000387) containing a putative ortholog (e-value 9e-58; bit score 223). The RpL19 and putative ptc genes were found to be localized in LG5 of B. mori (Table 2). The colocalization of the RpL19 and EF-1α in LG5 was also confirmed by BAC–FISH analysis, although there was a difference in the relative location of the ptc and EF-1α genes between the two lepidopterans (Figure 4d).
As described above, all 13 conserved genes in the four LGs of H. melpomene available for a test of synteny were found to be colocalized in the same LGs in B. mori. Moreover, the gene order in LG10 and -11 of H. melpomene was conserved in LG5 and -15 of B. mori, respectively, providing the first clear evidence for synteny and extensive conservation of chromosome organization between these two relatively distantly related lepidopteran species. If synteny and conserved gene order are universally found among Lepidoptera, comparative genomics will greatly diminish difficulties in genetical analysis of less well-characterized species. We showed the utility of BAC–FISH for determining the gene order. Since a number of BAC libraries have been constructed from other lepidopteran species (http://www.genome.gov/10001852), detailed comparison with B. mori is now feasible.
Whether synteny exists between B. mori and non-lepidopteran insects is an intriguing question. There are several coincidences between the genetic maps of B. mori and T. castaneum. For instance, the engrailed and even-skipped genes are colocalized in LG2 of B. mori and in LG7 of T. castaneum (Lorenzen et al. 2005). BAC-end sequences of clones 1D10 and 16F03, which include the RpS24 and RpS29 genes, were mapped onto LG7 of T. castaneum (Lorenzen et al. 2005) and we mapped these genes onto the same LG (LG25) of B. mori.
However, chromosome organization is quite different between B. mori and T. castaneum (n = 28 in B. mori and n = 10 in T. castaneum) and correspondence between conserved chromosomal regions is expected to be more complex than comparisons within Lepidoptera. A comparison between B. mori and D. melanogaster is more difficult in spite of the detailed information of the Drosophila genome due to its extremely long chromosomes in contrast with the short and numerous chromosomes of B. mori. More systematic and detailed comparison is needed for examination of the extent of synteny between species belonging to different insect orders.
Conclusion:
We report here the first integrated genetic and physical maps containing >500 novel polymorphic STSs and 524 mapped BAC contigs in B. mori. The STSs will be useful for genetic analysis and marker-assisted breeding since they can be used for a wide range of parental strains in many genetic combinations (Y. Yasukochi, unpublished results). A total of 524 mapped BAC contigs with a close relationship to the cytogenetic analysis carried out by BAC–FISH (Yoshido et al. 2005) are now ready for chromosome walking. BAC–DNA samples including known genes will be provided from the DNA bank of the National Institute of Agrobiological Sciences (http://www.dna.affrc.go.jp/). Moreover, we found the first clear evidence not only for synteny but also for conserved order of orthologous genes of diverse function between two relatively distantly related lepidopteran species, supporting the feasibility of using genome information from B. mori for analysis of other lepidopteran insects. With these and other resources now in development, we will be able to characterize the whole genome of B. mori in a relatively short time.
Acknowledgments
We are grateful to M. R. Goldsmith and T. Sasaki for critical reading of the manuscript. We also thank H. Takahashi, E. Igari, H. Hoshida, and T. Maeda for their technical assistance. This work was supported in part by the research program Insect Technology and by a grant-in-aid for scientific research (no. 15380227) from the government of Japan.
References
- Banno, Y., H. Fujii, Y. Kawaguchi, K. Yamamoto, K. Nishikawa et al., 2005. A Guide to the Silkworm Mutants 2005: Gene Name and Gene Symbol. Institute of Genetic Resources, Kyushu University, Fukuoka, Japan
- Cheng, T. C., Q. Y. Xia, J. F. Qian, C. Liu, Y. Lin et al., 2004. Mining single nucleotide polymorphisms from EST data of silkworm, Bombyx mori, inbred strain Dazao. Insect Biochem. Mol. Biol. 34: 523–530. [DOI] [PubMed] [Google Scholar]
- Goldsmith, M. R., T. Shimada and H. Abe, 2004. The genetics and genomics of the silkworm, Bombyx mori. Annu. Rev. Entomol. 50: 71–100. [DOI] [PubMed] [Google Scholar]
- Hunt, G. J., and R. E. Page, 1995. Linkage map of the honey bee, Apis mellifera, based on RAPD markers. Genetics 139: 1371–1382. [DOI] [PMC free article] [PubMed] [Google Scholar]
- Jiggins, C. D., J. Mavarez, M. Beltrán, W. O. McMillan, J. S. Johnston et al., 2005. A genetic linkage map of the mimetic butterfly, Heliconius melpomene. Genetics 171: 557–570. [DOI] [PMC free article] [PubMed] [Google Scholar]
- Lander, E. S., P. Green, J. Abrahamson, A. Barlow, K. Daly et al., 1987. MAPMAKER: an interactive computer package for constructive primary genetic linkage maps of experimental and natural populations. Genomics 16: 224–230. [DOI] [PubMed] [Google Scholar]
- Lorenzen, M. D., Z. Doyungan, J. Savard, K. Snow, L. R. Crumly et al., 2005. Genetic linkage maps of the red flour beetle, Tribolium castaneum, based on bacterial artificial chromosomes and expressed sequence tags. Genetics 170: 741–747. [DOI] [PMC free article] [PubMed] [Google Scholar]
- Miao, X. X., S-J. Xu, M-H. Li, M-W. Li, J-H. Huang et al., 2005. Simple sequence repeat-based consensus linkage map of Bombyx mori. Proc. Natl. Acad. Sci. USA 102: 16303–16308. [DOI] [PMC free article] [PubMed] [Google Scholar]
- Mita, K., M. Morimyo, K. Okano, Y. Koike, J. Nohata et al., 2003. The construction of an EST database for Bombyx mori and its application. Proc. Natl. Acad. Sci. USA 100: 14121–14126. [DOI] [PMC free article] [PubMed] [Google Scholar]
- Mita, K., M. Kasahara, S. Sasaki, Y. Nagayasu, T. Yamada et al., 2004. The genome sequence of silkworm, Bombyx mori. DNA Res. 11: 27–35. [DOI] [PubMed] [Google Scholar]
- Nguu, E. K., K. Mase, K. Kadono-Okuda, E. Kosegawa and W. Hara, 2005. Molecular linkage map for the silkworm, Bombyx mori, based on restriction fragment length polymorphism of cDNA clones. J. Insect Biotechnol. Sericology 74: 5–13. [Google Scholar]
- Prasad, M. D., M. Muthulakshmi, M. Madhu, S. Archak, K. Mita et al., 2005. Survey and analysis of microsatellites in the silkworm, Bombyx mori: frequency, distribution, mutations, marker potential and their conservation in heterologous species. Genetics 169: 197–214. [DOI] [PMC free article] [PubMed] [Google Scholar]
- Promboon, A., T. Shimada, H. Fujiwara and M. Kobayashi, 1995. Linkage map of random amplified polymorphic DNAs (RAPDs) in the silkworm, Bombyx mori. Genet. Res. 66: 1–7. [Google Scholar]
- Sahara, K., F. Marec and W. Traut, 1999. TTAGG telomeric repeats in chromosomes of some insects and other arthropods. Chromosome Res. 7: 449–460. [DOI] [PubMed] [Google Scholar]
- Sahara, K., A. Yoshido, N. Kawamura, A. Ohnuma, H. Abe et al., 2003. W-derived BAC probes as a new tool for identification of the W chromosome and its aberrations in Bombyx mori. Chromosoma 112: 48–55. [DOI] [PubMed] [Google Scholar]
- Shi, J., D. G. Heckel and M. R. Goldsmith, 1995. A genetic linkage map for the domesticated silkworm, Bombyx mori, based on restriction fragment length polymorphisms. Genet. Res. 66: 109–126. [Google Scholar]
- Tan, Y., C. Wan, Y. Zhu, C. Lu, Z. Xiang et al., 2001. An amplified fragment length polymorphisms map of the silkworm. Genetics 157: 1277–1284. [DOI] [PMC free article] [PubMed] [Google Scholar]
- Wu, C., S. Asakawa, N. Shimizu, S. Kawasaki and Y. Yasukochi, 1999. Construction and characterization of bacterial artificial chromosome libraries from the silkworm, Bombyx mori. Mol. Gen. Genet. 261: 698–706. [DOI] [PubMed] [Google Scholar]
- Xia, Q., Z. Zhou, C. Lu, D. Cheng, F. Dai et al., 2004. A draft sequence for the genome of the domesticated silkworm (Bombyx mori). Science 306: 1937–1940. [DOI] [PubMed] [Google Scholar]
- Yasukochi, Y., 1998. A dense genetic map of the silkworm, Bombyx mori, covering all chromosomes based on 1018 molecular markers. Genetics 150: 1513–1525. [DOI] [PMC free article] [PubMed] [Google Scholar]
- Yasukochi, Y., 1999. A simple and accurate method for generating co-dominant markers: an application of conformation-sensitive gel electrophoresis on the silkworm linkage analysis. Mol. Gen. Genet. 261: 796–802. [DOI] [PubMed] [Google Scholar]
- Yasukochi, Y., 2002. PCR-based screening for bacterial artificial chromosome libraries, pp. 401–410 in Methods in Molecular Biology, Vol. 192, edited by B.-Y. Chen and H. W. Janes. Humana Press, Totowa, NJ. [DOI] [PubMed]
- Yasukochi, Y., L. Ashakumary, C. Wu, A. Yoshido, J. Nohata et al., 2004. Organization of the Hox gene cluster of the silkworm, Bombyx mori: a split of the Hox cluster in a non-Drosophila insect. Dev. Genes Evol. 214: 606–614. [DOI] [PubMed] [Google Scholar]
- Yasukochi, Y., Y. Banno, K. Yamamoto, M. R. Goldsmith and H. Fujii, 2005. Integration of molecular and classical linkage groups of the silkworm, Bombyx mori (n = 28). Genome 48: 626–629. [DOI] [PubMed] [Google Scholar]
- Yoshido, A., H. Bando, Y. Yasukochi and K. Sahara, 2005. The Bombyx mori karyotype and the assignment of linkage groups. Genetics 170: 675–685. [DOI] [PMC free article] [PubMed] [Google Scholar]


