


Abstract
RAG1 and RAG2 catalyze the initial DNA cleavage steps in V(D)J recombination. Fundamental properties of these proteins remain largely unknown. Here, self-association and conformational properties of murine core RAG1 (residues 384–1008) were examined. As determined by multi-angle laser light scattering measurements, the molecular masses of two predominant core RAG1 species corresponded to dimeric and tetrameric states. Similar results were obtained using a RAG1 fragment containing residues 265–1008, indicating that a non-core portion of RAG1 does not alter the oligomerization states observed for the core region. The fraction of core RAG1 in the tetrameric state increased significantly at lower ionic strengths (0.2 versus 0.5 M NaCl), indicating that this oligomeric form may factor into the physiological function of RAG1. In addition, the secondary structural content of core RAG1, obtained by circular dichroism spectroscopy, demonstrated a significant dependence on ionic strength with a 26% increase in α-helical content from 0.2 to 1.0 M NaCl. Together, these results indicate that structural and oligomerization properties of core RAG1 are strongly dependent on electrostatic interactions. Furthermore, the secondary structure of core RAG1 changes upon binding to DNA, with larger increases in α-helical content upon binding to the recombination signal sequence (RSS) as compared with non-sequence-specific DNA. As shown by electrophoretic mobility shift assays, higher order oligomeric forms of core RAG1 bound to the canonical RSS. Furthermore, core RAG2 (residues 1–387) formed complexes with multimeric RAG1 species bound to a single RSS, providing additional support for the physiological relevance of higher order oligomeric states of RAG1.
INTRODUCTION
During lymphocyte development, V(D)J recombination produces the intact exons that encode the antigen-binding domains of the immunoglobulin and T cell receptor (1–3). In this mechanism, functional genes are created by joining together gene segments selected from two or three different pools termed V (variable), D (diversity) and J (joining); thereby introducing the sequence diversity characteristic of the antigen specific receptors. Two lymphoid-specific recombination activating proteins, RAG1 and RAG2 (4,5), catalyze the initial DNA cleavage steps in the recombination reaction (6). The RAG proteins are directed to the appropriate cleavage sites by the conserved recombination signal sequence (RSS) that flanks each V, D and J gene segment (1). The RSS consists of conserved heptamer and nonamer sequences separated by a spacer of 12 or 23 bp (referred to as 12-RSS and 23-RSS, respectively). Efficient in vivo reactions follow the 12/23 rule, which dictates that recombination occurs between two RSSs with dissimilar spacer lengths.
The mechanism of V(D)J recombination is separated into two phases: (i) DNA cleavage and (ii) joining of gene segments (2,3). In phase 1, the RAG proteins together catalyze double-stranded cleavage between the RSS and the bordering gene segment in a two-step mechanism. First, the RAG proteins nick the DNA at the border between the RSS heptamer and the gene segment. Secondly, the resulting 3′ hydroxyl group on the nicked strand performs nucleophilic attack on the opposite strand of DNA, forming a phosphodiester bond, and hence creating a DNA hairpin at the terminal end of the coding sequence (6). Thus, after double-stranded DNA cleavage, the RSS is terminated at the 5′ end by a blunt double-stranded break (signal end); and the 3′ end of the receptor coding sequence is sealed with a covalently closed hairpin (coding end). In phase 2, the 12 and 23 signal ends are joined heptamer-to-heptamer in a precise junction (2,3). In contrast, joining of coding ends is imprecise due to the addition or deletion of nucleotides before ligation. The imprecision of the coding joints leads to further diversity in the variable regions of the antigen specific receptors. Besides the presence of the RAG proteins, phase 2 also requires proteins that function in non-homologous end joining DNA repair, such as Ku 70/80, DNA-PKCS, Artemis, XRCC4, and DNA Ligase IV (3,7). Studies have shown that after DNA cleavage, the RAG proteins remain bound to the signal ends (8), as well as the coding ends (9), possibly serving to direct the joining process.
The majority of studies on the RAG proteins have been accomplished using fragments referred to as the core regions, which includes residues 384–1008 of 1040 for murine RAG1 and 1–387 of 527 for murine RAG2 (10–13). Both core proteins are soluble and retain all DNA cleavage activity in both in vivo and in vitro assays when expressed fused to either maltose binding protein (MBP) or glutathione S-transferase (GST). As a result, virtually all biochemical studies on V(D)J recombination to date have been done using these fusion proteins (3). Core RAG1 was previously shown to contain a triad of acidic residues (Asp600, Asp708 and Glu962) known as the DDE motif (14–16). These residues are essential for the endonucleolytic activities of the RAG proteins and are hypothesized to coordinate one or two divalent metal cations, as do other enzymes containing the DDE motif (17). In addition, it has been reported that core RAG1 alone can bind to the canonical RSS (12 or 23) with specificity for both the nonamer and heptamer conserved sequences (18,19). The RSS nonamer is recognized by the N-terminal region of core RAG1 (20,21), which includes residues 384–454 in the full-length protein, and is referred to here as the nonamer-binding region (NBR). In addition, a domain within core RAG1, referred to as the central domain (residues 528–760), was recently found to bind the RSS heptamer with sequence specificity (22). In contrast to RAG1, the contribution of RAG2 to the V(D)J recombination reaction is not clear. Although, RAG2 alone does not bind to DNA, it appears to facilitate interaction of RAG1 with the RSS, perhaps through induction of a conformational change in either RAG1 or the RSS (23,24).
Multiple protein–DNA complexes form during the pathway of the V(D)J recombination reaction. For example, in phase 1 the RAG proteins bind to a 12-RSS or 23-RSS independently (single RSS complex), or to both simultaneously to form a paired complex (9). Under physiological conditions, DNA nicking occurs in either the single RSS complex or the paired complex, while the hairpin is formed efficiently only in the paired complex (25). Thus, completion of double-stranded DNA cleavage is coupled between a 12- and 23-RSS, consistent with the 12/23 rule. The single RSS and paired complexes that function in phase 1 are largely undefined, with contradictory reports on the stoichiometry of the RAG1 and RAG2 subunits in each complex (23,26–28).
Given the multiple complexes that may be significant for both phases of V(D)J recombination, it is important to understand both the homo- and hetero-oligomerization properties of the RAG proteins to elucidate the macromolecular interactions that occur during the course of the reaction. Here, we report the self-association and conformational properties of core RAG1 under a variety of solution conditions, as well as bound to DNA. Our main finding is that core RAG1 forms multiple oligomeric species, and that two separate oligomers can form heterocomplexes with the RSS and RAG2. The implications of these results towards understanding the complexes formed during V(D)J recombination are discussed.
MATERIALS AND METHODS
Protein expression and purification
Plasmid pCJM233, which encodes for MBP fused to core RAG1, referred to as MBP-core RAG1, was previously described (19). Plasmid pJLA2 encoding for MBP* was produced by inserting an oligonucleotide duplex containing a stop codon immediately 3′ to the BamHI site of pMAL-c2 (New England Biolabs, Beverly, MA). Plasmid pCJM232, which encodes for MBP fused to RAG1 residues 265–1008, was a generous gift from David Schatz. All MBPs were expressed in Escherichia coli as previously reported (19,22). MBP* and MBP-RAG1 proteins were purified according to the published protocol (22). GST-core RAG2, expressed by transient transfection in 293T cells, was purified as previously described (20).
Multi-angle laser light scattering with size-exclusion chromatography
Multi-angle laser light scattering coupled with size-exclusion chromatography (MALLS-SEC) was accomplished using a DAWN DSP laserphotometer coupled with an Optilab DSP interferometric refractometer (Wyatt Technology, Santa Barbara, CA) and combined in-line with a Superdex 200 gel filtration column (Amersham Pharmacia, Piscataway, NJ). The chromatographic separations were performed at room temperature. The column buffer consisted of 20 mM Tris pH 8.0, 50 µM ZnCl2, 5 mM β-mercaptoethanol (BME), and 0.2, 0.5 or 1 M NaCl. Initial protein concentrations were between 1.3 and 1.8 mg/ml for each experiment. Molecular mass calculations were performed using Astra 4.72 software. Input of the refractive increment (dn/dc values) was set at 0.19 for each protein in all the molecular mass calculations, based on the premise that dn/dc is constant for unmodified proteins (29).
Size-exclusion chromatography (SEC) of RAG1:RSS complexes
SEC was accomplished using a Superdex 200 gel filtration column (at room temperature) combined in-line with a DSP interferometric refractometer. The column buffer consisted of 20 mM Tris pH 8.0, 0.2 M NaCl, 10 µM ZnCl2, 5 mM BME. Initial protein and DNA concentrations were 16 and 4 µM, respectively. Peak integrations were calculated using Astra 4.72 software.
Circular dichroism (CD) spectropolarimetry
The CD spectroscopy experiments were performed using a JASCO J715 Spectropolarimeter with a PTC-348WI peltier temperature controller (Jasco, Corp., Tokyo, Japan). The following spectral parameters were used: 300–200 nm wavelength range, 0.1 cm cuvette pathlength, and 10 accumulations per spectrum. All spectra were measured at 20°C. The CD buffer for experiments examining structural dependence on ionic strength contained 10 mM HEPES pH 7.5, 50 µM ZnCl2, 2 mM BME, and 0.2, 0.5 or 1 M NaCl. BME was necessary to prevent protein crosslinking and disruption of zinc binding sites (30). The protein samples were dialyzed for 17 h at 4°C in the CD buffer prior to acquiring the CD spectra.
For the CD experiments examining the conformation of RAG1 in the presence of DNA, CD buffer contained 10 mM Tris pH 8, 100 mM NaCl and 1 mM BME. The protein (MBP-core RAG1 or MBP*) and DNA concentrations were 1.7 and 0.425 µM, respectively. The WT 12-RSS and MHMN duplexes were obtained by annealing the appropriate oligonucleotide sequences as previously described (22). To show only the changes in protein structure, a spectrum measuring the respective DNA alone was subtracted from the spectrum containing protein and DNA.
Protein secondary structural content was obtained using the CDPro software package (31) (available at http://lamar. colostate.edu/∼sreeram/CDPro). All three programs available in the CDPro package, including CONTIN, SELCON3 and CDSSTR, were executed using the same 43 protein reference library. The values from the resulting calculations were averaged to yield the percentages of α-helix and β-sheet for each protein sample.
Electrophoretic mobility shift assay (EMSA)
Preparation of the 12-RSS substrate is as reported previously (22). The published protocol for the EMSA (22) was used with the following modifications. For higher resolution of the multiple protein–DNA complexes, a discontinuous, non-denaturing gel of 3.5/8% polyacrylamide was used. For EMSA with RAG1 alone, the binding buffer contained 10 mM Tris pH 8.0, 5 mM MgCl2, 6% glycerol, 50 mM NaCl, and 2 mM dithiothreitol. In assays with both RAG1 and RAG2 present, 2 mM CaCl2 was used in the binding buffer in place of MgCl2 to prevent DNA cleavage. The non-specific competitor in each sample was 0.5 µM of a 26 base single-stranded oligonucleotide, consisting of the previously listed sequence (22).
EMSA performed on SEC samples (omitting the protein concentration step) was done as follows. The SEC buffer was 20 mM Tris pH 8.0, 0.2 M NaCl, 10 µM ZnCl2, 5 mM BME. Both the dimeric and tetrameric MBP-core RAG1 in the EMSA experiments were at a final concentration of 0.35 µM. EMSA was otherwise performed as described above.
RESULTS
Core RAG1 self associates to form multiple oligomeric species
Previous studies using SEC showed that core RAG1 (fused to MBP) predominantly formed a dimer in solution (19). In these studies, molecular mass determination from SEC was derived by comparison with the elution profiles of proteins with known molecular masses. However, as shape-dependent factors can also contribute to the elution profile of macromolecules from SEC, the results from this method are susceptible to mis interpretation (29). Here, we report the analysis of the self-association properties of MBP-core RAG1 using MALLS measurements coupled with SEC. MALLS yields the absolute mass of macromolecules independent of molecular shape, and separation of components by SEC allows each resolved species to be analyzed separately (29). Examination of the MALLS-SEC results revealed that MBP-core RAG1 existed as a mixture of mainly dimers and tetramers. A representative molecular mass distribution plot is shown in Figure 1. There are two plateaus in the molecular mass profile (labeled D and T in Fig. 1) indicating two different oligomeric species of MBP-core RAG1. Sample that eluted in the latter predominant peak (labeled peak 3) yielded an average molecular mass of 227 ± 18 kDa (plateau D). This corresponds well with the predicted mass for dimeric MBP-core RAG1 of 231 kDa determined from amino acid composition. The dimeric protein is monodisperse as the experimentally determined molecular masses are equivalent across peak 3. Sample that eluted in peak 2 yielded an average molecular mass of 452 ± 41 kDa (plateau T). The molecular mass profile for protein that eluted early in peak 2 is somewhat polydisperse. It is possible that small quantities of higher order (than tetramer) oligomers of MBP-core RAG1 elute at these volumes, and although representing a minor fraction of protein, their large sizes would produce a disproportionately greater contribution to the light scattering signal. We consider that oligomers of greater molecular mass than tetrameric RAG1 are not present at levels that are physiologically relevant. Even with the increased polydispersity in peak 2, the calculated molecular mass yields values that are within 10% of the calculated molecular mass of tetrameric MBP-core RAG1 (at 462 kDa). Thus, Figure 1 clearly demonstrates two resolved oligomeric forms of MBP-core RAG1. Importantly, there are no plateaus in the molecular mass profile, or peaks in the elution profile, that represent major quantities of monomeric or trimeric forms of MBP-core RAG1.
Figure 1.

Analysis of MBP-core RAG1 oligomerization states. A molar mass distribution plot representing the results obtained by subjecting MBP-core RAG1 to MALLS-SEC is shown. The continuous solid line represents the elution profile of MBP-core RAG1 from a Superdex 200 column as monitored by a refractometer detector. The molecular mass profile measured by light scattering (filled squares, plotted versus left axis) of the material that eluted at the corresponding volumes is overlaid on the elution profile. The bracketed plateaus labeled D and T represent sample that eluted at molecular masses corresponding to dimeric and tetrameric forms of MBP-core RAG1, respectively. The chromatographic buffer in this experiment included 0.5 M NaCl.
Peak 1 corresponds to sample that eluted in the void volume, which is likely misfolded or non-specifically aggregated protein, as repeated chromatography of sample from this peak does not result in redistribution to dimeric or tetrameric protein. In contrast, protein eluting in the tetrameric peak will redistribute to the original proportions of dimer and tetramer upon a second chromatographic separation (data not shown).
Importantly, the self-association properties of the fusion protein are due to the core region of RAG1, not the MBP tag. Analysis of control runs performed with MBP samples (after cleavage of the fusion proteins) showed that the elution profile consisted of a single monodisperse peak with a calculated molecular mass of 49 ± 7 (data not shown), consistent with monomeric MBP at 43 kDa. These results are also consistent with previous small-angle X-ray scattering measurements, which demonstrated that MBP is monomeric to concentrations of 20 mg/ml (30). Hence, MBP is not responsible for the oligomerization of MBP-core RAG1 shown in these experiments.
Ionic strength dependent properties of core RAG1
The distribution of multiple oligomers of ASV integrase and HIV-1 integrase, which are both DDE motif enzymes, have been shown to vary significantly with solution conditions (32,33). To determine if the self-association properties of MBP-core RAG1 are dependent on solution conditions, MALLS-SEC experiments were performed over a range of ionic strengths (from 0.2 to 1.0 M NaCl) and pH (from pH 6.0 to 8.0). Figure 2 shows typical MALLS-SEC experiments in buffers containing NaCl concentrations of 0.2 M (Fig. 2A) and 1.0 M (Fig. 2B). The ratios of the total sample eluting in the dimeric peak versus that eluting in the earlier broader peak, as determined by peak integration, demonstrate an increased association to higher oligomeric forms with decreasing ionic strength. Specifically, from 1.0 to 0.2 M NaCl the ratio of tetramer to dimer fractions increased by ∼3-fold. These results therefore indicate that tetramer formation is favored by electrostatic interactions, and that this oligomer may be present at sufficient quantities at physiological conditions to play a role in RAG1 function in vivo.
Figure 2.

Analysis of MBP-core RAG1 oligomerization versus ionic strength. The molar mass distribution plots for MALLS-SEC analyses performed on MBP-core RAG1 at (A) 0.2 M NaCl and (B) 1.0 M NaCl are shown. Brackets indicate sample that eluted from the column at the molecular weights corresponding to dimeric and tetrameric MBP-core RAG1.
Since the overall charge of the protein is predicted to increase by 20 positive charge units from pH 8.0 to 6.0 (based on amino acid composition), and as electrostatic interactions favor formation of tetrameric MBP-core RAG1, it is possible that changes in pH may also alter the redistribution of oligomeric forms of MBP-core RAG1. To test this possibility, MALLS-SEC experiments were performed in buffers at pH 6.0, 7.0 and 8.0. The results demonstrated that there were no significant alterations in the distribution of oligomeric species of MBP-core RAG1 from pH 6.0 to 8.0 (data not shown), indicating that changes in the overall charge of the protein in this pH range were not sufficient to significantly alter the self-association properties.
A non-core domain in RAG1 does not affect oligomerization of core RAG1
Previous studies in vitro with the RAG proteins have been accomplished with only the core regions due to their enhanced solubility (3). While important information can be gained by investigating the properties of the core RAG proteins, potential effects of the non-core regions on the physiological activity need to be considered. For example, a non-core domain in RAG1 capable of dimerization was previously identified (30,34,35). This domain [referred to as the zinc-binding dimerization domain (ZDD)] spans residues 265–380 of the full length protein, contains a zinc RING motif and a C2H2 zinc finger, and efficiently dimerizes when expressed separately as a fusion protein with MBP. To determine if the ZDD could affect the oligomeric states of core RAG1, the self-association properties of MBP-RAG1(zc), which includes RAG1 residues 265–1008 fused to MBP, were analyzed. This protein was as active as MBP-core RAG1 in DNA cleavage activities when combined with RAG2 (data not shown).
MBP-RAG1(zc) yielded four resolved peaks from MALLS-SEC (Fig. 3). The experimentally derived molecular masses for peaks 2 and 3 (545 ± 35 kDa for peak 2 and 235 ± 23 for peak 3) correspond to the expected masses for tetrameric (at 504 kDa) and dimeric (at 252 kDa) MBP-RAG1(zc), respectively. Similarly to Figure 1, the sample eluting in peak 2 appears to be somewhat polydisperse, which is most likely due to the presence of a small percentage of oligomers of higher order than the tetrameric form. Peak 4 corresponds to a prominent proteolytic product containing MBP fused to ZDD, which resulted from proteolysis during protein purification at a previously reported highly prone cleavage site that is C-terminal to the ZDD (30,34,35). The molecular mass of sample that eluted in peak 4 was determined to be 123 ± 12 kDa, which is consistent with previous results that MBP-ZDD (predicted dimeric mass of 113.5 kDa) is dimeric in solution. Peak 1 represents sample eluting as non-specifically aggregated protein in the void volume, as is observed in Figure 1 for MBP-core RAG1.
Figure 3.

Analysis of MBP-RAG1(zc) oligomerization states. The molar mass distribution plot for MALLS-SEC analysis of MBP-RAG1(zc) is shown. Molecular mass profiles (filled squares, plotted versus left axis) is shown for peaks 2, 3 and 4. Peak 1 represents sample that eluted in the void volume of the column. The chromatographic buffer is this experiment included 0.2 M NaCl.
The ratio of tetrameric to dimeric MBP-RAG1(zc) (peak 2 versus peak 3) is somewhat larger (∼1.8-fold) than for MBP-core RAG1 in buffer containing 0.2 M NaCl (Fig. 2A), which is indicative that the ZDD may enhance formation of tetrameric RAG1. Thus, the ZDD may extend the oligomerization interface of core RAG1, but this non-core region does not result in altered oligomerization states of the protein.
Secondary structure analysis of core RAG1
In addition to the self-association properties of core RAG1, we have characterized the secondary structure of core RAG1 and its conformational flexibility under various solution conditions. CD spectroscopy was used to determine the secondary structure of core RAG1. In these experiments, the CD spectrum of MBP-core RAG1 fusion protein was obtained first, followed by measurement of MBP* under identical solution conditions. MBP* refers to MBP plus the linker region used to join MBP to core RAG1 in the fusion protein. After conversion of the spectra to units of molar ellipticity, the MBP* and MBP-core RAG1 spectra were subtracted to yield the signal due only to core RAG1 (Fig. 4A). We estimate from the resulting spectrum that the structure of core RAG1 consists of 21 ± 3% α-helix and 23 ± 3% β-sheet in buffer containing 0.2 M NaCl. This analysis was performed using the three programs CONTIN, SELCON3 and CDSSTR (31), which results in a higher accuracy for the determination of protein secondary structural content, even with a reduced spectral range (λ ∼ 200 nm and greater) (31,36). As the results from MALLS-SEC demonstrated that the oligomeric states were in equilibrium, the dimeric and tetrameric fractions from SEC were combined and used in these experiments.
Figure 4.

CD spectroscopy of core RAG1. CD spectra of (A) core RAG1 and (B) MBP* in buffers containing 0.2 (- - - -), 0.5 (– – – –) and 1.0 M NaCl (—). CD spectra are in units of molar ellipticity versus wavelength. Spectra of core RAG1 were obtained by subtracting the spectrum for MBP* from the respective spectrum of MBP-core RAG1.
To determine if the redistribution of MBP-core RAG1 oligomeric species with ionic strength may be coupled with conformational changes, we performed CD spectroscopy for MBP-core RAG1 at NaCl concentrations of 0.2, 0.5 and 1.0 M. As shown in Figure 4A, a substantial increase in negative ellipticity at 208 and 222 nm occurred with increasing ionic strength. As described above, contributions of MBP* were subtracted from the spectra of MBP-core RAG1 to obtain signal due to core RAG1. Significantly, MBP* showed no spectral changes with ionic strength (Fig. 4B), indicating that only the core RAG1 region of the fusion protein demonstrated ionic strength dependent conformational changes. Calculation of the secondary structure composition indicated that 26% α-helical character is gained with an increase in ionic strength from 0.2 to 1.0 M, whereas the percentage of β-sheet decreased only slightly. Most likely, the increase in α-helicity with increased NaCl concentration was due to regions of random coil gaining helical structure, which in this protein may be electrostatically unfavorable at the lower ionic strength conditions. Whether the increase in tetramer formation observed by light scattering is solely responsible for the corresponding loss in α-helical content with decreasing ionic strength found by CD has yet to be determined.
Self-association and conformational properties of core RAG1 in the presence of the RSS
We asked if addition of DNA would alter the observed proportions of dimeric and tetrameric MBP-core RAG1 observed in the MALLS-SEC experiments. Addition of 12-RSS to MBP-core RAG1 at ratios of 1:4 was followed by SEC (equilibrated in buffer containing 0.2 M NaCl). The resulting profile demonstrates that ∼10% of protein in the dimeric peak is shifted into the tetramer peak, as compared with the elution profile of MBP-core RAG1 obtained in the absence of DNA (Fig. 5A). Thus, at stoichiometric ratios of DNA to protein, we have found that 12-RSS enhances the oligomerization of MBP-core RAG1 from dimer to tetramer, suggesting that a RAG1 dimer bound to the RSS enhances the binding of a second dimer to form a RAG1 tetramer complexed to the RSS.
Figure 5.

Analysis of MCR1 oligomerization and conformation in the presence of the RSS. (A) SEC of protein/DNA complexes. The refractive index plot for SEC analysis performed on MBP-core RAG1 alone (top) and MBP-core RAG1 in the presence of 12-RSS (bottom). Brackets indicate sample that eluted from the column at the molecular weights corresponding to dimeric and tetrameric MBP-core RAG1. An asterisk indicates a separate peak contributed by the DNA. (B) CD of protein/DNA complexes. CD spectra of MBP-core RAG1 alone (- - - -), MBP-core RAG1 in the presence of MHMN (—), and MBP-core RAG1 in the presence of WT 12-RSS (— -). The insert shows the CD spectra of MBP* alone (- - - -) and MBP* in the presence of WT 12-RSS (—). CD spectra are in units of millidegrees versus wavelength. Spectra of MBP-core RAG1 and MBP* were obtained by subtracting the spectrum for DNA alone from the respective protein plus DNA spectrum.
Furthermore, given the CD results demonstrated the potential flexibility in the structure of core RAG1, we asked if the conformation of the protein would be altered upon binding to the RSS. The CD spectra for MBP-core RAG1 in the absence of DNA, and bound to WT 12-RSS or non-sequence-specific DNA, are shown in Figure 5B. The non-sequence-specific DNA is an oligonucleotide duplex, referred to as MHMN, in which the nonamer and heptamer sequences have been altered as previously described (22). The spectral differences between unbound and DNA-bound protein appear small due to the large size of the fusion protein (1029 residues). However, from secondary structural analysis (see Materials and Methods), we estimate that as many as 20 residues gain α-helical structure upon binding to WT 12-RSS, with a smaller increase of ∼12 residues forming α-helical structure in the presence of the non-sequence-specific MHMN oligonucleotide duplex. MBP alone does not demonstrate a structural change upon addition with WT 12-RSS (Fig. 5B, insert). Thus, as expected, the conformational changes observed in Figure 5B are due strictly to the core RAG1 portion of the fusion protein. The CD results shown in Figure 5B differ from a recent report by Ciubotaru et al. (37), which showed a dramatic decrease in secondary structure of a core RAG1 fragment upon addition of 12-RSS. However, the surprising result was also reported that sub-stoichiometric concentrations of 12-RSS induced aggregation of the unbound protein; therefore, it is not clear if the structural changes resulted from DNA-bound protein or aggregated unbound protein. It is possible that the contrasting results observed by Ciubotaru et al. (37) versus those reported here are due to the use of different constructs of core RAG1, and/or differences in solution conditions.
Core RAG1 forms multiple complexes with the RSS
At least three protein–DNA complexes of different stoichiometries form between MBP-core RAG1 and the RSS, as previously determined using an EMSA (19). However, due to the resolution limits of the polyacrylamide gel used in the DNA binding assay it was difficult to resolve if greater than three protein–DNA complexes of different stoichiometries were formed. In addition, the experiments were not accomplished with the separate dimeric and tetrameric fractions of the protein. Here, we used separate tetrameric and dimeric MBP-core RAG1 samples purified with SEC in an EMSA system that allows us to resolve the multiple protein–DNA complexes formed. We observed the formation of four separate protein–DNA species (Fig. 6A; using tetrameric MBP-core RAG1), with an overall affinity of the MBP-core RAG1 protein to the 12-RSS similar to that previously determined (19). Significantly, the complexes also formed at ionic strengths up to 0.2 M NaCl (data not shown), correlating the results from EMSA with the SEC experiment shown in Figure 5A. In addition, a similar pattern of bands was observed when MBP-core RAG1 was replaced with MBP-RAG1(zc), demonstrating that the ZDD does not significantly affect the interaction of core RAG1 with the RSS (data not shown).
Figure 6.

EMSA of 32P-labeled 12-RSS with MBP-core RAG1. (A) 32P- labeled 12-RSS was titrated with increasing concentrations (0–0.2 µM) of MBP-core RAG1, in the presence of non-specific DNA. The reactions were separated by electrophoresis on a discontinuous 3.5/8% non-denaturing polyacrylamide gel. Lower mobility bands (labeled as A–D) correspond to RAG1/12-RSS complexes of differing stoichiometries. (B) EMSA [conducted as in (A)] of 0.35 µM dimeric (lane 1) and tetrameric (lane 2) MBP-core RAG1 SEC fractions combined with 32P-labeled 12-RSS. Shifted complexes are labeled as (A) and (B).
Complexes corresponding to bands C and D only formed significantly after almost complete saturation of DNA (Fig. 6A, lane 5), and likely represent non-sequence-specific protein–DNA complexes in which additional core RAG1 dimers and tetramers associate with the non-RSS portions of the oligonucleotide duplex. In contrast, bands A and B are evident at relatively low concentrations of protein, and in the presence of 500-fold excess non-specific competitor. It is therefore likely that bands A and B form due to sequence-specific interactions between MBP-core RAG1 and the nonamer and heptamer elements of the RSS. This is consistent with previous competition assays that demonstrated the multiple MBP-core RAG1:12-RSS complexes bound specifically to both conserved elements of the RSS (19).
We hypothesized that bands A and B in Figure 6A resulted from the 12-RSS bound by dimeric and tetrameric MBP-core RAG1, respectively. From the SEC of RAG1 and RSS, shown in Figure 5A, it appears that an RSS:tetrameric RAG1 complex can form by the addition of a second dimer to a RAG1 dimer:RSS complex. In addition, we asked if pre-formed tetrameric RAG1 could also bind to the RSS, yielding band B in EMSA. In Figure 6A, utilization of protein from SEC dimeric and tetrameric fractions yielded similar results; however, the fractions were concentrated prior to EMSA, which likely led to redistribution of dimers and tetramers in each sample. Thus, to determine if the pre-formed tetramer of RAG1 could bind to DNA, protein that eluted in the dimeric and tetrameric fractions from SEC were used directly (without prior concentration) in the DNA binding assays. Equivalent protein concentrations from the dimeric and tetrameric fractions were combined separately with 12-RSS, subjected to EMSA, and the proportions of bands A and B visualized by autoradiography (Fig. 5B). The volumes of protein used from the SEC fractions were sufficient to produce only fractional binding to the 12-RSS to ensure the formation of specific protein–DNA complexes. At the protein concentrations used, sample from the dimeric fraction formed predominantly band A upon association with 12-RSS, whereas the tetrameric sample yielded nearly equal proportions of bands A and B (Fig. 6B). The appearance of both bands A and B with the tetramer fraction is most likely due to the incomplete resolution of the tetramer from the dimer peak in SEC. In summary, the results shown here demonstrate that the formation of band A is due to preformed dimer binding to the 12-RSS, in agreement with previous results, whereas band B appears to result from either the formation of preformed tetramer with the 12-RSS (Fig. 6B) or the enhancement of a second dimer to bind to a RAG1 dimer:12-RSS complex (Fig. 5A) in either case yielding four subunits of RAG1 bound to an RSS duplex.
RAG1/RAG2 forms two complexes with the RSS
To further assess the physiological relevance of the multiple oligomeric species of RAG1, we asked if RAG2 could bind with each of the multiple complexes formed between RAG1 and the 12-RSS that are evident in Figure 6. To address this issue, we used EMSA to analyze the interaction of RAG1 and RAG2 with the RSS. An example of our results is shown in Figure 7A. At the protein concentrations used here, RAG1 formed two complexes with the 12-RSS (lane 2). No complexes were observed between RAG2 and the RSS (lane 1). However, addition of both RAG1 and RAG2 resulted in the shifted complexes observed with RAG1 alone, plus the appearance of two additional super-shifted bands (referred to as complexes 1 and 2, lane 3), which we attribute to the addition of RAG2 to each RAG1/RSS complex. In Figure 7, the RAG proteins were incubated together prior to addition to the 12-RSS. Complexes 1 and 2 were active in standard DNA cleavage assays, as determined using previously published methods (38), yielding nicked and hairpin products from the 12-RSS (data not shown).
Figure 7.
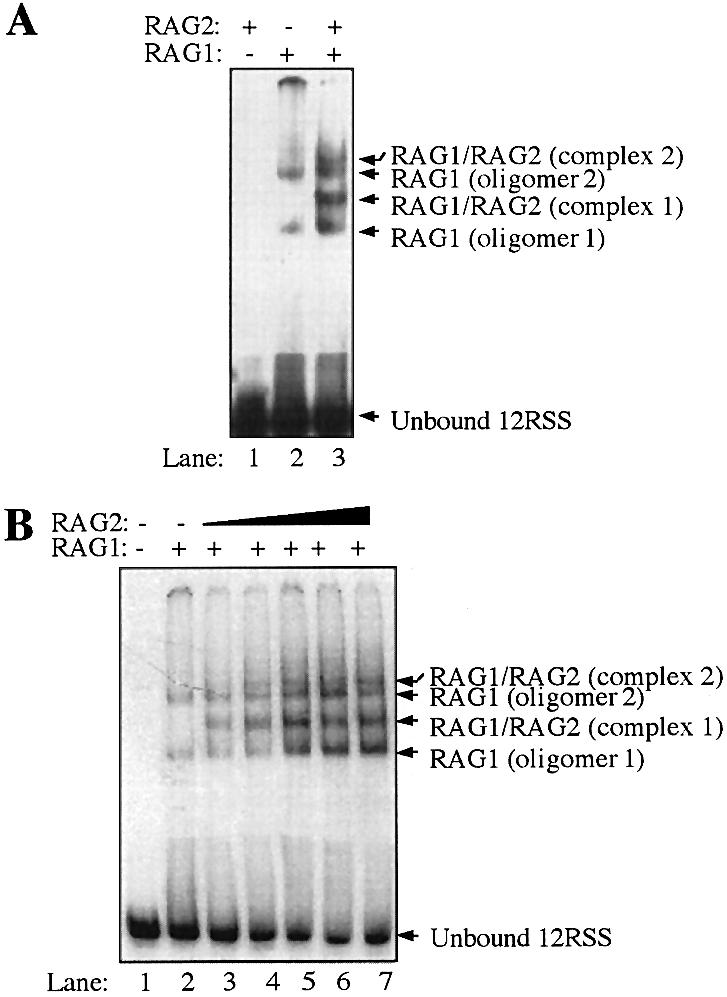
EMSAs of RAG1 and/or RAG2 combined with 32P-labeled 12-RSS. Both EMSA (A) and (B) contain unlabeled, non-specific DNA, and were separated by electrophoresis on discontinuous 3.5/8% non-denaturing polyacrylamide gels. (A) 32P-labeled 12-RSS was incubated with 0.09 µM GST-core RAG2 (lane 1), 0.09 µM MBP-core RAG1 (lane 2), or 0.07 µM of both proteins (lane 3). The shifted bands corresponding to two oligomeric forms of RAG1 bound to the 12-RSS are designated as RAG1 oligomer 1 and 2 (lanes 2 and 3). Supershifted bands that require the presence of both RAG1 and RAG2 are denoted as RAG1/RAG2 complexes 1 and 2 (lane 3). The higher mobility bands corresponding to free 32P-labeled 12-RSS DNA are labeled as unbound. (B) Increasing concentrations (0–0.08 µM) of GST-core RAG2 were titrated into samples containing 32P-labeled 12-RSS and a constant amount (0.07 µM) of MBP-core RAG1 (lanes 2–7). Higher and lower mobility bands are marked as in (A).
To further characterize this interaction, we titrated increasing concentrations of GST-core RAG2 into samples containing 12-RSS and a constant concentration of MBP-core RAG1 (Fig. 7B). Again we observed the formation of two supershifted complexes containing both RAG1 and RAG2, with no third or fourth supershifted complexes formed. The highest concentrations of RAG2 yielded >60% retention of 12-RSS in the protein–DNA complexes (lanes 6 and 7), which was significantly greater than with RAG1 only at <10% retention (lane 2). This translates into an ∼20-fold higher affinity of the RAG1:RAG2 complex to the 12-RSS versus RAG1 only to the 12-RSS. Interestingly, all shifted bands, including those corresponding to the RAG1:RSS complexes, increased in intensity with increasing RAG2 concentrations. This may indicate facile exchange of RAG2 in the RAG1:RAG2: 12-RSS complexes, in which assembly with RAG2 induces a change in the conformation of RAG1 that allows stronger interaction with the RSS. In addition, no apparent RAG2 supershifts are observed with bands C and D in Figure 6, when higher RAG1 concentrations are used (data not shown). Thus, the results show the ability of RAG2 to form complexes with dimeric and tetrameric RAG1 bound to a single 12-RSS. In complex 2 containing tetrameric RAG1, we cannot discern from the experiments shown here whether all subunits are in contact with the single RSS or whether two dimers are stacked upon each other and primed for formation of the paired complex. This latter possibility is likely, as it has recently been shown that the full complement of the RAG proteins in the paired complex can form first on a single RSS (27).
DISCUSSION
To further understand the V(D)J recombination reaction, it is necessary to systematically investigate each macromolecular interaction that occurs in formation of the catalytically active complexes containing the RAG proteins and the RSSs. To accomplish this goal, we have initiated characterization of the V(D)J recombinase by first analyzing the properties of RAG1. Investigating properties of this protein was the logical starting point, as RAG1 contains the DNA binding motifs that target the recombinase to the RSS (20–22). Here we report the self-association properties and secondary structural characteristics of core RAG1, as well as complex formation of this protein with the RSS and RAG2. From MALLS-SEC, we conclude that RAG1 forms two major oligomers, namely dimers and tetramers. It is possible that both oligomeric forms of RAG1 are important for the formation of the V(D)J recombinase with RAG2, and for interaction with the RSS. For example, recent reports suggesting that the paired complex contains up to four RAG1 subunits support a physiological role for RAG1 tetramers in V(D)J recombination (27,39). However, alternate functions for the higher oligomeric forms of RAG1, specifically the tetramer, are also possible. These could include serving in a negative regulatory role as a reservoir of RAG1, which may be significant given the cell cycle regulation of RAG2 (40).
To demonstrate the relevance of the oligomeric forms of RAG1, we have shown that the core RAG1 tetramer preferentially forms at ionic strengths approaching physiological conditions. While the energetics of oligomerization were not obtained by MALLS-SEC, we can infer that the association energetics for dimer to tetramer is substantial, since the starting protein concentration before SEC was in the range of 1–5 µM for each experiment. Additionally, the tetrameric species is sufficiently stable to remain intact during SEC. The physiological concentration of RAG1 is unknown. However, immunofluorescence studies indicate that RAG1 and RAG2 are co-enriched within discrete regions of the nucleus (41; William Rodgers, personal communication), which would significantly increase local protein concentration and may induce formation of tetrameric RAG1. Furthermore, it is possible that association of RAG1 with DNA in vivo enhances tetramer formation, as indicated by the SEC studies. The effect of RAG2 on the oligomerization of RAG1 in the absence or presence of DNA has yet to be determined.
Overall, these results demonstrate that the self-association properties of core RAG1 are more complex than previously reported. It will be important to determine how the different domains of core RAG1 mediate these interactions. We have previously identified a C-terminal domain in core RAG1 that can efficiently dimerize (22). In addition, an N-terminal region within core RAG1 also is capable of oligomerization (P.De and K.K.Rodgers, unpublished results). The combination of these domains within the core region of RAG1 may contribute to the overall oligomerization properties of the intact core protein.
In addition, our characterization of core RAG1 demonstrated that this protein undergoes significant conformational changes even with a moderate change in ionic strength (from 0.2 to 0.5 M NaCl). It has been proposed that key steps in the recombination reaction are driven by induced conformational changes in RAG1, mediated either by RAG2 or by the RSS (23). The CD studies presented here demonstrate that core RAG1 gains α-helical structure upon binding to DNA, and that larger conformational changes occur upon association with the RSS as compared with non-sequence-specific DNA. DNA binding domains in RAG1 may contain relatively unstructured regions in the absence of DNA that form α-helical structure upon association with DNA.
Further evidence for the role of multiple RAG1 oligomers in V(D)J recombination was obtained by quantitative EMSA. Our results demonstrated that at least two RAG1/RAG2 oligomers can form complexes with a single RSS, and that these complexes differ in the number of core RAG1 subunits. Additionally, RAG2 significantly increased the affinity of RAG1 to the 12-RSS. Further experiments are required to address whether one or two RSS oligonucleotide duplexes are bound to protein in these complexes.
To begin to understand V(D)J recombination at the molecular level, it is important to know the stoichiometry of the RAG components in the recombinase at different stages of the reaction. The stoichiometry of the components in the single RSS complex, which contain both RAG proteins and a single RSS, has been disputed in the literature. Two studies identify only one RAG1:RAG2 complex bound to the RSS, which contained a dimer of RAG1 (23,26). However, this complex has been reported to consist of either a single subunit of RAG2 in one study (23), or two RAG2 subunits in a second study (26). Two recent studies reported that two RAG1:RAG2 complexes can bind to a single RSS, referred to as SC (stable complex) 1 and SC2 (27,28). SC1 was reported to contain one subunit of RAG2 with SC2 consisting of two RAG2 subunits, and the stoichiometry of RAG1 unchanged from SC1 to SC2. However, there was disagreement concerning the number of RAG1 subunits that both complexes contained, with Mundy et al. (27) reporting at least three core RAG1 subunits in SC1 and SC2, and Swanson (28) concluding both complexes contained a core RAG1 dimer. The two RAG1:RAG2 complexes we observe bound to the 12-RSS (Fig. 7) may be similar to complexes SC1 and SC2, however our data are most consistent with the two complexes containing differing numbers of RAG1 subunits.
In summary, this work gives insight into the self-association and conformational properties of core RAG1, and the potential role of the RAG1 oligomers in formation of the catalytically active complexes. In particular, we have focused on the initial assembly of the core RAG1 and core RAG2 proteins on a single RSS, which is sufficient to commence the DNA nicking step of V(D)J recombination (25). Additional studies are necessary to obtain information on the thermodynamics and kinetics of complex assembly, as well as further ascertaining the stoichiometry of the V(D)J recombinase components. This knowledge will be essential in further characterizing the molecular details of V(D)J recombination.
Acknowledgments
ACKNOWLEDGEMENTS
We would like to thank Bruce Baggenstoss for valuable technical assistance, and Drs David Schatz, Patrick Swanson, William Rodgers, Jialing Lin and Adam Zlotnick for helpful discussions. This work was supported by Research Project Grant RPG-00-032-01-CIM from the American Cancer Society, an Oklahoma Center for Advancement in Science and Technology award for project number HR02-008, and National Institutes of Health grant RR15577. L.J.G. is supported by a National Science Foundation Graduate Research Fellowship.
REFERENCES
- 1.Lewis S.M. (1994) The mechanism of V(D)J joining: lessons from molecular, immunological and comparative analyses. Adv. Immunol., 56, 27–150. [DOI] [PubMed] [Google Scholar]
- 2.Fugmann S.D., Lee,A.I., Shockett,P.E., Villey,I.J. and Schatz,D.G. (2000) The RAG proteins and V(D)J recombination: complexes, ends and transposition. Annu. Rev. Immunol., 18, 495–527. [DOI] [PubMed] [Google Scholar]
- 3.Gellert M. (2002) V(D)J recombination: RAG proteins, repair factors and regulation. Annu. Rev. Biochem., 71, 101–132. [DOI] [PubMed] [Google Scholar]
- 4.Schatz D.G., Oettinger,M.A. and Baltimore,D. (1989) The V(D)J recombination activating gene, RAG-1.Cell, 59, 1035–1048. [DOI] [PubMed] [Google Scholar]
- 5.Oettinger M.A., Schatz,D.G., Gorka,C. and Baltimore,D. (1990) RAG-1 and RAG-2, adjacent genes that synergistically activate V(D)J recombination. Science, 248, 1517–1523. [DOI] [PubMed] [Google Scholar]
- 6.McBlane J.F., van Gent,D.C., Ramsden,D.A., Romeo,C., Cuomo,C.A., Gellert,M. and Oettinger,M.A. (1995) Cleavage at a V(D)J recombination signal requires only RAG1 and RAG2 proteins and occurs in two steps. Cell, 83, 387–395. [DOI] [PubMed] [Google Scholar]
- 7.Ma Y., Pannicke,U., Schwarz,K. and Lieber,M.R. (2002) Hairpin opening and overhang processing by an Artemis/DNA-dependent protein kinase complex in nonhomologous end joining and V(D)J recombination. Cell, 108, 781–794. [DOI] [PubMed] [Google Scholar]
- 8.Agrawal A. and Schatz,D.G. (1997) RAG1 and RAG2 form a stable postcleavage synaptic complex with DNA containing signal ends in V(D)J recombination. Cell, 89, 43–53. [DOI] [PubMed] [Google Scholar]
- 9.Hiom K. and Gellert,M. (1998) Assembly of a 12/23 paired signal complex: a critical control point in V(D)J recombination. Mol. Cell, 1, 1011–1019. [DOI] [PubMed] [Google Scholar]
- 10.Silver D.P., Spanopoulou,E., Mulligan,R.C. and Baltimore,D. (1993) Dispensable sequence motifs in the RAG-1 and RAG-2 genes for plasmid V(D)J recombination. Proc. Natl Acad. Sci. USA, 90, 6100–6104. [DOI] [PMC free article] [PubMed] [Google Scholar]
- 11.Sadofsky M.J., Hesse,J.E., McBlane,J.F. and Gellert,M. (1993) Expression and V(D)J recombination activity of mutated RAG-1 proteins. Nucleic Acids Res., 21, 5644–5650. [DOI] [PMC free article] [PubMed] [Google Scholar]
- 12.Sadofsky M.J., Hesse,J.E. and Gellert,M. (1994) Definition of a core region of RAG-2 that is functional in V(D)J recombination. Nucleic Acids Res., 22, 1805–1809. [DOI] [PMC free article] [PubMed] [Google Scholar]
- 13.Cuomo C.A. and Oettinger,M.A. (1994) Analysis of regions of RAG-2 important for V(D)J recombination. Nucleic Acids Res., 22, 1810–1814. [DOI] [PMC free article] [PubMed] [Google Scholar]
- 14.Kim D.R., Dai,Y., Mundy,C.L., Yang,W. and Oettinger,M.A. (1999) Mutations of acidic residues in RAG1 define the active site of the V(D)J recombinase. Genes Dev., 13, 3070–3080. [DOI] [PMC free article] [PubMed] [Google Scholar]
- 15.Landree M.A., Wibbenmeyer,J.A. and Roth,D.B. (1999) Mutational analysis of RAG1 and RAG2 identifies three catalytic amino acids in RAG1 critical for both cleavage steps of V(D)J recombination. Genes Dev., 13, 3059–3069. [DOI] [PMC free article] [PubMed] [Google Scholar]
- 16.Fugmann S.D., Villey,I.J., Ptaszek,L.M. and Schatz,D.G. (2000) Identification of two catalytic residues in RAG1 that define a single active site within the RAG1/RAG2 protein complex. Mol. Cell, 5, 97–107. [DOI] [PubMed] [Google Scholar]
- 17.Haren L., Ton-Hoang,B. and Chandler,M. (1999) Integrating DNA: transposases and retroviral integrases. Annu. Rev. Microbiol., 53, 245–281. [DOI] [PubMed] [Google Scholar]
- 18.Akamatsu Y. and Oettinger,M.A. (1998) Distinct roles of RAG1 and RAG2 in binding the V(D)J recombination signal sequences. Mol. Cell. Biol., 18, 4670–4678. [DOI] [PMC free article] [PubMed] [Google Scholar]
- 19.Rodgers K.K., Villey,I.J., Ptaszek,L., Corbett,E., Schatz,D.G. and Coleman,J.E. (1999) A dimer of the lymphoid protein RAG1 recognizes the recombination signal sequence and the complex stably incorporates the high mobility group protein HMG2. Nucleic Acids Res., 27, 2938–2946. [DOI] [PMC free article] [PubMed] [Google Scholar]
- 20.Spanopoulou E., Zaitseva,F., Wang,F.-H., Santagata,S., Baltimore,D. and Panayotou,G. (1996) The homeodomain region of Rag-1 reveals the parallel mechanisms of bacterial and V(D)J recombination. Cell, 87, 263–276. [DOI] [PubMed] [Google Scholar]
- 21.Difilippantonio M.J., McMahan,C.J., Eastman,Q.M., Spanopoulou,E. and Schatz,D.G. (1996) RAG1 mediates signal sequence recognition and recruitment of RAG2 in V(D)J recombination. Cell, 87, 253–262. [DOI] [PubMed] [Google Scholar]
- 22.Arbuckle J.L., Fauss,L.J., Simpson,R., Ptaszek,L.M. and Rodgers,K.K. (2001) Identification of two topologically independent domains in RAG1 and their role in macromolecular interactions relevant to V(D)J recombination. J. Biol. Chem., 276, 37093–37101. [DOI] [PubMed] [Google Scholar]
- 23.Swanson P.C. and Desiderio,S. (1999) RAG-2 promotes heptamer occupancy by RAG-1 in the assembly of a V(D)J initiation complex. Mol. Cell. Biol., 19, 3674–3683. [DOI] [PMC free article] [PubMed] [Google Scholar]
- 24.Eastman Q.M., Villey,I.J. and Schatz,D.G. (1999) Detection of RAG protein-V(D)J recombination signal interactions near the site of DNA cleavage by UV cross-linking. Mol. Cell. Biol., 19, 3788–3797. [DOI] [PMC free article] [PubMed] [Google Scholar]
- 25.Yu K. and Lieber,M.R. (2000) The nicking step in V(D)J recombination is independent of synapsis: implications for the immune repertoire. Mol. Cell. Biol., 20, 7914–7921. [DOI] [PMC free article] [PubMed] [Google Scholar]
- 26.Bailin T., Mo,X. and Sadofsky,M.J. (1999) A RAG1 and RAG2 tetramer complex is active in cleavage in V(D)J recombination. Mol. Cell. Biol., 19, 4664–4671. [DOI] [PMC free article] [PubMed] [Google Scholar]
- 27.Mundy C.L., Patenge,N., Matthews,A.G.W. and Oettinger,M.A. (2002) Assembly of the RAG1/RAG2 synaptic complex. Mol. Cell. Biol., 22, 69–77. [DOI] [PMC free article] [PubMed] [Google Scholar]
- 28.Swanson P.C. (2002) A RAG-1/RAG-2 tetramer supports 12/23-regulated synapsis, cleavage and transposition of V(D)J recombination signals. Mol. Cell. Biol., 22, 7790–7801. [DOI] [PMC free article] [PubMed] [Google Scholar]
- 29.Wen J., Arakawa,T. and Philo,J.S. (1996) Size-exclusion chromatography with on-line light-scattering, absorbance and refractive index detectors for studying proteins and their interactions. Anal. Biochem., 240, 155–166. [DOI] [PubMed] [Google Scholar]
- 30.Rodgers K.K., Bu,Z., Fleming,K.G., Schatz,D.G., Engelman,D.M. and Coleman,J.E. (1996) A zinc-binding domain involved in the dimerization of RAG1. J. Mol. Biol., 260, 70–84. [DOI] [PubMed] [Google Scholar]
- 31.Sreerama N. and Woody,R.W. (2000) Estimation of protein secondary structure from CD spectra: Comparison of CONTIN, SELCON and CDSSTR methods with an expanded reference set. Anal. Biochem., 287, 252–260. [DOI] [PubMed] [Google Scholar]
- 32.Coleman J., Eaton,S., Merkel,G., Skalka,A.M. and Laue,T. (1999) Characterization of the self association of avian sarcoma virus integrase by analytical ultracentrifugation. J. Biol. Chem., 274, 32842–32846. [DOI] [PubMed] [Google Scholar]
- 33.Deprez E., Tauc,P., Leh,H., Mouscadet,J.F., Auclair,C. and Brochon,J.C. (2000) Oligomeric states of the HIV-1 integrase as measured by time-resolved fluorescence anisotropy. Biochemistry, 39, 9275–9284. [DOI] [PubMed] [Google Scholar]
- 34.Bellon S.F., Rodgers,K.K., Schatz,D.G., Coleman,J.E. and Steitz,T.A. (1997) Crystal structure of the RAG1 dimerization domain reveals multiple zinc-binding motifs including a novel zinc binuclear cluster. Nature Struct. Biol., 4, 586–591. [DOI] [PubMed] [Google Scholar]
- 35.Junker M., Rodgers,K.K. and Coleman,J.E. (1998) Zinc as a structural and folding element of proteins which interact with DNA. Inorg. Chim. Acta, 275–276, 481–492. [Google Scholar]
- 36.Pelton J.T. and McLean,L.R. (2000) Spectroscopic methods for analysis of protein secondary structure. Anal. Biochem., 277, 167–176. [DOI] [PubMed] [Google Scholar]
- 37.Ciubotaru M., Ptaszek,L.M., Baker,G.A., Baker,S.N., Bright,F.V. and Schatz,D.G. (2003) RAG1-DNA binding in V(D)J recombination: Specificity and DNA-induced conformational changes revealed by fluorescence and CD spectroscopy. J. Biol. Chem., 278, 5584–5596. [DOI] [PubMed] [Google Scholar]
- 38.Swanson P.C. and Desiderio,S. (1998) V(D)J recombination signal recognition: Distinct, overlapping DNA-protein contacts in complexes containing RAG1 with and without RAG2. Immunity, 9, 115–125. [DOI] [PubMed] [Google Scholar]
- 39.Landree M.A., Kale,S.B. and Roth,D.B. (2001) Functional organization of single and paired V(D)J cleavage complexes. Mol. Cell. Biol., 21, 4256–4264. [DOI] [PMC free article] [PubMed] [Google Scholar]
- 40.Lin W.-C. and Desiderio,S. (1994) Cell cycle regulation of V(D)J recombination-activating protein RAG-2. Proc. Natl Acad. Sci. USA, 91, 2733–2737. [DOI] [PMC free article] [PubMed] [Google Scholar]
- 41.Spanopoulou E., Cortes,P., Shih,C., Huang,C.M., Silver,D.P., Svec,P. and Baltimore,D. (1995) Localization, interaction and RNA binding properties of the V(D)J recombination-activating proteins RAG1 and RAG2. Immunity, 3, 715–726. [DOI] [PubMed] [Google Scholar]