Abstract
We present a conditional gene expression system in Saccharomyces cerevisiae which exploits direct RNA–metabolite interactions as a mechanism of genetic control. We inserted preselected tetracycline (tc) binding aptamers into the 5′-UTR of a GFP encoding mRNA. While aptamer insertion generally reduces GFP expression, one group of aptamers displayed an additional, up to 6-fold, decrease in fluorescence upon tc addition. Regulation is observed for aptamers inserted cap-proximal or near the start codon, but is more pronounced from the latter position. Increasing the thermodynamic stability of the aptamer augments regulation but reduces expression of GFP. Decreasing the stability leads to the opposite effect. We defined nucleotides which influence the regulatory properties of the aptamer. Exchanging a nucleotide probably involved in tc binding only influences regulation, while mutations at another position alter expression in the absence of tc, without affecting regulation. Thus, we have developed and characterized a regulatory system which is easy to establish and controlled by a non-toxic, small ligand with good cell permeability.
INTRODUCTION
The expression of individual genes is switched on and off in response to changes in the cellular environment. This is mainly carried out by regulatory proteins. Recent studies have shown that RNA also has the potential to act directly as a metabolic sensor. Single-stranded RNA can recognize and bind small molecular weight components. mRNAs encoding enzymes involved in flavin mononucleotide or thiamine pyrophosphate biosynthesis bind their effectors FMN and TPP, respectively, without any additional protein factors. In Gram-positive bacteria, regulation involves the binding of the effector to an RNA structure in the leader region of the cognate RNA forming an intrinsic termination signal (1). In addition, in Gram-negative bacteria, leader sequences form a potential stem–loop structure in response to the effector which overlaps with the start codon and/or the Shine–Dalgarno sequence. In all cases, binding of the ligand triggers formation of a structure which interferes with ribosome binding (2–4). Thus, low molecular weight component binding to specific segments of nascent RNA can modulate its structure and function resulting in regulation of transcription or translation.
We make use of the cardinal idea of both systems, namely to directly utilize a small molecule–RNA interaction for gene expression control without the help of additional protein factors to develop novel regulatory systems. RNA aptamers are the molecules of choice for setting up such regulatory circuits. They are small RNA molecules isolated by in vitro selection (SELEX) from combinatorial libraries to recognize a specific molecule with high specificity and affinity (5,6). Most aptamers do not contain structured ligand binding pockets in the free form. Ligand binding leads to increased rigidity (7). This complex may then mask regulatory sites in the mRNA or become an obstacle for ribosome binding or movement when the aptamer is placed into the non-coding region of a mRNA. As a result, gene expression would be switched off in the presence of the ligand but proceed in its absence. Werstuck and Green have demonstrated the proof for this principle by using RNA aptamers specific for a Hoechst dye as conformationally sensitive elements to control the expression of a reporter mRNA in CHO cells (8).
We have developed and characterized a regulatory system based on a direct small molecule–RNA interaction with the pharmacologically well-established inducer tetracycline (tc). Tc is widely used as a therapeutic agent of low toxicity (9). It is well characterized and enters nearly all cells, including passage of the blood–brain barrier and placenta. We have used aptamers selected for high affinity binding to tc (10) to construct such a regulatory system in yeast. We characterized the regulatory properties which differ dependent on aptamer structure and its insertion position. Furthermore we analyzed the influence of aptamer stability and the contribution of single nucleotides to the regulatory properties of the system.
MATERIALS AND METHODS
Plasmids and strains
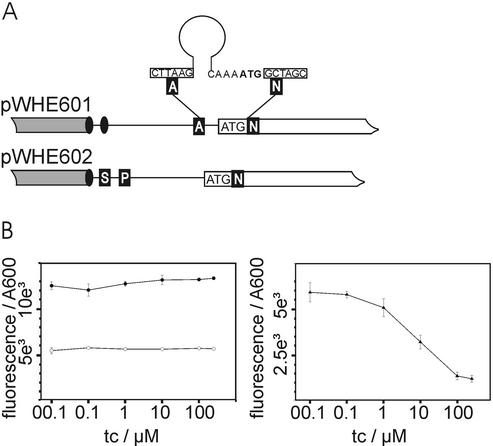
We used the yeast 2µ plasmid pVTU100 to constitutively express the gfp+ gene (11) from an adh promoter. To allow insertion of aptamer sequences at different positions of the 5′-UTR, unique restriction sites were introduced by PCR mutagenesis. We generated restriction sites for SacI and PacI directly behind the first of the two described transcriptional start sites, thereby deleting the second start site and obtaining a 5′ non-translated region with a defined length of 31 nt. The resulting vector was named pWHE602 and allows cap-proximal aptamer insertion. The vector pWHE601 contains a restriction site for AflII immediately before the start codon with a 5′-UTR length of 38 or 44 nt, respectively, depending on the two described transcriptional start sites. Both vectors carry a singular site for NheI directly behind the start codon. Figure 1A schematically displays the 5′-UTRs of both vectors. For aptamer insertion, the vectors were digested either with SacI/PacI or AflII/NheI. Respective restriction sites were attached to the aptamer sequences by PCR mutagenesis. We additionally introduced a start codon between the aptamer and the NheI restriction site which was cut out of the vector after AflII/NheI digestion (shown in Fig. 1A). For all experiments, Saccharomyces cerevisiae strain RS453a was used (12). Primer and vector sequences are available upon request.
Figure 1.
Expression systems to test the regulatory properties of RNA aptamers. (A) Schematic view of the 5′-UTR of the expression vectors pWHE601 and pWHE602. The 5′-UTR is shown as a black line, the adh promotor as a gray box and the gfp reading frame as an open box. Transcriptional start sites are displayed as black ovals. Unique restriction sites are indicated by white capital letters on a black background (A for AflII, N for NheI, S for SacI and P for PacI). The start codon is marked. (B) GFP fluorescence emission of yeast strains with the expression vectors pWHE601 (closed circle, left plot), pWHE602 (open circle, left plot) and pWHE601-AN32 (closed triangle, right plot). Each data point corresponds to a fluorescence value measured for a transformed yeast culture grown in broth with the denoted tc concentration. The fluorescence was normalized to the optical density (A600) of the culture.
GFP measurements
Yeast cells were transformed according to the protocol supplied with the frozen EASY yeast transformation II kit (Zymo Research, Orange, CA). Fluorescence measurements were performed in 96-well plates using a SpectraFluor Plus fluorescence reader (Tecan, Crailsheim). Yeast cells transformed with the respective constructs were grown at 30°C in minimal medium [0.7% w/v yeast nitrogen base, 2% w/v glucose, 12 µg ml–1 adenine, MEM amino acid (Gibco BRL)] with the respective concentrations of tc in a final volume of 200 µl. Fluorescence measurements were performed 24 and 48 h after inoculation using an excitation wavelength of 484 nm and an emission wavelength of 512 nm. Additionally, we determined the optical density to correlate the fluorescence to the cell number. For each construct, three wells inoculated with independent transformants were analyzed. The relative fluorescence of the constructs is calculated with the fluorescence of pWHE601 and pWHE602, respectively, set to 100%. The vector pVTU100 without the gfp+ gene was analyzed in parallel as a blank and its value subtracted from all data. All measurements were repeated at least twice.
RESULTS
Aptamers confer tc-dependent regulation in vivo
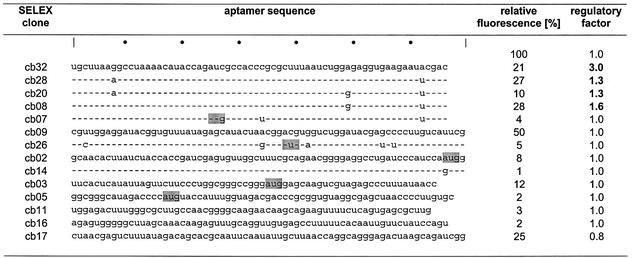
Fourteen aptamers isolated from a selection for high affinity binding to tc (shown in Table 1) (10) were inserted into the 5′-UTR of a constitutively expressed gfp gene located on the plasmid pWHE601 (Fig. 1A). For initial testing of their regulatory properties we inserted the aptamers directly upstream of the gfp start codon. The resulting plasmids were transformed into S.cerevisiae and GFP fluorescence was determined in the absence and presence of increasing concentrations of tc. Figure 1B shows the normalized GFP fluorescence upon addition of tc to yeast carrying either pWHE601, pWHE602 or pWHE601-AN32 (containing aptamer cb32). There was a negligible difference in fluorescence intensity in the absence or presence of tc for cells carrying pWHE601 or pWHE602. Thus, tc does not influence the GFP fluorescence itself. The aptamer containing vector pWHE601-AN32 expresses less GFP compared to the controls in the absence of tc, but GFP expression was further reduced with increasing concentrations of tc. A plateau was reached at 250 µM tc in the broth. Therefore, all other constructs were tested for aptamer-mediated GFP expression in the absence or presence of 250 µM tc (Table 1).
Table 1. Analysis of tc-binding aptamers for their ability to mediate regulated gene expression.
Fourteen aptamers selected for tc binding were tested for their ability to mediate regulation of translation (10). Their sequences are shown in column 2. Start codons present in the aptamer sequences are highlighted in gray. Fluorescence was measured after 24 h of incubation in the presence or absence (column 3, pWHE601 = 100%) of 250 µM tc. Column 4 shows the ratio of the fluorescence in the absence to that in the presence of 250 µM tc.
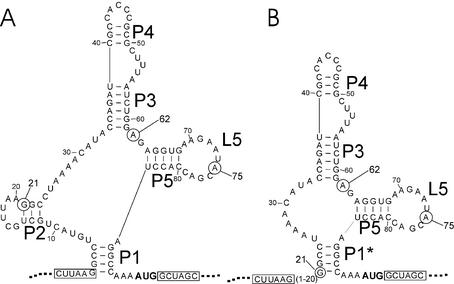
Insertion of an aptamer into the 5′-UTR led to a 2–100-fold reduced fluorescence in the absence of tc. Addition of tc led to a further 1.3–3-fold reduction of GFP expression after 24 h of incubation for the aptamers cb08, cb20, cb28 and cb32. The RNAs can adopt two possible conformations that are depicted in Figure 2 (10). The sequences differ only at position 21 (A or G), 62 (A or G) or 75 (A or U) (Table 1, positions marked in Fig. 2). The structure shown in Figure 2A correlates well with biochemical data published for candidate 28 (10). The other structure shown in Figure 2B lacks the stem P2 since an alternative stem P1* is formed by the nucleotides 21–24/86–89 instead of 2–5/86–89. Sequences flanking the aptamers (25 nt upstream and downstream from the insertion site) did not interfere with aptamer folding (structural calculations with mfold, http://mfold.burnet.edu.au; data not shown).
Figure 2.
Predicted secondary structure of tc-binding aptamer cb28. Secondary structure prediction of the aptamer cb32 using the program RNA structure 3.5. The resulting two most stable secondary structures are displayed in the cloning environment of the vector pWHE601 (A and B). Stem regions are labeled P1–P5. Loop 5 is marked L5. The nucleotide positions 21, 62 and 75 are circled. The unique restriction sites used for aptamer insertion are boxed. The start codon is shown in bold letters.
The regulatory properties of aptamers are position- and structure-dependent
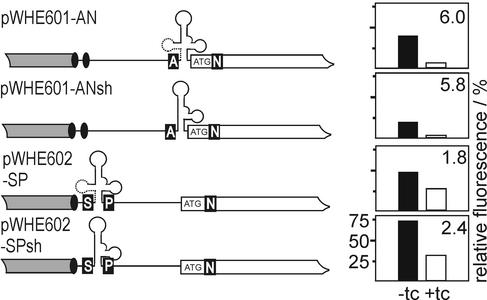
To study the position- and structure-dependence of aptamer-mediated regulation, we placed the most active aptamer cb32 next to the start codon (pWHE601-AN and pWHE601-ANsh) or directly behind the cap site (pWHE602-SP and pWHE602-SPsh) (Fig. 3). We also asked if an aptamer forced to form the shorter structure by deleting nucleotides 1–20 of aptamer cb32 would be active in regulation (Fig. 2B without nucleotides 1–20, designated sh in Fig. 3). Yeast strains transformed with the constructs shown in Figure 3 were analyzed for GFP expression in the presence and absence of tc after 48 h of incubation. The results are summarized in Table 2 and are displayed in the plots next to the respective constructs in Figure 3.
Figure 3.
Structure and position dependence of the regulatory active aptamer. Shown is a schematic view of the 5′-UTR of the GFP encoding mRNA indicated as a black line, the adh promotor is shown as gray box and the gfp reading frame as an open box. Transcriptional start sites are displayed as black ovals. Unique restriction sites are represented by white capital letters on a black background (A for AflII, N for NheI, S for SacI and P for PacI). The start codon is shown. The aptamers are drawn in the respective insertion sites. The first 20 nt of the aptamer are displayed as dotted lines and are deleted in the short variant. The plots shown on the right side of the constructs display the relative fluorescence intensities. The scaling is shown in the lowest plot only. The closed and open bars correspond to fluorescence in the absence and presence of 250 µM tc, respectively, with the fluorescence emission of GFP expressed by the vectors pWHE601 and pWHE602 set to 100%. The numbers in the top right corner of the plots are the regulation factors determined as the ratio of fluorescence without and with tc.
Table 2. Influence of insertion site, UTR length and aptamer stability on regulation.
| Construct | Relative fluorescence (%) | Relative fluorescence (%) | Regulatory factor |
|---|---|---|---|
| No tc | 250 µM tc | ||
| pWHE 601 | 100 | 100 | 1.0 |
| pWHE 602 | 100 | 105 | 1.0 |
| pWHE 601 AN | 40.0 ± 1.8 | 6.6 ± 0.6 | 6.0 |
| pWHE 601 ANsh | 20.0 ± 2.0 | 3.5 ± 0.5 | 5.8 |
| pWHE 602 SP | 47.9 ± 1.9 | 26.6 ± 0.3 | 1.8 |
| pWHE 602 SPsh | 74.8 ± 2.4 | 31.3 ± 2.0 | 2.4 |
| pWHE 602 SPsh_stab | 49.7 ± 2.6 | 13.8 ± 1.3 | 3.6 |
| pWHE 601 ANsh_dest | 46.0 ± 2.7 | 12.1 ± 0.8 | 3.8 |
Regulatory properties of cb32 were analyzed with respect to different insertion sites, UTR lengths and aptamer stabilities. Column 1 shows the expression vectors (see also Figs 3–5). Fluorescence was measured 48 h after induction in the presence (column 3) and absence (column 2) of 250 µM tc. The fluorescence of GFP expressed by the vector pWHE601 or pWHE602 was set to 100%, respectively. Column 4 shows the efficiency of regulation given as the ratios of respective values in columns 2 and 3.
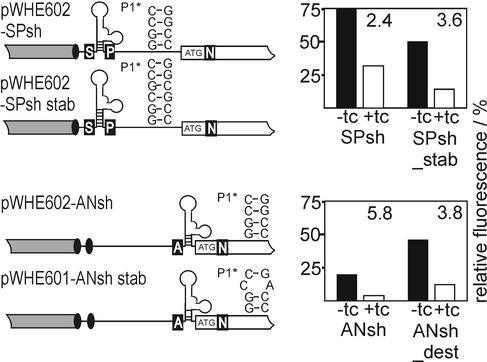
Insertion of cb32 into the 5′-UTR results for all constructs in lower GFP expression in the absence of tc. Expression is most strongly reduced for the short variant inserted next to the start codon (Fig. 2B), followed by the full-length aptamer in the same position. A smaller effect is seen with the full-length aptamer next to the cap site, while the smallest effect is found with the shortened aptamer next to the cap site. Tc-dependent regulation is observed in all cases. It is most efficient near the start codon with ∼6-fold repression, followed by the short sequence variant near the cap site. Regulation is least efficient when the full-length aptamer is located cap-proximal.
Thus, the short construct is sufficient to mediate regulation. We observe that high regulation efficiency (near the start codon, 6/5.8-fold) is accompanied by a stronger reduction of expression in the absence of the effector whereas the less active constructs (near the cap site, 1.8/2.4-fold) display a lower impairment of expression.
Exploring the influence of aptamer stability on regulation
To analyze if the stability of the aptamer has an impact on the regulatory properties we created two new constructs. In pWHE602-SPsh, we stabilized the aptamer by increasing the length of stem P1* by two additional GC base pairs (pWHE602-SPsh_stab). Furthermore, in pWHE601-ANsh_ dest the stem P1* was destabilized by introducing a G→A exchange. The constructs, the sequences of the respective stems P1* and their tc-dependent regulation are shown in Figure 4. The GFP expression data are included in Table 2.
Figure 4.
Influence of aptamer stability on regulation. Shown is a schematic view of the different 5′-UTRs. Denotations are as in Figure 3.
The stabilization of stem P1* of the aptamer by two additional base pairs (Fig. 4) leads to a lower GFP expression, the destabilization due to the CA mismatch results in increased expression. We observe the opposite effect for regulation. The stabilization leads to improved regulation (3.6- instead of 2.4-fold), whereas destabilization reduces regulation from 5.8- to 3.8-fold. Thus, we find a correlation between stability and regulatory properties. A change in stem P1* stability leading to increased GFP expression in the absence of tc is always accompanied by a loss of regulation efficiency and vice versa.
Exploring the sequence difference of the aptamers
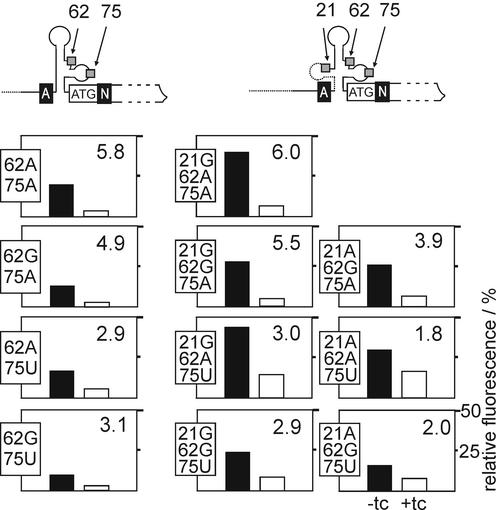
Although the sequences of the aptamers cb08, cb20, cb28 and cb32 differ only at three positions (see Table 1), they show large differences in their regulatory properties. This prompted us to investigate the influence of all possible combinations of A, G and U at these positions to analyze their role. Since the shortened aptamer has an invariant G at position 21 only the combinations at the remaining two positions were constructed. The GFP expression data are shown in Table 3 and displayed in Figure 5. None of the newly constructed variants resulted in an aptamer showing improved regulation compared with the already analyzed ones, however, the contribution of the nucleotide at each of these positions becomes apparent from the results. The A→G exchange at position 62 always leads to reduced expression in the absence of ligand (compare 62A75A with 62G75A and 62A75U with 62G75U). On the other hand, the nucleotide at position 75 is important for the efficiency of regulation in the presence of ligand and has no effect in the absence of tc. The short aptamer variants 62A75A and 62G75A show regulation factors of 5.8- and 4.9-fold, respectively, which is clearly more efficient than the 62A75U and 62G75U variants with regulation factors of 2.9- and 3.1-fold, respectively. The same tendency is observed for the long aptamer variants (compare construct 21G62A75A with 21G62A75U, 21G62G75A with 21G62G75U and 21A62G75A with 21A62G75U in Fig. 5). Aptamers with an A at position 21 show less efficient regulation and lower GFP expression without ligand than those with a G. Constructs with long aptamers generally show higher GFP expression in the absence of ligand than constructs with short ones.
Table 3. Mutational analysis of the aptamer.
| pWHE 602 derivative | Sequence variantions | SELEX clone | Relative fluorescence (%) | Relative fluorescence (%) | Regulatory factor |
|---|---|---|---|---|---|
| |
|
|
No tc |
250 µM tc |
|
| 100 | 105 | 1.0 | |||
| ANsh | 21G 62A 75A | 20 ± 2.0 | 3.5 ± 0.5 | 5.8 | |
| AN | 21G 62A 75A | cb32 | 40 ± 1.8 | 6.6 ± 0.6 | 6.0 |
| ANsh | 21G 62A 75U | 17 ± 0.1 | 5.8 ± 0.1 | 2.9 | |
| AN | 21G 62A 75U | 44 ± 4.3 | 14.7 ± 2.2 | 3.0 | |
| AN | 21A 62A 75U | cb28 | 30 ± 2.1 | 16.7 ± 0.5 | 1.8 |
| ANsh | 21G 62G 75A | 13 ± 2.0 | 2.6 ± 0.1 | 4.9 | |
| AN | 21G 62G 75A | 28 ± 1.5 | 5.1 ± 0.3 | 5.5 | |
| AN | 21A 62G 75A | 26 ± 0.9 | 6.7 ± 0.2 | 3.9 | |
| ANsh | 21G 62G 75U | 10 ± 0.9 | 3.2 ± 0.3 | 3.1 | |
| AN | 21G 62G 75U | cb08 | 24 ± 2.2 | 8.3 ± 1.1 | 2.9 |
| AN | 21A 62G 75U | cb20 | 15 ± 2.1 | 7.5 ± 0.2 | 2.0 |
Column 1 shows if a short (ANsh) or long (AN) variant of the respective aptamer was used. Column 2 shows the nucleotides at the indicated positions. Clones found by SELEX are indicated with their designation in column 3. Fluorescence was measured after 48 h of incubation in the presence (column 5) and absence (column 4) of 250 µM tc. The fluorescence emission of GFP expressed by the vector pWHE601 was set to 100%. Column 6 shows the efficiency of regulation given as the ratios of respective values in columns 4 and 5.
Figure 5.
Mutational analysis of the aptamer. The upper part of the figure shows a schematic view of the 5′-UTR of the pWHE602 variants. A section of the 5′-UTR with the inserted aptamer is shown as a black line and the gfp reporter gene as an open box. Unique restriction sites are represented by white capital letters on a black background (A for AflII and N for NheI). The start codon is shown. The nucleotide positions 21, 62 and 75 are marked by small gray boxes. The plots in the lower part present the relative fluorescence intensities of GFP expressed by the mutants. The nucleotide exchanges in each mutant are shown on the left side of each plot. The left column of plots corresponds to the shortened version of the aptamer whereas the two columns on the right belong to the long aptamer. The scaling shown for the bottom right plot is used for all plots. The closed and open bars correspond to fluorescence in the absence and presence of 250 µM tc, respectively, with the fluorescence emission of GFP expressed by the vector pWHE602 set to 100%. The numbers in the top right corner of each plot are the respective regulation factors determined as the ratio of fluorescence without and with tc.
Taken together, the nucleotide at position 62 affects translation in the absence of ligand, the one at position 75 affects expression in the presence of ligand and the nucleotide at position 21 affects both.
DISCUSSION
We have shown that aptamers isolated by SELEX for high affinity binding to tc can be used as a molecular switch to regulate gene expression at the level of translation in yeast. Detailed analysis of an active aptamer shows remarkable differences in its regulatory properties depending on the site of insertion, potential to form secondary structure, thermodynamic stability and sequence variations.
Insertion of an aptamer into the non-translated region generally led to a reduction of GFP expression without tc. This could be due to the presence of structural elements in the aptamer, as was shown in vitro by DMS protection experiments for aptamer cb28 (10). Additionally, the introduction of an AUG into the 5′-UTR by the aptamer sequence may also interfere with GFP synthesis (compare cb07 in Table 1 with other variants) (13). The influence of a preformed aptamer structure on GFP expression is dependent on the insertion site. Translational repression is higher when the aptamer is inserted near the start codon as compared to the cap. This is in agreement with previous studies where single hairpins were inserted into the 5′-UTR of cat and luc reporter genes in S.cerevisiae. Translational inhibition was generally less in the constructs with a cap-proximal hairpin (14). Unlike yeast, results obtained with mammalian cells show that structures inhibit translation mostly when located close to the cap. Structure formation in this position prevents mRNA from binding to the 40S ribosome (13). In contrast, the higher sensitivity of the yeast system for cap-distal secondary structures might be due to a less stable scanning preinitiation complex (14).
The ability of a given structural element in the 5′-UTR to impede translational initiation is directly proportional to its free energy of formation (13,15). We have demonstrated this for the shortened aptamer by changing the stability of its stem P1*.
Our data show that the efficiency of translation in the absence of tc and also its regulation can be altered depending on the site of insertion and aptamer stability. Interestingly, there is an interdependence of GFP expression and regulation efficiency. Constructs with high regulation efficiencies show the lowest expression in the absence of tc and vice versa. We propose that a preformed structure is involved in tc binding. This complex may then serve as a block for translation initiation. If the stability of the aptamer is high we observe stronger translational regulation. The regulation efficiency may thus be a function of the stability of this complex in vivo.
The single nucleotide at position 75 is important for regulation only. In contrast to the results discussed above, there is no interdependence between translation efficiency and tc regulation. Position 75 is located in the loop L5, which is proposed to take part in tc binding (10). Nucleotides at positions 69, 70 and 76 in this loop show tc-dependent changes in their DMS modification patterns and those at positions 69–76 are protected against lead cleavage in the presence of tc. Furthermore, the guanine at position 71 was cross-linked to tc by UV (10). These data indicate that the loop region may be part of the ligand-binding site. On the other hand, the nucleotide at position 62 leads to reduced GFP fluorescence in the absence of tc, but has no influence on regulation. Therefore, a G at position 62 seems to influence aptamer stability.
Taken together, we have developed a conditional gene expression system in which we use RNA aptamers as regulatory elements for tc-dependent control of translation. The facile application as well the favorable properties of our small molecule ligand tc hold the potential to be a useful tool for studies of translational regulation or pharmacological targeting aimed at eukaryotic translation.
Acknowledgments
ACKNOWLEDGEMENTS
We thank Dr U. Hoja for providing plasmid pVTU100. This work was supported by the Volkswagenstiftung, the Fonds der Chemischen Industrie and European Community grant FMRX-CT97-0154 (to R.S.). S.H. was a recipient of a personal grant from the Boehringer Ingelheim Fonds.
REFERENCES
- 1.Mironov A.S., Gusarov,I., Rafikov,R., Lopez,L.E., Shatalin,K., Kreneva,R.A., Perumov,D.A. and Nudler,E. (2002) Sensing small molecules by nascent RNA. A mechanism to control transcription in bacteria. Cell, 111, 747–756. [DOI] [PubMed] [Google Scholar]
- 2.Winkler W.C., Cohen-Chalamish,S. and Breaker,R.R. (2002) An mRNA structure that controls gene expression by binding FMN. Proc. Natl Acad. Sci. USA, 99, 15908–15913. [DOI] [PMC free article] [PubMed] [Google Scholar]
- 3.Winkler W., Nahvi,A. and Breaker,R.R. (2002) Thiamine derivatives bind messenger RNAs directly to regulate bacterial gene expression. Nature, 419, 952–956. [DOI] [PubMed] [Google Scholar]
- 4.Nahvi A., Sudarsan,N., Ebert,M.S., Zou,X., Brown,K.L. and Breaker,R.R. (2002) Genetic control by a metabolite binding mRNA. Chem. Biol., 9, 1043–1049. [DOI] [PubMed] [Google Scholar]
- 5.Ellington A.D. and Szostak,J.W. (1990) In vitro selection of RNA molecules that bind specific ligands. Nature, 346, 818–822. [DOI] [PubMed] [Google Scholar]
- 6.Gold L., Polisky,B., Uhlenbeck,O. and Yarus,M. (1995) Diversity of oligonucleotide functions. Annu. Rev. Biochem., 64, 763–797. [DOI] [PubMed] [Google Scholar]
- 7.Hermann T. and Patel,D.J. (2000) Adaptive recognition by nucleic acid aptamers. Science, 287, 820–825. [DOI] [PubMed] [Google Scholar]
- 8.Werstuck G. and Green,M.R. (1998) Controlling gene expression in living cells through small molecule-RNA interactions. Science, 282, 296–298. [DOI] [PubMed] [Google Scholar]
- 9.Chopra I. and Roberts,M. (2001) Tetracycline antibiotics: mode of action, applications, molecular biology and epidemiology of bacterial resistance. Microbiol. Mol. Biol. Rev., 65, 232–260. [DOI] [PMC free article] [PubMed] [Google Scholar]
- 10.Berens C., Thain,A. and Schroeder,R. (2001) A tetracycline-binding RNA aptamer. Bioorg. Med. Chem., 9, 2549–2556. [DOI] [PubMed] [Google Scholar]
- 11.Scholz O., Thiel,A., Hillen,W. and Niederweis,M. (2000) Quantitative analysis of gene expression with an improved green fluorescent protein. Eur. J. Biochem., 267, 1565–1570. [DOI] [PubMed] [Google Scholar]
- 12.Sauer N. and Stadler,R. (1993) A sink-specific H+/monosaccharide co-transporter from Nicotiana tabacum: cloning and heterologous expression in baker’s yeast. Plant J., 4, 601–610. [DOI] [PubMed] [Google Scholar]
- 13.Kozak M. (1989) Context effects and inefficient initiation at non-AUG codons in eucaryotic cell-free translation systems. Mol. Cell. Biol., 9, 5073–5080. [DOI] [PMC free article] [PubMed] [Google Scholar]
- 14.Koloteva N., Müller,P.P. and McCarthy,J.E. (1997) The position dependence of translational regulation via RNA-RNA and RNA-protein interactions in the 5′-untranslated region of eukaryotic mRNA is a function of the thermodynamic competence of 40 S ribosomes in translational initiation. J. Biol. Chem., 272, 16531–16539. [DOI] [PubMed] [Google Scholar]
- 15.Baim S.B. and Sherman,F. (1988) mRNA structures influencing translation in the yeast Saccharomyces cerevisiae. Mol. Cell. Biol., 8, 1591–1601. [DOI] [PMC free article] [PubMed] [Google Scholar]


