Abstract
It is an outstanding problem to clarify how the RNA sequence is related to its structure and biological functions. We developed a simplified definition of a metric for tree representation of RNA secondary structures and analyzed the conformational energy landscapes of human spliceosomal snRNAs. We discuss the structural properties of the biological sequence by calculating the conformational energy landscapes based on the structural distance between each of the pairs in the set of suboptimal structures. The new index value is introduced for estimating the shapes of distribution patterns in conformational energy landscapes. We apply our method to the five human snRNAs and show that U1 snRNA has a multi-valley profile of the landscape, whereas the landscapes of the other four snRNAs have one steep valley. This result reflects different biological functions of these snRNAs in the pre-mRNA splicing process. The results of analyzing tRNAs and rRNAs show that the conformational energy landscapes of these sequences have multi-valley profiles.
INTRODUCTION
In the Human Genome Project, sequences for a large number of genes that code for RNA molecules have been identified, such as mRNAs, rRNAs, tRNAs, snRNAs (U1, U2, …) and others. However, it is still unclear how the sequence data of these molecules relates to these structures and their biological functions. We focus on the bioinformatics analysis of structures obtained from a biological sequence and random sequences by developing a simplified metric of the RNA secondary structures using a tree representation.
Several methods that can compare RNA secondary structures have been proposed. RNA secondary structures can be represented as trees (1,2). The tree edit distance can be defined as the minimum number of operations that can transform one RNA secondary structure into another (3). An alternative simple method for comparing RNA secondary structures encodes secondary structures as linear strings with parentheses representing the base pairs (4,5).
Our comparison method is between these two kinds of approaches. In our representation, we define a tree in which the nodes are the loops and in which the base paired regions are the arcs of the tree. We translate the tree structure into a linear string of symbols. The two linear strings are aligned using a dynamic programming algorithm, and the distance between the two different structures is calculated by replacement scores between the symbols used. We call this metric the tree representation (TR) distance.
With this method, we analyze and compare the RNA secondary structure from a biological sequence and shuffled sequences that have the same composition as the original one. As a biological sequence, we use the snRNAs of the ‘U’ family. We focused on the snRNAs as the target of our method because a lot of biochemical studies have been done on them. In addition, these indispensable RNA molecules have very important roles involved in the pre-mRNA splicing reactions and also they are one of the non-coding RNAs (rRNA, tRNA, snRNA) whose functions could be associated with their known structures.
We define a new index called the Valley Index to estimate the valley profile in the structural space for a RNA sequence with a set of suboptimal structures. This new defined index provides a method to distinguish some types of topologies of conformational energy landscapes. We calculate the Valley Index for the conformational energy landscape of the sampling set of the RNA (sub)optimal structures and compare it between the biological structure and the randomly generated structure of the shuffled sequence. Such analysis may be of value in understanding how biological RNAs are different from random RNA sequences (6).
With this index, we did a histogram analysis of the set of sampling structures for the five human snRNAs (U1, U2, U4, U5 and U6). The resulting distribution patterns are so distinctive that we can point out some structural features in these RNA molecules.
MATERIALS AND METHODS
We applied our algorithm to structured human RNA genes such as U1 snRNA, U2 snRNA, etc. The RNA sequences used are shown in Table 1. All the sequences used are obtained from GenBank with the accession numbers listed in Table 1.
Table 1. Free energy and base length of snRNAs.
| snRNA | Base length (nt) | Minimum ΔG (kcal/mol) | GenBank no. | Reference |
|---|---|---|---|---|
| U1 | 164 | –55.8 | J00318 | (25) |
| U2 | 187 | –63.0 | M19204 | (26) |
| U4 | 144 | –46.9 | X59361 | (27) |
| U5 | 115 | –27.7 | X04293 | (28) |
| U6 | 106 | –26.6 | M14486 | (29) |
All the sequence data were obtained from GenBank with the accession number listed in the table.
It has been known that traditional calculations of suboptimal structures often result in erroneous predictions when sequence lengths are long due to the lack of consideration of entropic effects (7). In this work, we focus on short RNA sequences (of about 100 bases in length). Although our approach might be dependent on the predicting algorithm, structures calculation of such short sequences can produce a better set of suboptimal structures.
The minimum free energy and (sub)optimal structures are calculated using Zuker’s MFOLD version 3.0 and PlotFold in the GCG package (8,9). The Vienna package is also a frequently used program, which can calculate optimal structures by evaluating the partition function (10). We have used the same approach on the optimal structure using the Vienna package, and found that it gave almost the same results as the MFOLD approach. In principle, one can obtain similar sets of data from either MFOLD or the Vienna package. However, since MFOLD produces an easily manageable subset of data, we chose to focus on the MFOLD results rather than the Vienna package.
Our programs for this approach are written in C++ and Perl. We run the program on the CRAY T94 of the Institute of Medical Science (IMS), University of Tokyo.
The MFOLD program requires two parameters: the folding temperature T and the energy increment Eth at which to calculate secondary structures as suboptimal structures. The parameters used in our method are T = 37°C and Eth = 5 kcal/mol.
Human U1 snRNA is known to fold into a secondary structure with four stem–loops, I, II, III and IV (11). The predicted optimal structure of U1 snRNA including these four stem–loops is in a good agreement with the experimentally known structure. Human U2 snRNA forms five stem–loops, I, IIa, IIb, III and IV (11). In this case, four out of these five stem–loops can be correctly predicted by MFOLD. Some well-known motifs in other snRNAs like the U5 loop or a stem–loop in U6 RNA can also be predicted by the program with good accuracy (12,13).
The process of our approach is as follows.
Generating the (sub)optimal structures. With folding programs, we make a set of secondary structures S ={s1, …, sn}, which have folding free energies that differ by no more than a certain threshold value from the computed minimum free energy of the optimal structure. The set of structures Soriginal from the biological snRNA and Srandom from the shuffled RNA with the same composition as the original sequence are obtained in this step.
Structure comparison using our metric based on tree representation. The structure distance is calculated for all pairs in S. We carried out this process with the new metric of RNA structures based on the tree representation.
Conformational energy landscape. We define a conformational energy landscape by plotting free energies and structural distances between two pairs in S. The Valley Index is newly defined to classify profiles of the landscape with respect to the steepness of the funnels around the possible optimal structures.
Histogram analysis. Histograms are calculated to compare the conformational energy landscape of each snRNA and that of shuffled RNA.
TR distance
We define the new metric of RNA structures based on a tree representation, which is called the TR distance.
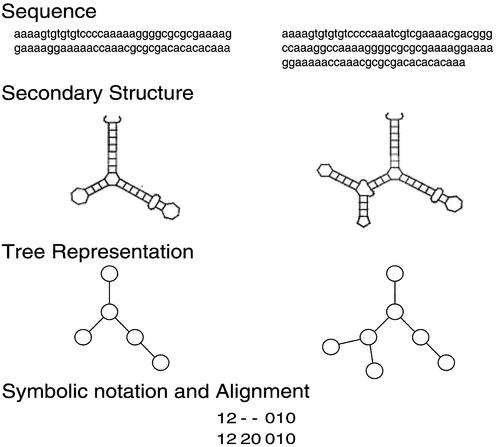
In this metric, secondary structures of RNA are represented by labeled trees (Fig. 1). Each tree node represents a loop of the secondary structure, and the node label is assigned as the number of branches from the node. The topology of the tree-represented RNA structures can be encoded into linear strings of node labels using a depth-first traversal of the nodes. The comparison of two trees A and B is accomplished by obtaining the alignment of the linear string ai for A and bj for B, where i and j represent the position of each symbol of the linear string.
Figure 1.
The structure distance is calculated based on the tree representation of RNA structures. Each tree node represents a loop of the secondary structure, and the node label is assigned as the number of branches from the node. The topology of tree represented RNA structures can be encoded into linear strings of node labels using a depth-first traversal of the nodes.
The goal is to find an optimal alignment of two strings with respect to a biologically and mathematically justified cost measure. Costs of the operation for pairwise alignment are defined as follows.
cost(ai,bj) = |ai – bj|(match or mismatch)
cost(ai,–) = cost(–,bj) = 1(one insertion)
cost(–,–) = 0(two insertions)
This cost function satisfies the following constraints as a metric.
cost(–,–) = 0
cost(a,b) = cost(b,a)
cost(a,c) ≤ cost(a,b) + cost(b,c)
The TR distance is defined as the minimum cost of the operations necessary to transform ai into bj.
Definition 1. TR distance
dTR(i,j) = min{dTR(i – 1,j – 1) + cost(ai,bj),
dTR(i,j – 1) + cost(–,bj),
dTR(i – 1,j) + cost(ai,–)}
As compared with the tree edit distance (14), our simplified method cannot fully consider the topological features of the tree representations. However, we have examined these metrics and have found that the TR distance yields almost no difference in the results of our analysis.
The application of this tree representation-based metric is limited to pure secondary structures. Therefore, it cannot represent tertiary structural interactions such as pseudoknots. Most works on modeling RNA structures have been limited to secondary structures that do not contain pseudoknots because problems of these tertiary structural interactions could become computationally very hard. Rivas and Eddy present an algorithm that predicts the secondary structures of an RNA that allows certain kinds of pseudoknots (15). Recently a grammatical modeling method has been proposed for representing secondary structures of RNAs including pseudoknot structures (16). However, there still remain problems in the computational complexity to predict RNA secondary structures containing pseudoknots (17).
Valley index
We introduce the index value called the Valley Index to evaluate the steepness of funnels in the conformational energy landscapes. The Valley Index is defined by considering a weighted average structural distance for a given sequence with suboptimal structures S ={s1, …, sn}.
Definition 2. Valley Index
VI = [∑i,j ∈ SdTR(i,j)·w(i)·w(j)]/[ ∑i,j ∈ Sw(i)·w(j)]
where S ={s1, …, sn} is a set of secondary structures, which have folding free energies that differ by an energy threshold value Eth from the optimal structure.
The Bolzmann factor w(i) is defined as follows.
w(i) = exp{–[E(i) – Eoptimal]/RT}
where E(i) is the free energy of structure i. The Valley Index calculates the average value of TR distances over all possible pairs of optimal and suboptimal structures. We just use the difference of folding free energies as the energy distance instead of taking into account the energy barrier in the transition path between two structures. This defined index is thought to reflect the number of valleys in the conformational energy landscape. The Valley Index of the uni-valley type of RNA is considered to have a rather small value compared to the other RNA.
In our method, we used an energy threshold value of Eth = 5 kcal/mol for calculating the set of secondary structures S. We have demonstrated our analysis with a bigger cut-off value (Eth = 10 kcal/mol), and it was found that the whole approach is not so much dependent on the cut-off value. This may be because structures of higher free energies have only a small influence on the calculation of the Valley Index.
RESULTS
Conformational energy landscape
To describe the topographic features of the structural distribution, we plot the folding free energy versus the TR distance between one structure and the optimal structure. This process allows us to see the lower dimensional conformational landscape of RNA structures.
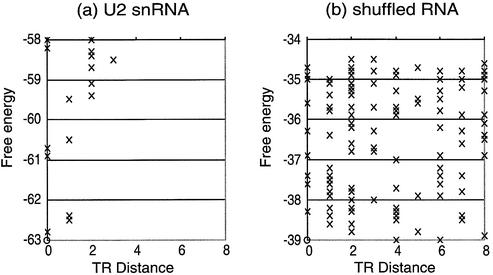
In Figure 2, we show the conformational energy landscapes of natural U2 snRNA and typical shuffled U2 snRNA. This figure implies that natural RNAs are likely to have uni-valley profiles. In contrast, randomly generated RNAs have non-distinctive profiles. The Valley Indices of natural U2 snRNA and shuffled U2 snRNA, whose profiles are shown in Figure 2, are 0.55 and 4.1, respectively.
Figure 2.
Conformational energy landscapes. (a) U2 snRNA, (b) randomly generated RNA which has a shuffled sequence of U2 snRNA. The circles stand for the optimal structures and crosses stand for the suboptimal. The horizontal axis is the TR distance and the vertical axis is the free energy.
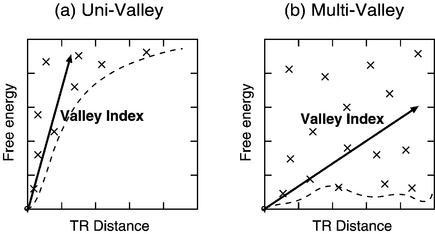
In Figure 3, we show the two typical patterns of suboptimal folding free energies distributed in the structure space around the optimal structure: the uni-valley profile and the multi-valley profile. The shallowness of the funnel in the conformational energy landscapes suggests multiple stable structures of the RNA, which may suggest some property related to its biological functions (18).
Figure 3.
Two patterns of conformational energy landscapes. The shape of the valley in each landscape is represented by a dashed curve. (a) Uni-valley and (b) multi-valley profiles. The Valley Index of case (a) is lower than that of (b).
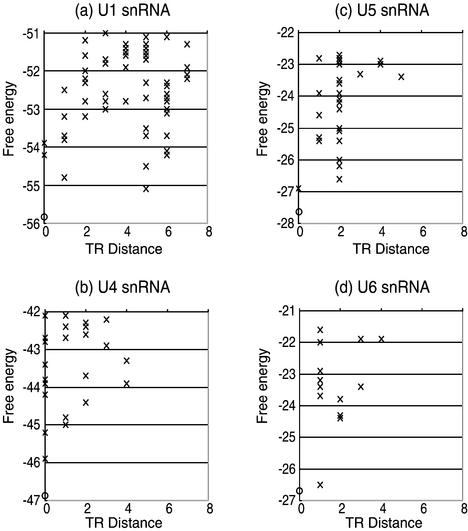
The calculated results of conformational energy landscapes for the other four human snRNA (U1, U4, U5 and U6) are shown in Figure 4. This figure suggests that some unique topographic features can be found for U1 snRNA while other snRNAs have uni-valley profiles.
Figure 4.
Conformational energy landscapes for (a) U1 snRNA, (b) U4 snRNA, (c) U5 snRNA and (d) U6 snRNA. The circles stand for the optimal structures and crosses stand for the suboptimal. The horizontal axis is the TR distance and the vertical axis is the free energy.
Histogram analysis
Our approach has indicated that biological snRNA structures show different patterns in conformational energy landscapes when compared with random RNA structures of the same A, T, G, C components. The histogram analysis was carried out for the statistical comparison of shapes in landscapes between the biological RNA and the randomly generated RNA.
We calculated the Valley Index corresponding to 500 random RNAs, which have shuffled sequences of human snRNA (U1, U2, U4, U5 and U6). We then applied the Kolmogorov–Smirnov test to determine whether the Valley Index follows a normal distribution. The Kolmogorov– Smirnov test accepts the normality hypothesis for the case of log-normal data at the significance level of 0.05 for all cases of snRNA.
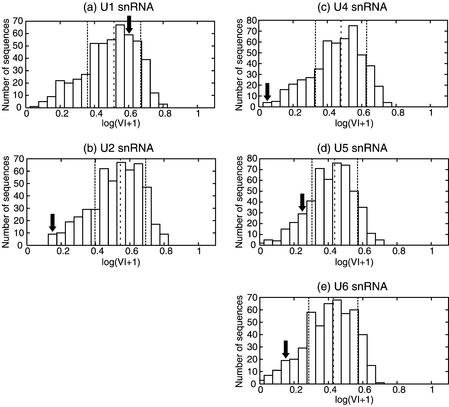
Figure 5 shows the histograms of the natural logarithm of the Valley Index for a collection of 500 RNAs generated from each of the natural snRNAs. The position of the original RNA is represented by an arrow in each histogram.
Figure 5.
Histogram of Valley Index for a sample set of shuffled sequences of human snRNA. (a) U1 snRNA, (b) U2 snRNA, (c) U4 snRNA, (d) U5 snRNA and (e) U6 snRNA. The arrows stand for the Valley Index of the original sequence. The dashed lines represent the average values and the dotted lines show the standard deviations for each distribution.
As observed in Figure 5, the four biological snRNAs (U2, U4, U5 and U6) have smaller values for the Valley Index than the random sequences of the same base composition at the 0.05 significance level (U2, U4 and U6) and the 0.30 significance level (U5). While the natural snRNAs show smaller Valley Indices than their distributions of suboptimal structures show in the uni-valley profiles, the biological U1 snRNA has no distinguishable Valley Index compared to the random sequences.
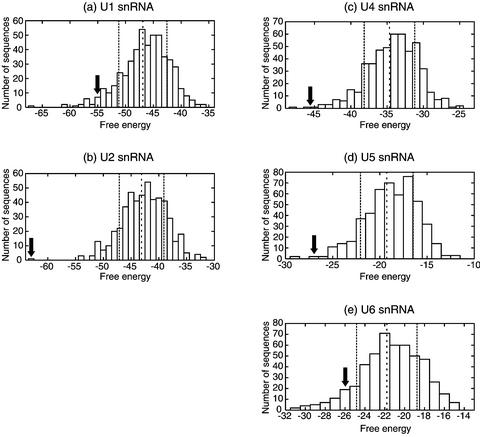
We have also calculated the folding free energy of the optimal structures for 500 shuffled RNA sequences having the same composition as a human snRNA (U1, U2, U4, U5 and U6). Figure 6 shows the histograms of the minimum free energy. It is known that the distribution pattern of the minimum free energy shows a Gaussian distribution (19).
Figure 6.
Histogram of the free energy for a sample set of shuffled sequences of human snRNA. (a) U1 snRNA, (b) U2 snRNA, (c) U4 snRNA, (d) U5 snRNA and (e) U6 snRNA. The arrows stand for the free energy of the original sequence. The dashed lines represent the average values and the dotted lines show the standard deviations for each distribution.
As shown in Figure 6, the biological snRNAs have rather low minimum free energies compared to the shuffled sequences at the 0.30 significance level. Although only U1 snRNA has different features from the other four snRNAs with respect to the Valley Index, there are no remarkable differences among the five snRNAs in the free energy distribution patterns on this criterion.
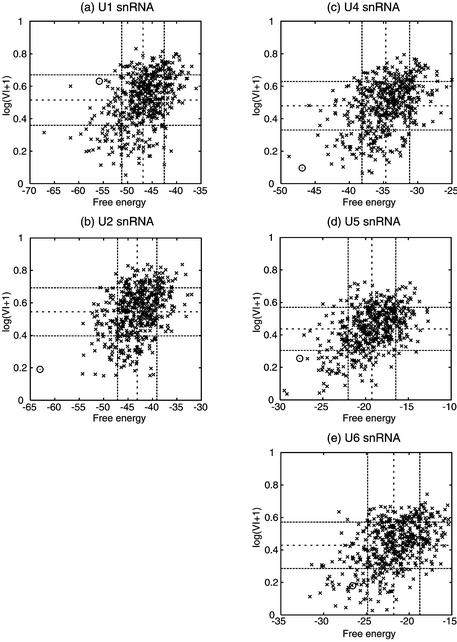
We examined the correlation between the Valley Index and the minimum free energy. In Figure 7, we plot the Valley Index and the minimum free energy of the set of 500 shuffled sequences of each of the human snRNAs reported here. The circle represents the original sequence.
Figure 7.
Correlations of the free energy with respect to the Valley Index. (a) U1 snRNA, (b) U2 snRNA, (c) U4 snRNA, (d) U5 snRNA and (e) U6 snRNA. The circle stands for the original sequence. The dashed lines represent the average values and the dotted lines show the standard deviations for each distribution.
As shown in these plots, there is a moderate correlation between the two variables, which indicates that when one RNA molecule has a lower free energy, it is more likely to have a smaller Valley Index and a uni-valley profile. The correlation factors between the two variables are 0.45, 0.39, 0.42, 0.48 and 0.48 for U1, U2, U4, U5 and U6, respectively.
Each map is divided into nine areas by broken lines representing the standard deviations for each variable. The position of the circle in this map can tell us the general features of the biological RNA structures compared with the RNAs of the shuffled sequences. The circle plots of the three snRNAs (U2, U4 and U6) are in the same area, which has stable free energies and small Valley Indices. The Valley Index of U5 snRNA is also lower than the average value. However, the circle plot of U1 snRNA is placed in the area that has stable free energies and medium values of the Valley Index.
We have carried out a further calculation for other types of RNA molecules: tRNA and 5S rRNA. The calculated correlation factors are 0.34, 0.39, 0.42 and 0.39 for yeast tRNAPhe, human tRNALeu, Escherichia coli 5S rRNA and human 5S rRNA, respectively. It follows from these results that there is a mild correlation between the two variables, but further studies may also be required to verify the correlation for general RNA molecules. On the other hand, unlike the five snRNAs, these tRNA and rRNA molecules do not have stable free energies and do not show uni-valley profiles. These four molecules are not distinguishable from structures with randomized sequences at the 0.30 significance level in terms of both the free energy and the Valley Index. This result may reflect that the structures of tRNA and rRNA molecules could be stabilized through interactions with proteins or other nucleic acids, whereas many of the snRNA molecules with lower free energies are rather structurally stable.
DISCUSSION
As described in the previous section, the U1 snRNA has no distinguishable value of Valley Index from the shuffled sequences, while it has a rather small value of minimum free energy, like the other biological snRNAs.
These results reflect several types of valley profile.
The U1 snRNA can be classified as a multi-valley profile whose Valley Index is not distinguishable from the other profiles of RNA with randomized sequences. The U2, U4, U5 and U6 snRNA can be classified in terms of the uni-valley profile of which the Valley Index is small and the folding free energy takes on a small value. We can also point out that the U5 snRNA has a gentle valley profile, while the others have rather steep valley profiles.
The uni-valley profile represents the structural stability against the changes in energy levels.
On the other hand, the multi-valley profile possibly suggests diverse conformations of alternative structures, which might reflect some interesting biological roles, such as a conformation switch or some stabilizing effects through interactions with proteins. As shown in Figure 6, the traditional energy-based index cannot distinguish these five RNA molecules. Although it may require further studies to clarify how the Valley Index is related to possible biological functions, it is interesting that these RNA molecules show different types of distributions in terms of conformational energy landscapes.
We can also draw some inferences about the mechanism in the pre-mRNA splicing process considering the results of our approach.
The U1 snRNA is known to have a binding site that recognizes the exon–intron sequences (20). Some proteins have been reported to switch their functions by binding to nucleic acid molecules. The conformational change in the U1 snRNA also might have a biologically important role to switch on the process and enable the other snRNA molecules to bind the splice site and proceed through the splicing process. Several results in biological studies suggest that the exchange of U1 for U6 at the 5′ splice site may be responsible for flipping the switch in spliceosome activation (21).
Giegerich et al. studied a method for the prediction of structural switches in RNA and developed a software called paRNAss for RNA switch prediction (22). Their method is based on the secondary structural distance and the energy barrier distance. We also made analyses of the human spliceosomal snRNAs using paRNAss, but it was quite difficult to see clear differences among the snRNAs. Moreover, their results are quite hard to interpret, while the results of our method are easy to understand because of the statistical comparison with shuffled RNAs.
Rivas et al. discussed computational approaches for detecting novel non-coding RNA genes using RNA secondary structure prediction algorithms and concluded that the stability of most non-coding RNA secondary structures is not sufficiently different from the predicted stability of a random sequence (23). There are also several studies which claim that folding free energies are not sensitive enough to distinguish known RNA structures from randomized sequences (24). Our conformational energy landscape based approach will be useful in further applications of predicting the uniqueness of RNA conformational patterns.
Acknowledgments
ACKNOWLEDGEMENTS
This study has been done as part of a graduate school course in the graduate school of the University of Tokyo. We are grateful to Prof. Yamaguchi for permitting us to do this study and the IMS for providing the computer environments.
REFERENCES
- 1.Fontana W., Konings,D.A.M., Stadler,P.F. and Schuster,P. (1993) Statistics of RNA secondary structures. Biopolymers, 33, 1389–1404. [DOI] [PubMed] [Google Scholar]
- 2.Zuker M. and Sankoff,D. (1984) RNA secondary structures and their prediction. Bull. Math. Biol., 46, 591–621. [Google Scholar]
- 3.Klein P. (1998) Computing the edit-distance between unrooted ordered trees. In Proceedings of the 6th Annual European Symposium on Algorithms, LNCS 1461, pp. 91–102.
- 4.Hogeweg P. and Hesper,B. (1984) Energy directed folding of RNA sequences. Nucleic Acids Res., 12, 67–74, Springer-Verlag, Heidelberg. [DOI] [PMC free article] [PubMed] [Google Scholar]
- 5.Konings D.A.M. and Hogeweg,P. (1989) Pattern analysis of RNA secondary structure. Similarity and consensus of minimal-energy folding. J. Mol. Biol., 207, 597–614. [DOI] [PubMed] [Google Scholar]
- 6.Bundschuh R. and Hwa,T. (2002) Statistical mechanics of secondary structures formed by random RNA sequences. Phys. Rev. E, 65, 031903. [DOI] [PubMed] [Google Scholar]
- 7.Dawson W.K., Suzuki,K. and Yamamoto,K. (2001) A physical origin for functional domain structure in nucleic acids. Evidence by cross-linking entropy parts I and II. J. Theor. Biol., 213, 359–412. [DOI] [PubMed] [Google Scholar]
- 8.Zuker M. and Stiegler,P. (1981) Optimal computer folding of large RNA sequences using thermodynamic and auxiliary information. Nucleic Acids Res., 9, 133–148. [DOI] [PMC free article] [PubMed] [Google Scholar]
- 9.Zuker M. (1989) On finding all suboptimal foldings of RNA molecule. Science, 244, 48–52. [DOI] [PubMed] [Google Scholar]
- 10.Hofacker I.L., Fontana,W., Stadler,P.F., Bonhoeffer,L.S., Tacker,M. and Schuster,P. (1994) Fast folding and comparison of RNA secondary structures. Monatsh. Chem., 125, 167–188. [Google Scholar]
- 11.Nagai K., Muto,Y., Pomeranz Krummel,D.A., Kambach,C., Ignjatovic,T., Walke,S. and Kuglstatter,A. (2001) Structure and assembly of the spliceosomal snRNPs. Biochem. Soc. Trans, 29, 15–26. [DOI] [PubMed] [Google Scholar]
- 12.Fortner D.M., Troy,R.G. and Brow,D.A. (1994) A stem/loop in U6 RNA defines a conformational switch required for pre-mRNA splicing. Genes Dev., 8, 221–233. [DOI] [PubMed] [Google Scholar]
- 13.Newman A.J. (1997) The role of U5 snRNP in pre-mRNA splicing. EMBO J., 16, 5797–5800. [DOI] [PMC free article] [PubMed] [Google Scholar]
- 14.Shapiro B.A. and Zhang,K. (1990) Comparing multiple RNA secondary structures using tree comparisons. Curr. Adv. Biol. Sci., 6, 309–318. [DOI] [PubMed] [Google Scholar]
- 15.Rivas E. and Eddy,S.R. (1999) A dynamic programming algorithm for RNA structure prediction including pseudoknots. J. Mol. Biol., 285, 2053–2068. [DOI] [PubMed] [Google Scholar]
- 16.Kobayashi S. and Yokomori,T. (1994) Modeling RNA secondary structures using tree grammars. In Proceedings of Genome Informatics Workshop V, Universal Academy Press, Tokyo, pp. 29–38.
- 17.Lyngso R.B. (1999) Pseudoknots in RNA secondary structures. In Proceedings of the Fourth Annual International Conference on Computational Molecular Biology (RECOMB) 2000. ACM Press, New York, pp. 201–209.
- 18.Flamm C., Hofacker,I.L., Maurer-Stroh,S., Stadler,P.F. and Zehl,M. (2001) Design of multistable RNA molecules. RNA, 7, 254–265. [DOI] [PMC free article] [PubMed] [Google Scholar]
- 19.Dawson W.K. and Yamamoto,K. (1999) Mean free energy topology for nucleotide sequences of varying composition based on secondary structure calculations. J. Theor. Biol., 201, 113–140. [DOI] [PubMed] [Google Scholar]
- 20.Zhuang Y. and Weiner,A.M. (1989) A compensatory base change in U1 snRNA suppresses a 5′ splice site mutation. Cell, 46, 827–835. [DOI] [PubMed] [Google Scholar]
- 21.Murray H.L. and Jarrell,K.A. (1999) Flipping the switch to an active spliceosome. Cell, 96, 599–602. [DOI] [PubMed] [Google Scholar]
- 22.Giegerich R., Haase,D. and Rehmsmeier,M. (1999) Prediction and visualization of structural switches in RNA. In Proceedings of the Pacific Symposium on Biocomputing. World Scientific Publishers, Singapore, Vol. 4, pp. 126–137. [DOI] [PubMed]
- 23.Rivas E. and Eddy,S.R. (2000) Secondary structure alone is generally not statistically significant for the detection of noncoding RNAs. Bioinformatics, 16, 583–605. [DOI] [PubMed] [Google Scholar]
- 24.Workman C. and Krogh,A., (1999) No evidence that mRNAs have lower folding free energies than random sequences with the same dinucleotide distribution. Nucleic Acids Res., 27, 4816–4822. [DOI] [PMC free article] [PubMed] [Google Scholar]
- 25.Manser T. and Gesteland,R.F. (1981) Characterization of small nuclear RNA U1 gene candidates and pseudogenes from the human genome. J. Mol. Appl. Genet., 1, 117–125. [PubMed] [Google Scholar]
- 26.Westin G., Zabielski,J., Hammarstrom,K., Monstein,H.J., Bark,C. and Pettersson,U. (1984) Clustered genes for human U2 RNA. Proc. Natl Acad. Sci. USA, 81, 3811–3815. [DOI] [PMC free article] [PubMed] [Google Scholar]
- 27.Hausner T.P., Giglio,L.M. and Weiner,A.M. (1990) Evidence for base-pairing between mammalian U2 and U6 small nuclear ribonucleoprotein particles. Genes Dev., 4, 2146–2156. [DOI] [PubMed] [Google Scholar]
- 28.Krol A., Gallinaro,H., Lazar,E., Jacob,M. and Branlant,C. (1981) The nuclear 5S RNAs from chicken, rat and man. U5 RNAs are encoded by multiple genes. Nucleic Acids Res., 9, 769–787. [DOI] [PMC free article] [PubMed] [Google Scholar]
- 29.Kunkel G.R., Maser,R.L., Calvet,J.P. and Pederson,T. (1986) U6 small nuclear RNA is transcribed by RNA polymerase III. Proc. Natl Acad. Sci. USA, 83, 8575–8579. [DOI] [PMC free article] [PubMed] [Google Scholar]


