


Abstract
Light-directed synthesis of high-density microarrays is currently performed in the 3′→5′ direction due to constraints in existing synthesis chemistry. This results in the probes being unavailable for many common types of enzymatic modification. Arrays that are synthesized in the 5′→3′ direction could be utilized to perform parallel genotyping and resequencing directly on the array surface, dramatically increasing the throughput and reducing the cost relative to existing techniques. In this report we demonstrate the use of photoprotected phosphoramidite monomers for light-directed array synthesis in the 5′→3′ direction, using maskless array synthesis technology. These arrays have a dynamic range of >2.5 orders of magnitude, sensitivity below 1 pM and a coefficient of variance of <10% across the array surface. Arrays containing >150 000 probe sequences were hybridized to labeled mouse cRNA producing highly concordant data (average R2 = 0.998). We have also shown that the 3′ ends of array probes are available for sequence-specific primer extension and ligation reactions.
INTRODUCTION
DNA microarrays have revolutionized nucleic acid analysis (1). Microarrays are currently being used for a large number of applications, including genome-scale expression analysis (2), genotyping (3,4) and resequencing (5,6). These studies have generally been performed by hybridizing labeled nucleic acids to an array, or were performed enzymatically on relatively low-density spotted array platforms. Hybridization has been shown to be an effective means to study gene expression, but has proven less successful for genotyping and sequencing reactions. A study has recently shown that solid-phase enzymatic genotyping assays are roughly 10 times more accurate than allele-specific hybridization using similar spotted array platforms (7). Powerful methods of parallel genotyping and resequencing would combine the density and reproducibility of in situ synthesized oligonucleotide arrays with the accuracy and sensitivity provided by enzymes. Performing these assays directly on the surface of a high-density microarray would potentially allow for hundreds of thousands of genotypes or base sequences to be determined in a few hours, with high sensitivity and specificity.
High-density microarrays synthesized in situ by photolithographic methods provide unparalleled oligonucleotide densities, excellent sensitivity, specificity and reproducibility, and do not require the burdensome serial synthesis of thousands of oligonucleotides. A major obstacle to the use of high-density arrays in parallel enzyme-based analyses is a limitation in the photolabile synthesis chemistry currently used in array synthesis. Oligonucleotides are synthesized in the 3′→5′ direction, leaving the 3′ end unavailable for many common types of enzymatic modification (8–12). 5′-nitrophenylpropyloxycarbonyl (NPPOC)-3′-phosphoramidite monomers similar to the ones used in this study were previously synthesized and used to synthesize single short oligonucleotides attached to surfaces (13,14), but similar monomers have not been used to synthesize high-density oligonucleotide arrays.
Maskless array synthesis (MAS) technology allows for great flexibility in array design (9,10). This technique utilizes virtual ‘masks’ to pattern light for array synthesis, and requires only sequence information for generation of these ‘masks’. Current MAS units are capable of synthesizing arrays with >195 000 features, each representing a different probe sequence (10). In this report we have characterized the synthesis of highly complex oligonucleotide microarrays in the 5′→3′ direction using MAS technology. The arrays generated in this study have >150 000 array features, and have a dynamic range, sensitivity and reproducibility effectively identical to that of arrays produced in the 3′→5′ direction. We have further shown that the free 3′ ends of these oligonucleotides are available for enzymatic processes, including primer extension and ligation.
MATERIALS AND METHODS
Slide silanization
Erie Gold Seal microscope slides (Fisher, Hanover Park, IL) undergo a 10 min, room temperature incubation in 10% (w/v) sodium hydroxide, are washed, shaken in a 2% bis (2-hyroxyethyl)aminopropyltriethoxysilane solution (v/v) (United Chemical Technologies, Bristol, PA) for 1 h and rinsed in 95% ethanol for 5 min. Slides are dipped immediately into ether and air dried, and baked at 100°C for 15 min, and stored desiccated at –20°C.
Array synthesis
Standard DNA synthesis reagents (Glen Research, Sterling, VA; Proligo, Boulder, CO; Amersham Pharmacia, Piscataway, NJ; Applied Biosystems, Foster City, CA) were used on an Expedite DNA synthesizer (Applied Biosystems). The photolabile 5′-phosophoramidites [3′-NPPOC-deoxyadenosine (N6-benzoyl)-5′-β-cyanoethylphosphoramidite, 3′-NPPOC-deoxycytidine (N4-acetyl)-5′-β-cyanoethylphosphoramidite, 3′-NPPOC-deoxyguanosine (N2-dimethylformamidine)-5′-β-cyanoethylphosphoramidite and 3′-NPPOC-deoxythymidine-5′-β-cyanoethylphosphoramidite] were syn thesized in research quantities at Chemogenix (Waldkraiburg, Germany). 3′-Phosophoramidites [5′-NPPOC-deoxyadenosine (N6-tac)-3′-β-cyanoethylphosphoramidite, 5′-NPPOC-deoxycytidine (N4-isobutyryl)-3′-β-cyanoethylphosphoramidite, 5′-NPPOC-deoxyguanosine (N2-ipac)-3′-β-cyanoethylphosphoramidite and 5′-NPPOC-deoxythymidine-3′-β-cyanoethylphosphoramidite] were supplied by Proligo. The MAS unit (NimbleGen Systems, Madison, WI) was connected to an Expedite (Applied Biosystems) to manufacture the oligonucleotide arrays, as reported earlier (9,10). Arrays were designed with Array Scribe™ software (NimbleGen Systems).
After array synthesis, the base protecting groups were removed in a solution of ethylenediamine:ethanol (1:1 v/v) (Aldrich, St Louis, MO) for 2 h. The arrays were rinsed with water, dried and stored desiccated.
3′-NPPOC deprotection studies
UV light dosing studies were performed for all four bases as performed earlier (10). Briefly, arrays were synthesized with one 3′-NPPOC protected phosphoramidite base layer coupled to the silanized slide. These arrays were then dosed with increasing amounts of UV light to remove the 3′-NPPOC protecting group from the array surface. The deprotected bases were then coupled to a Cy3-phosphoramidite to determine the time required for complete NPPOC removal.
Yield measurements
Custom arrays were designed to study the repetitive yield of four photolabile phosphoramidites. The arrays had features containing oligonucleotides ranging from 1 to 12 bases long. Arrays were synthesized as previously reported (9,10). After array synthesis, biotin phosphoramidite (Glen Research) was coupled to all of the features to determine the number of free hydroxyls. After deprotection, the arrays were placed in the streptavidin-Cy3 (Amersham Pharmacia) buffer for 10 min, washed with non-stringent wash buffer and rinsed for 30 s with 1× NimbleGen final rinse buffer. Stepwise yields were calculated as reported earlier (10,15). Data reported in Table 1 represent the average of 10 separate yield determinations on one array for each base. Coefficient of variance for each yield measurement was <1% for all four bases.
Table 1. Average stepwise yield for 3′→5′ and 5′→3′ array synthesis.
| Base | Average stepwise yield | |
|---|---|---|
| 5′→3′ NPPOC | 3′→5′ NPPOC | |
| A | 95% | 96% |
| C | 94% | 99% |
| G | 93% | 97% |
| T | 97.5% | 98% |
Sample isolation and labeling
Mouse spleen mRNA was isolated from adult Swiss Webster spleen tissue obtained from Pel-Freez Biologicals (Rogers, AK), using oligo(dT) hybrid capture on magnetic streptavidin beads (PolyATract System 1000; Promega) essentially as per the manufacturer’s protocol. RNA was converted to double-stranded cDNA using a Gibco BRL (Rockville, MD) SuperScript Choice System and an oligo(dT) primer containing the T7 RNA polymerase promoter (5′-GGCCAGTGAATTGTAATACGACTCACTATAGGGAGGCGG-T24-3′). Briefly, 15 µg total RNA or 3 µg poly(A)+ RNA was incubated with 1× first strand buffer, 10 mM DTT, 500 µM dNTPs and 5 pM primer for 60 min at room temperature. Second strand synthesis was accomplished by incubation with 200 µM dNTPs, 0.07 U/µl DNA ligase, 0.27 U/µl DNA polymerase I, 0.013 U/µl RNase, 1× second strand buffer and 10 U T4 DNA polymerase for 2 h. Double-stranded cDNA was purified using phenol–chloroform extraction and Eppendorf (Hamburg, Germany) Phase-Lock Gel tubes and ethanol precipitated, washed with 80% ethanol and resuspended in 3 µl water. In vitro transcription (IVT) was used to produce biotin-labeled cRNA from the cDNA using the Ambion (Austin, TX) MEGAscript T7 kit. Briefly, 1 µg double-stranded cDNA was incubated with 7.5 mM ATP and GTP, 5.6 mM UTP and CTP and 1.9 mM bio-11-CTP and bio-16-UTP (Sigma-Aldrich, St Louis, MO) in 1× transcription buffer and 1× T7 enzyme mix for 5 h at 37°C. Before hybridization, cRNA was fragmented to an average size of 50–200 bp by incubation in 100 mM potassium acetate, 30 mM magnesium acetate and 40 mM Tris–acetate for 35 min at 94°C. Fragmentation was checked using a Bioanalyzer (Agilent Technologies, Palo Alto, CA). Six hybridization control oligonucleotides with 3′-Cy3 groups were purchased from IDT (Coralville, IA).
Hybridization and washing
Microarrays were hybridized with 12 µg cRNA in 300 µl, in the presence of 50 mM MES, 0.5 M NaCl, 10 mM EDTA and 0.005% (v/v) Tween-20 for 16 h at 45°C. Before application to the array, samples were heated to 95°C for 5 min, then 45°C for 5 min, and spun at 14 000 g for 5 min. Hybridization was performed in a hybridization oven with agitation. After hybridization, arrays were washed in non-stringent (NS) buffer (6× SSPE, 0.01% v/v Tween-20) for 5 min at room temperature, followed by washing in stringent buffer (100 mM MES, 0.1 M NaCl, 0.01% Tween-20) for 30 min at 45°C. After washing, arrays were stained with streptavidin-Cy3 conjugate from Amersham Pharmacia for 25 min at room temperature, followed by a 5 min wash in NS buffer, a 30 s rinse in 1× NimbleGen final rinse buffer and a blow-dry step using high-pressure grade 5 argon.
Image and data analysis
Arrays were scanned on an Axon 4000B scanner and features were extracted using NimbleScan Software (NimbleGen), using a fixed feature size. Limit of detection probe data represent direct feature intensity values. Average difference values for genes were calculated by taking the difference in intensity values between perfect match and mismatch probes and averaging these 20 values for each gene. Probe values that are more than three standard deviations from the mean of the data for each gene are removed from the analysis. R2 values of array comparisons were calculated using Excel (Microsoft, Redmond, WA).
Primer extension and ligation reactions
Arrays were synthesized with alternating rows of oligo A and oligo B (Table 2). Template and ligation oligonucleotides were purchased from IDT. For primer extension, two arrays were hybridized with 1 nM template A and no template, respectively, in hybridization buffer for 1 h at 45°C in a hybridization chamber #5LJ from Grace Biolabs (Bend, OR). The arrays were then washed as above. After washing, the arrays were extended with 300 µl of extension mix [1× EcoPoly buffer (NEB, Beverly, MA), 0.5 mg/ml BSA, 6 µM each dATP, dCTP, dGTP and TTP/bio-11-dUTP (Enzo Diagnostics, Farmingdale, NY) and 3.75 U of Klenow fragment (3′→5′ exo–) (NEB)]. Extensions were performed at 45°C for 5 min. After extension, arrays were washed twice in room temperature water, blown dry and imaged as above. Ligation reactions were performed for 30 min at room temperature on two separate arrays in the presence and absence of the ligase enzyme [1× Ligase buffer (NEB), 1 nM template A, 1 nM Cy3-labeled ligation oligo, 0.5 mg/ml BSA +/– 10 U/µl T4 DNA ligase (NEB), 200 µl total volume per array]. Arrays were washed in 95°C 0.1% Tween-20 for 5 min, rinsed three times in 95°C water, blown dry and imaged as above.
Table 2. Average R2 values for intra-array and inter-array comparisons.
| Array comparison | Average linear R2 | Average log R2 |
|---|---|---|
| Intra-array (5′→3′, quadrant versus quadrant) | 0.999 | 0.983 |
| Inter-array (5′→3′ versus 5′→3′) | 0.998 | 0.993 |
| Inter-array (3′→5′ versus 3′→5′) | 0.994 | 0.988 |
| Inter-array (5′→3′ versus 3′→5′) | 0.988 | 0.972 |
Average R2 values were calculated from comparisons of multiple quadrants within one array for intra-array comparisons or comparisons across multiple arrays for inter-array comparisons.
RESULTS
Light-directed synthesis of oligonucleotide arrays by MAS technology currently uses nucleotide monomers that have reactive 3′-phosphoramidite groups and 5′-NPPOC photolabile protecting groups (Fig. 1) (9,10). During array synthesis, the 3′-phosphoramidite attaches to the array surface or growing DNA strand, resulting in the production of arrays with 3′ ends attached to the surface. A potentially more useful configuration would be to synthesize arrays in the 5′→3′ direction, resulting in 5′ ends attached to the array surface and 3′ ends toward the solution. We have synthesized all four 3′-NPPOC-5′-phosphoramidite monomers (Fig. 1) that allow for 5′→3′ synthesis, and optimized their use in complex array synthesis.
Figure 1.

Structures of monomers used for 3′→5′ and 5′→3′ array synthesis.
UV light dosing studies indicate that 7.5 J/cm2 is sufficient to remove the 3′-NPPOC group from all four bases (data for guanosine shown in Fig. 2), which is identical to that required for complete removal of 5′-NPPOC groups (10). To determine the stepwise chemical yield of 3′→5′ synthesis, we used a method similar to that described previously (15). Coupling times of 60 s improved overall yields, as compared with 20 s coupling times normally used with the 3′→5′ synthetic monomers (data not shown). This may be due to the fact that the 3′ hydroxyl is a weaker nucleophile and is slightly more hindered than the 5′ hydroxyl. This is consistent with previous studies using DMT based 5′→3′ synthesis (13). Stepwise yields are slightly lower on average than 3′→5′ synthesis using NPPOC chemistry (10), even with longer coupling times (Table 1). Model experiments with 3′-NPPOC-nucleosides irradiated in solution under similar conditions as in the MAS synthesizer and analyzed for deprotection yield quantitatively by HPLC have given a 1–2% lower yield of the correct deprotected nucleoside than the corresponding 5′-NPPOC-nucleosides (data to be published elsewhere). It is therefore concluded that the deprotection reaction rather than the coupling step determines the cycle yield in the case of the 5′→3′synthesis.
Figure 2.

Time course of 3′-NPPOC removal by UV light. Arrays were synthesized with one 3′-NPPOC protected phosphoramidite base layer coupled to the silanized slide. These arrays were then dosed with increasing amounts of UV light to remove the 3′-NPPOC protecting group from the array surface. The deprotected bases were then coupled to a Cy3-phosphoramidite to determine the time required for complete NPPOC removal. The graph indicates the average intensities of 10 array features plotted against the time of UV light exposure for guanosine. Error bars indicate the standard deviation of each measurement. The UV light intensity was 100 mW/cm2. The time point indicated by the arrow, 75 s, was used to calculate the energy required to completely remove the 3′-NPPOC group, 7.5 J/cm2.
To determine the sensitivity and dynamic range of complex arrays synthesized in the 5′→3′ direction, arrays were designed with six 24mer probes that are complementary to six control oligonucleotides. These control probe sets were represented 20 times across the surface of each array. Six arrays were synthesized, three in the 5′→3′ direction and three in the 3′→5′ direction, and hybridized with the control oligonucleotides covering a range of concentrations from 300 pM to 1 pM. The intensity of the control probes indicate that both 5′→3′ and 3′→5′ arrays have a similar linear dynamic range of at least 2.5 orders of magnitude (Fig. 3). Also, the average measured intensity value of the features hybridized to the control oligonucleotide at 1 pM from both types of arrays is >200, roughly four times above the measured background level (<60 for all arrays), indicating a limit of detection in the fM range. The coefficient of variance in the intensities of these control probes across the array surface averaged 8.8% for the 5′→3′ synthesis and 7.0% for the 3′→5′ synthesis.
Figure 3.
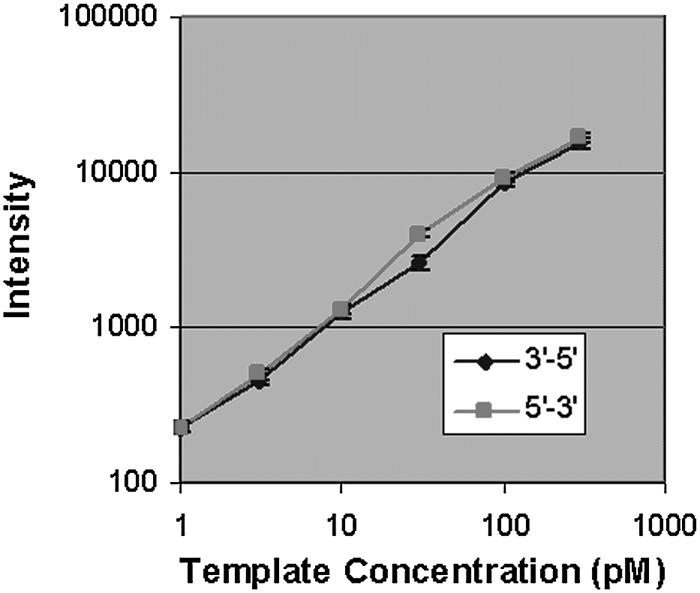
Dynamic range and sensitivity. Six 24mer probes sequences were synthesized at 20 locations across the array surface. Two separate arrays were synthesized, one in the 5′→3′ direction, one in the 3′→5′ direction. The array probes were hybridized to six complementary Cy3-labeled oligonucleotides ranging from 300 to 1 pM. The graph represents the average raw intensity values of all array features for each probe on one array. The error bars represent the standard deviation for each probe across the array surface. The average coefficient of variance measurement for each probe is <10% for both synthesis directions. The average intensity values of the lowest concentration point, 1 pM, is more than four times above background levels for all arrays.
Intra- and inter-array variability were determined by hybridization of labeled mouse spleen cRNA (see Materials and Methods) to arrays containing twenty 24mer probe pairs (perfect match and mismatch) per gene for 950 mouse genes. These probes were randomly distributed across an array quadrant, and each quadrant was repeated four times per array. The resulting array contained 152 000 total probes and 38 000 unique probes, not counting controls. Three 5′→3′ synthesized arrays and three 3′→5′ synthesized arrays were hybridized, and the average difference values (see Materials and Methods) were calculated for all genes on each array. Image details from a 5′→3′ and a 3′→5′ array are shown in Figure 4. The average difference values for 330 genes were at or below the array background (<60 for all arrays), and thus were dropped from further analysis. The remaining 620 average difference values were used to determine concordance between arrays. The intra-array variability for 5′→3′ synthesis was determined by comparing the average difference values for every possible intra-array quadrant combination. An example of the log transformed data for one comparison is shown in Figure 5A. The average R2 value for these comparisons indicates good concordance between array quadrants (Table 2). R2 values from both the linear and log transformed data are shown. While the linear R2 values are often reported for array data comparisons, the R2 values from log transformed data are a more sensitive measure of array variability. The inter-array variability was determined by comparing all possible combinations of one quadrant from one array with the corresponding quadrants from the other two arrays, for both the 5′→3′ synthesis and the 3′→5′ synthesis. These comparisons (examples in Figs 4C and 5B) indicate that the level of concordance across arrays is high, and is similar in both synthesis directions (Table 2). Finally, when data from arrays synthesized in the 5′→3′ direction were directly compared with data from arrays with 3′→5 synthesis, the level of concordance diminished significantly when compared to concordance within one synthesis orientation (Fig. 5D and Table 2). This may be explained by the different synthesis yields of the two chemistries that may slightly favor or disfavor synthesis of specific sequences, and potential alterations in probe secondary structure caused by the direction of attachment.
Figure 4.

Detail of 5′→3′ and 3′→5′ array images. Arrays were designed with twenty 24mer probe pairs (perfect match and corresponding mismatch controls) per gene for 950 mouse genes. Probes were randomly distributed across one array quadrant, and each quadrant was repeated four times on each array. (A) Detail of an array synthesized in the 3′→5′ direction. (B) Detail of an array synthesized in the 5′→3′ direction. (C) Detail comparing perfect match and mismatch probes pairs for 5′→3′ synthesis and 3′→5′ synthesis. Arrays were scanned at a PMT gain of 450.
Figure 5.

Intra-array and inter-array reproducibility. Three arrays were synthesized in the 5′→3′ direction and three were synthesized in the 3′→5′ direction. Arrays were hybridized with labeled mouse spleen cRNA. Average difference values were calculated for all genes represented on the array, and 620 genes with average difference values above the array background were used in the analysis. (A) Comparison of the average difference value for one quadrant with another quadrant of the same array synthesized in the 5′→3′ direction. (B and C) Comparison of the average difference values from the same quadrant on two separate arrays synthesized (B) 5′→3′ and (C) 3′→5′. (D) Comparison of the average difference values from the same quadrant from a 5′→3′ synthesized array with a 3′→5′ synthesized array.
To demonstrate the ability of enzymes to access the 3′ ends of synthesized oligonucleotides, primer extension and ligation reactions were employed. Arrays were synthesized with two 18mer oligonucleotide sequences that were identical except for their 3′ nucleotide, designated oligo A and B (Figs 6A and 7A). For the extension reactions, these arrays were hybridized to a 30mer oligonucleotide designated template A, which was complementary to the 3′ nucleotide of oligo A, but contained a mismatch with the 3′ nucleotide of oligo B. This template extends 12 bases beyond the 3′ end of the array oligonucleotides. After hybridization and stringent washing to eliminate non-specific hybridization, the array primers were extended with the Klenow fragment of DNA polymerase I (3′→5′ exo–). The extension reaction incorporated biotinylated dUTP, which was subsequently stained with streptavidin-Cy3. Two arrays were extended, the first array with template A and the second with no template to determine the efficiency of template-independent extension. Extension from oligo A resulted in a signal that was approximately four times that of oligo B and the no template controls (Fig. 6B and C). The oligo B and no template results indicate that a low level of template-independent extension is occurring, most likely from interactions of the 3′ end of a probe with either itself or neighboring probes. The use of thermostable polymerases and higher reaction temperatures will likely eliminate these structures and reduce non-specific signal, increasing mismatch discrimination.
Figure 6.

Sequence-specific primer extension reactions. Arrays were synthesized with alternating rows of oligonucleotide sequences designated oligo A (5′-AGG TCA TTA CAG CGA GAG-3′) and oligo B (5′-AGG TCA TTA CAG CGA GAC-3′), which are identical except for the 3′ nucleotide. (A) Primer extension scheme showing hybridization of template A (5′-TGA CCT ATA ATC CTC TCG CTG TAA TGA CCT-3′) to the two array oligos. Klenow DNA polymerase is used to extend the 3′ end of the array oligos, and during the extension, labeled nucleotides are covalently attached to the array surface. Oligo A should extend with greater efficiency than oligo B, due to the 3′ mismatch in oligo B with template A. (B) Detail showing signal generated from oligo A and oligo B extended with template A. The array was scanned at a PMT gain of 520. (C) Intensity values resulting from primer extension of oligo A and oligo B with template A or no template.
Figure 7.

Sequence-specific ligation reactions. (A) Ligation scheme showing template A hybridized to the array oligos A and B and ligation of the labeled ligation oligo (5′-phosphate-GATTATAGGTCA-Cy3-3′) to the end of the array oligos with DNA ligase. Ligation to oligo A should be more efficient than oligo B. (B) Detail showing signal generated from oligo A and oligo B after ligation. The array was scanned at a PMT gain of 600. (C) Intensity values resulting from ligation of the ligation oligo to oligo A and oligo B and signal from a no enzyme control. The no enzyme control indicates signal is covalently attached to the surface, and is not due to hybridization. Data points for both reaction types represent the average intensity of 50 array features, and error bars represent the standard deviation of the intensities from the same features.
For the ligation reaction, template A was hybridized to the array, along with the ligation oligo (Fig. 7A). This strategy should result in efficient ligation of the Cy3-labeled ligation oligo to oligo A on the array surface, while ligation to oligo B should be reduced in efficiency, due to the 3′ mismatch with template A. Ligation to the perfect match oligo (oligo A) resulted in approximately five times the signal of ligation to the mismatch oligo (oligo B) (Fig. 7B and C). An identical reaction performed without ligase produced no signal, indicating that the signal resulting from the ligation reaction was indeed covalently bound, and not due to hybridization. These results indicate that the 3′ ends of the array are available for sequence-specific primer extension and ligation reactions.
DISCUSSION
The cycle yields for DNA synthesis of DNA in the 5′→3′ direction were reported in a previous study for T and C (13). Our results with T were identical to that reported earlier (98%). C, however, gave lower yields than previously reported, (94 versus 98%). Previously, only the sequence TCC was synthesized, instead of the C12 used in the current study. The longer sequence may be a more sensitive measure of cycle yield. Despite the fact that the 5′→3′ chemistry resulted in lower cycle yields than the 3′→5′ chemistry, the resulting arrays produced by both synthesis methods appear to have nearly identical sensitivity, dynamic range and reproducibility, based on hybridization studies. Increasing coupling times or optimizing removal of the NPPOC protecting group may improve yields, however, these strategies would likely result in longer array synthesis times, and may have a minimal impact on overall array quality.
Arrays synthesized in the 5′→3′ direction using MAS technology have the potential to dramatically benefit several areas of biological research, including gene expression monitoring, genotyping and resequencing. In one potential assay configuration, unlabeled mRNA samples could be directly hybridized to these arrays and detected by extension of array probes with labeled nucleotides, eliminating the cost and time required for labeled cRNA production, and reducing any biases in current labeling strategies.
There are several types of genotyping assays that could be performed directly on the array surface in a parallel manner, including primer extension (4), ligation (16) and flap cleavage (17). The signal generated by these assays could be amplified by several techniques, such as antibody labeling methods (18), isothermal and thermocycling template exchange (19) and rolling circle techniques (20). By combining these techniques it may be possible to develop assays that are completely parallel in both production and execution. This would result in the ability to interrogate hundreds of thousands of alleles in a few hours on a single array, allowing for extremely detailed linkage and association studies. Since the production and execution of these assays would be completely parallel and the density of information provided by MAS arrays is very high, the resulting assays would have greater than an order of magnitude increase in throughput and cost reduction when compared with existing technologies.
If these arrays were combined with the arrayed primer extension (APEX) resequencing strategy (6), complete viral and prokaryotic genomes could be resequenced overnight. This strategy could also prove useful for discovering novel single nucleotide polymorphisms in large portions of eukaryotic genomes.
REFERENCES
- 1.Gerhold D., Rushmore,T. and Caskey,C.T. (1999) DNA chips: promising toys have become powerful tools. Trends Biochem. Sci., 24, 168–173. [DOI] [PubMed] [Google Scholar]
- 2.Irving P., Troxler,L., Heuer,T.S., Belvin,M., Kopczynski,C., Reichhart,J.-M., Hoffmann,J.A. and Hetru,C. (2001) A genome-wide analysis of immune responses in Drosphila. Proc. Natl Acad. Sci. USA, 98, 15119–15124. [DOI] [PMC free article] [PubMed] [Google Scholar]
- 3.Wang D.G., Fan,J.-B., Siao,C.-J., Berno,A., Young,P., Sapolsky,R., Ghandour,G., Perkins,N., Winchester,E., Spencer,J. et al. (1998) Large-scale identification, mapping and genotyping of single nucleotide polymorphisms in the human genome. Science, 280, 1077–1082. [DOI] [PubMed] [Google Scholar]
- 4.Pastinen T., Raitio,M., Lindroos,K., Tainola,P., Peltonen,L. and Syvanen,A.-C. (2000) A system for specific, high-throughput genotyping by allele-specific primer extension on microarrays. Genome Res., 10, 1031–1042. [DOI] [PMC free article] [PubMed] [Google Scholar]
- 5.Hacia J.G., Fan,J.-B., Ryder,O., Jin,L., Edgemon,K., Ghandour,G., Mayer,R.A., Sun,B., Hsie,L., Robbins,C.M. et al. (1999) Determination of ancestral alleles for human single nucleotide polymorphisms using high density arrays. Nature Genet., 22, 164–167. [DOI] [PubMed] [Google Scholar]
- 6.Shumaker J.M., Tollet,J.J., Filbin,K.J., Montague-Smith,M.P. and Pirrung,M.C. (2001) APEX disease gene resequencing: mutations in exon 7 of the p53 tumor suppressor gene. Bioorg. Med. Chem., 9, 2269–2278. [DOI] [PubMed] [Google Scholar]
- 7.Pastinen T., Kurg,A., Metspalu,A., Peltonen,L. and Syvanen,A.-C. (1997) Minisequencing: a specific tool for DNA analysis and diagnostics on oligonucleotide arrays. Genome Res., 7, 606–614. [DOI] [PubMed] [Google Scholar]
- 8.Pease S.P., Solas,D., Sullivan,E.J., Cronin,M.T., Homes,C.P. and Fodor,S.P. (1994) Light-generated oligonucleotide arrays for rapid DNA sequence analysis. Proc. Natl Acad. Sci. USA, 91, 5022–5026. [DOI] [PMC free article] [PubMed] [Google Scholar]
- 9.Singh-Gasson S., Green,R.D., Yue,Y.J., Nelson,C., Blattner,F., Sussman,M.R. and Cerrina F. (1999) Maskless fabrication of light-directed oligonucleotide microarrays using a digital micromirror array Nat. Biotechnol., 17, 974–978. [DOI] [PubMed] [Google Scholar]
- 10.Nuwaysir E.F., Huang,W., Albert,T.J., Singh,J., Nuwaysir,K., Pitas,A., Richmond,T., Gorski,T., Berg,J., Ballin,J. et al. (2002) Gene expression analysis using oligonucleotide arrays produced by maskless photolithography. Genome Res., 12, 1749–1755. [DOI] [PMC free article] [PubMed] [Google Scholar]
- 11.Gao X., LeProust,E., Zhang,H., Srivannavit,O., Gulari,E., Yu,P., Nishiguchi,C., Xiang,Q. and Zhou,X. (2001) Flexible DNA chip synthesis gated by deprotection using solution photogenerated acids. Nucleic Acids Res., 29, 4744–4750. [DOI] [PMC free article] [PubMed] [Google Scholar]
- 12.Hasan A., Stengele,K.-P., Giegrich,H., Cornwell,P., Isham,K.R., Sachleben,R.A., Pfleiderer,W. and Foote,R.S. (1997) Photolabile protecting groups for nucleosides: synthesis and photodeprotection rates. Tetrahedron, 53, 4247–4264. [Google Scholar]
- 13.Pirrung M.C., Wang,L. and Montague-Smith,M.P. (2001) 3′-Nitrophenylpropyloxycarbonyl (NPPOC) protecting groups for high-fidelity automated 5′-3′ photochemical DNA synthesis. Org. Lett., 3, 1105–1108. [DOI] [PubMed] [Google Scholar]
- 14.Beier M., Stephan,A. and Hoheisel,J.D. (2001) Synthesis of photolabile 5′-O-phorphoramidites for the photolithographic production of microarrays of inversely oriented oligonucleotides. Helv. Chim. Acta, 8, 2089–2095. [Google Scholar]
- 15.McGall G.H., Barone,A.D., Diggelmann,M., Fodor,S.P.A., Gentalen,E. and Ngo,N. (1997) The efficiency of light-directed synthesis of DNA arrays on glass substrates. J. Am. Chem. Soc., 119, 5081–5090. [Google Scholar]
- 16.Gunderson K.L., Huang,X.C., Morris,M.S., Lipshutz,R.J., Lockhart,D.J. and Chee,M.S. (1998) Mutation detection by ligation to complete n-mer DNA arrays. Genome Res., 8, 1142–1153. [DOI] [PubMed] [Google Scholar]
- 17.Wilkins Stevens P., Hall,J.G., Lyamichev,V., Neri,B.P., Lu,M., Wang,L., Smith,L.M. and Kelso D.M. (2001) Analysis of single nucleotide polymorphisms with solid phase invasive cleavase reactions. Nucleic Acids Res., 29, e77. [DOI] [PMC free article] [PubMed] [Google Scholar]
- 18.Zaidi A.U., Enomoto,H., Milbrandt,J. and Roth,K.A. (2000) Dual fluorescent in situ hybridization and immunohistochemical detection with tyramide signal amplification. J. Histochem. Cytochem., 48, 1369–1376. [DOI] [PubMed] [Google Scholar]
- 19.Lyamichev V., Mast,A.L., Hall,J.G., Prudent,J.R., Kaiser,M.W., Takova,T., Kwiatkowski,R.W., Sander,T.J., Arruda,M., Arco,D.A. et al. (1999) Polymorphism identification and quantitative detection of genomic DNA by invasive cleavage of oligonucleotide probes. Nat. Biotechnol., 17, 292–296. [DOI] [PubMed] [Google Scholar]
- 20.Lizardi P.M., Huang,X., Zhu,Z., Bray-Ward,P., Thomas,D.C. and Ward,D.C. (1998) Mutation detection and single-molecule counting using isothermal rolling-circle amplification. Nature Genet., 19, 225–232. [DOI] [PubMed] [Google Scholar]