Abstract
MALDI mass spectrometry is an established platform for high-throughput genotyping of single nucleotide polymorphisms (SNPs). For many species and also for specific ethnic groups, the number of described SNPs is far from sufficient. Here we present a method for SNP discovery that can use existing MALDI genotyping platforms and is automation-compatible. The method is based on in vitro RNA transcripts from PCR products, that can be used to obtain highly informative sequence fingerprints by digestion with the guanosine- specific ribonuclease T1. In these fingerprints, a mutation can be detected as either a mass shift, absence of an existing peak or appearance of an additional peak. Due to mass-degeneracy of fragments and multiple presence of shorter fragments in a given sequence, a certain fraction of possible mutations will remain undetected with this method. Screening of both strands from one PCR product is possible by using T3- and T7-tailed primers and the respective RNA polymerases, and markedly decreases the probability of missing an existing SNP. The use of mass-shifted nucleotides can significantly reduce fragment overlaps and hence increase detectability. We have used a simulation of RNase digests of a set of randomly generated sequences to provide estimates for the general detection probability in dependence on PCR product length. A software package is provided that helps to design PCR primers by plotting out regions with a high SNP discovery score, calculates expected mass fingerprints and peaklists from the target sequence selected for screening and helps in interpretation of digest spectra.
INTRODUCTION
Despite completion of whole genomes, development of new polymorphic markers for association studies remains an important task in genetics. Many single nucleotide polymorphisms (SNPs) maps lack sufficient density, especially in animal and plant genetics but also for specific populations in human genetics. DNA sequencing of individual samples is a very straightforward way to screen for new mutations, but often too expensive for large-scale screening. Other screening methods like SSCP or mismatch cleavage are time and labor intensive and provide only yes/no answers.
In theory, mass spectrometry of DNA fragments should be ideally suited for the detection of new mutations, as any single base substitution will change the mass of the respective fragment. Unfortunately, fragmentation of DNA during the MALDI process greatly reduces mass resolution and sensitivity (1), and the mass differences induced by single base substitution can only be resolved for small fragments, whose generation, e.g. by restriction endonuclease digest (2), is expensive and too laborious for mass screening. RNA, in contrast, shows only minimal fragmentation and consequently a higher resolution, making it an attractive target for MALDI applications (3–5) as it can readily be transcribed from any PCR product that was amplified with a promoter-tailed primer. The generation of small fragments for high resolution measurements is not restricted to recognition sequences, like for DNA, but can be done with base-specific ribonucleases (6) of which the G-specific RNase T1 from Aspergillus oryzae is commercially available from various manufacturers. Another possible route for base-specific cleavage are chemical methods like Maxam–Gilbert sequencing (7) or hydrazin/anilin cleavage (8), but they suffer from incomplete cleavage or the presence of by-products, like for example the oxidative cleavage of phosphorothioates (9), or alkaline cleavage of abasic sites generated by uracyl glycosylase (10). Most reported methods rely on a modified base to achieve specificity, but these analogs are not generally accepted by polymerases. A possible alternative could be phosphoamidates (11), which are readily cleaved under acidic conditions, but their enzymatic incorporation seems too slow and inefficient for amplification of full-length PCR products.
Base-specific RNases have some advantages over chemical cleavage methods. First, they have single-stranded substrates that give less complex fingerprints than the double-stranded PCR products. They are very stable and robust enzymes; incomplete cleavage or overdigestion is hardly ever observed (12). They were first used in mass spectrometry to generate sequencing ladders (6) and to detect post-transcriptional modifications in RNA (12). Here we employed the guanine-specific RNase T1 to generate fingerprints that allow detection of mutations by MALDI-TOF mass spectrometry.
MATERIALS AND METHODS
Amplification and transcription
Gene-specific primers were 5′-tailed to incorporate promoter sequences for viral RNA polymerases T3 and T7, respectively, in order to allow separate generation of RNA transcripts of both strands from the same PCR product. The T7 tail was 5′-TAATACGACTCACTATAGGGAG-3′ and the T3 tail was 5′-AATTAACCCTCACTAAAGGAG-3′.
The PCR was set up in a 10 µl volume containing one template DNA (10 ng/µl genomic DNA), 5 pmol of each primer (MWG Biotech, Ebersberg, Germany), 0.3 U of Platinum Taq Polymerase (BRL Life Technologies, Paisley, UK), 1 µl of reaction buffer, 15 pmol of MgCl2 and 0.1 µl of dNTPs (10 µM; Roth, Karlsruhe, Germany). After initial denaturation for 3 min at 95°C, five cycles at 94°C for 15 s, 60°C for 1 min, 72°C for 1 min and then 30 cycles at 94°C for 15 s, 72°C for 2 min were performed in a Primus 96 thermocycler with heated lid (MWG Biotech). Then the reaction was split in two 5 µl aliquots for separate transcription by T3 and T7 RNA polymerase.
To each 5 µl aliquot, 7.5 µl of reaction mix [2.5 µl of rNTP (2.5 mM each); 1.25 of µl DTT (100 mM), 10 U RNA polymerase and 2.5 µl of 5*transcription buffer; all from Promega, Madison, WI] were added and incubated for 1.5 h at 37°C. Modified nucleotide triphosphate can be incorporated in exactly the same manner by simply substituting the analog for the corresponding natural triphosphate.
RNase T1 digest
Prior to digestion the transcripts were purified (desalted) in order to meet the requirements for MALDI analysis. This was done by a membrane filtration kit (MultiscreenSEQ, Millipore, Bedford, MA). Transcripts were washed twice with 20 µl of bidistilled water and once with 15 µl of 15 mM diammonium citrate. To meet the mild denaturing conditions required for RNase digestion, 5 µl of a MALDI compatible buffer (12) (5 mg/ml 3-HPA in 2% acetonitrile) were used for the final resuspension and the recovered volume was incubated with 10 U of RNase T1 from A.oryzae (Roche Diagnostics, Mannheim, Germany) at 37°C for 1 h. The samples were then ready for MALDI analysis without any further treatment.
Mass spectrometry
After digestion, 0.5 µl of the samples was spotted on dried droplets of matrix [0.5 µl of saturated 3-hydroxypicolinic acid (Bruker-Daltonics, Bremen, Germany) in 50% acetonitrile containing 10 mg/ml dibasic ammonium citrate] on a Scout™384 stainless steel target plate (Bruker Daltonics). Spectra were recorded on a linear Bruker Biflex III delayed extraction MALDI-TOF mass spectrometer equipped with a 2 GHz LeCroy digitizer and a 337 nm N2-laser. Instrumental parameters were: acceleration voltage, 19V; IS/2 potential, 16.45 kV; focusing lens voltage, 9.2 kV; extraction delay, 400 ns. The detector was gated, so that it could not become saturated by ions below 600 Da. Typically, 60 shots were accumulated from two to three different positions within a sample spot, smoothed using a Golay–Savitzky filter and baseline-corrected. The spectra were manually inspected by superimposition of multiple digests and compared to calculated peaklists. To facilitate calibration and superimposition, the synthetic oligonucleotides AGTGATTTTGT (3377.3 Da) and GTTATATT (2414.6 Da) can be used as internal standards, as they do not overlap with any possible RNase T1 product. Online calibration with these two internal standards also allows automated spectra acquisition.
RNaseCut program
A Compaq Visual Fortran-based program package is provided at http://www.vetmed.uni-muenchen.de/gen/forschung. The program can aid in the set-up of screening by plotting regions of most informative fingerprint patterns, and in data analysis by generating both graphical representation and peaklists of digest spectra from a menu of RNases and modified nucleotides. The program will also find possible locations for mutations that are detected by a differing mass peak. The program is written in a modular way with one core module defining cleavage site and calculating fragment mass by choosing RNase and (modified) nucleotides. In this way, it will be easy to implement new RNases, modified nucleotides, sequence format, etc., upon request. The simulation program is also part of the package, so that the user can check which influence an assay modification may have, or simply redo our simulations.
RESULTS AND DISCUSSION
To screen for mutations PCR products were transcribed and the RNA products digested to completion with the guanine-specific RNase T1. Thus, the fragments generated by RNase T1 digests all contain a single G (Mr 345.2) at the 3′ end, whereas the remainder is composed of A (Mr 329.2), U (Mr 306.2) and C (Mr 305.2). Consequently, fragments of equal length cluster together and frequently overlap, as the difference between U and C of only 1 Da is normally not resolved. Although unit-resolution can be achieved even for RNA fragments of several thousands of Daltons (12), such a high-definition measurement is not practicable for high-throughput screenings.
Mutations involving G will change the total number of fragments, whereas A/C, A/U, U/C will only shift an existing peak. The products that are characteristic for the mutation can sometimes overlap with the invariant spectrum component and inhibit the detection of the mutant. The mass-shift of an U/C mutation (1 Da) will normally not be resolved, but on the complementary strand, which is analyzed in a separate reaction, it may be detectable as an A/G mutation. However, the mass-silence of U/C mutations will be a main cause for missing SNPs in RNase T1 screenings. This problem could be avoided by using U- or C-specific RNases or mass-shifted nucleotides.
Besides T1, other base-specific RNases (PhyM, Cusativin and RNase U2) have been described, but they often do not cut at all possible sites (6) and none of them is currently commercially available. The only available alternative to RNase T1 is RNase A, which cuts specifically 3′ of the pyrimidine residue, i.e. after C or U. This more degenerate cleavage results in less informative digestion patterns. However, by incorporation of modified, nuclease-resistant ribonucleotides, like 2′-fluoro analogs (13), RNase A can be made monospecific. Thus, a transcript generated in the presence of 2′-F-UTP as the only uridine source will be cleaved specifically at all C residues by RNase A whereas the same experiment with 2′-F-CTP will yield U-specific digests. In RNase A digests no cyclic intermediates like for RNase T1 (–18 Da peak) are observed (12), making the spectra less complex and thus more sensitive to single changes.
The use of modified nucleotides can also be advantageous in RNase T1 digests to separate the nearly isobaric bases C and U. 2′-F UTP can increase the mass difference to 3 Da and 5′-α-thio CTP to 15 Da. Phosphorothioate in the SP configuration reduces the cleavage rate of GpC by nearly five orders of magnitude in a dinucleotide substrate (14), but by enzymatic polymerization the configuration is inverted to RP (15) which shows a thio-effect of only 1.5. Accordingly, we observed complete digestion of phosphorothioate transcripts, with a mass-shift of +16 Da for each incorporated C. Upon cleavage of a G-p(S)-C bond, however, the mass-shift is associated with the 3′-terminal G, as RNase T1 cleaves 3′ of the phosphorothioate. This results in highly informative fingerprints as all four bases have clearly separated masses and G and C can be further distinguished depending on whether they are in a GpC context or not.
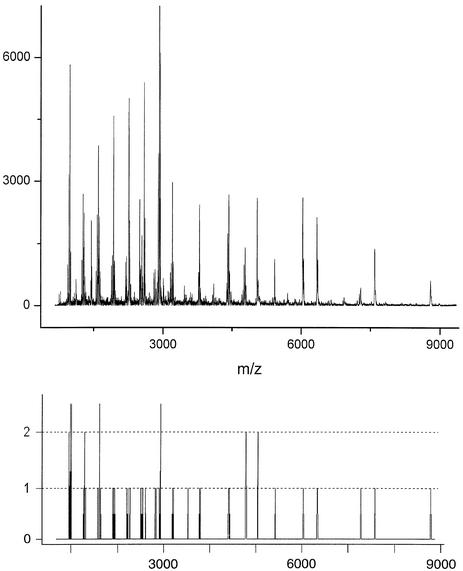
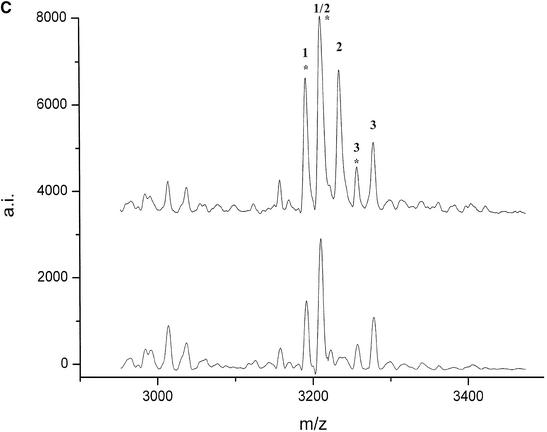
For experimental evaluation the method was tested on two genes with known polymorphisms, prion protein (prp) from sheep and κ-casein (csnk) from cattle and two bovine genes that were sequenced de novo from BAC clones, lman1 and bcl-2. In all cases polymorphisms could be detected, but some polymorphisms were missed as expected (Table 1). The digest spectra were reproducible with a clear presence of all predicted peaks and a low non-specific background (Fig. 1). Each RNase T1 cleavage product is accompanied by a –18 Da by-product that is a cyclic phosphate intermediate. Hydrolysis of this intermediate was never complete, but the relationship between cyclic phosphate and the linear end product varies both within a spectrum and between experiments. All polymorphisms could be independently detected in various animals and replicates. For prp and csnk, polymorphisms were detected or not according to the predicted mass fingerprints. In the smaller transcript of csnk the fragment AAG corresponding to a U→G mutation could be detected in the heterozygous state, while it was masked by an additional invariant AAG in the larger transcript. The homozygous state could be detected through the absence of the 3186 Da peak in both transcript sizes. The genotypes of test samples for the known genes were determined by MALDI primer extension assay and RFLP. The new polymorphisms were first confirmed by sequencing of a mutant and a wild-type animal, and then Mendelian inheritance and allele frequency were checked with either MALDI or RFLP.
Table 1. Detection of SNP.
| Gene | Transcript sizea | Target sequence | SNPs detected by RNaseCut | SNPs total |
|---|---|---|---|---|
| csnk | 260 b | X14908 nucleotides 5144–5386 | 2 | 4 |
| 600 b | X14908 nucleotides 4955–5537 | 2 | 4 | |
| prp | 380 b | M31313 nucleotides 352–714 | 2 | 4 |
| bcl-2 | 810 b | AF515848 nucleotides 1995–2798 | 1 | 1 |
| 809 b | AF515848 nucleotides 2742–3540 | 1 | 1 | |
| lman1 | 783 b | AF515847 nucleotides 17–781 | 1 | 4 |
| 624 b | AF515847 nucleotides 1803–2408 | 1 | 1 |
aIncluding the transcribed reverse promoter sequence that is attached at the respective opposite end of the target sequence.
Figure 1.
MALDI mass spectrum of a whole T1 digest and theoretical spectrum generated by the RNaseCut program. The mass fingerprint represents a 581 bp PCR fragment of bovine kappa casein. In the theoretical spectrum, peak heights are set to 1 for unique peaks, to 2 if the same mass is present twice and to 2.5 for multiples. Notably, there is no correlation to signal height in the experimental spectrum, so that a quantitative interpretation of the mass fingerprint is not possible.
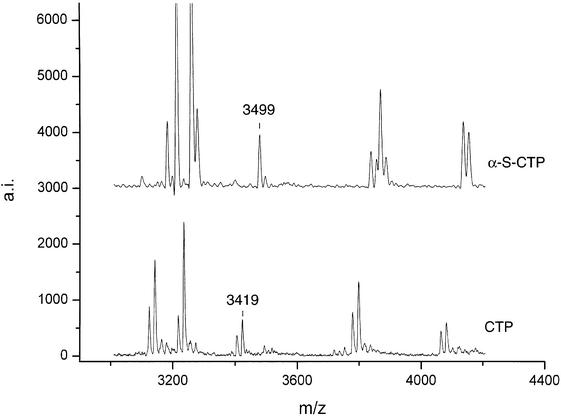
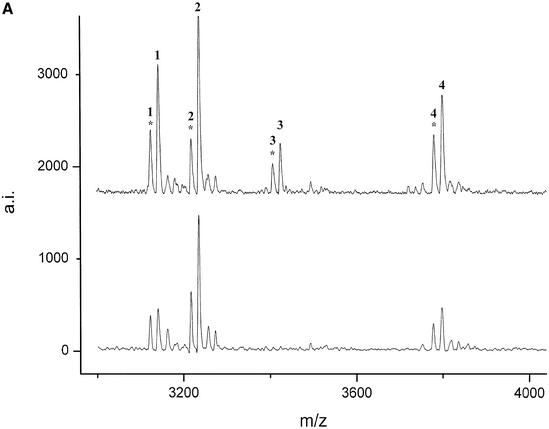
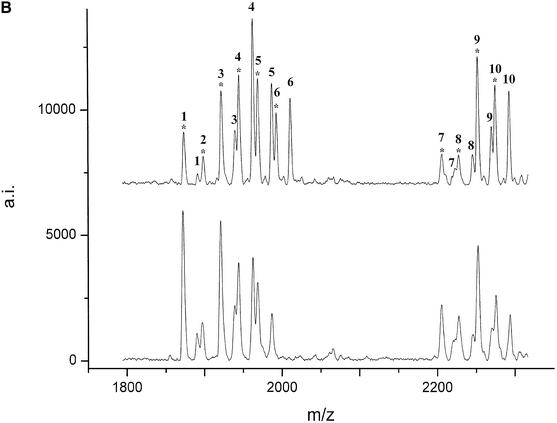
For the bovine gene bcl-2 three PCR products (between 759 and 839 bp) from a genomic stretch of 4190 bp were transcribed, digested and analyzed by MALDI mass spectrometry for eight unrelated animals. Analysis of the mass fingerprints revealed two polymorphisms in two different PCR products. A new peak at 3419 Da was detected in nucleotides 1995–2798 of GenBank AF515848 (Fig. A). By use of the mass-shifted nucleotide α-thio-CTP the fragment mass shifted to 3499 Da and could be unambiguously assigned to the fragment CUCCUUCCCUG that resulted from a new cleavage site generated by an A→G mutation at position 2492 (Fig. 3). In the reverse transcript of nucleotides 2742–3540 of GenBank AF515848 a variant peak at 2009.4 Da (Fig. 2B) could be unequivocally assigned to a G→C mutation at position 3485 without sequencing.
Figure 3.
RNase T1 cleavage of an α-thio modified transcript. Transcription was performed with α-thio CTP instead of normal CTP. Fragment peaks are shifted according to C content and the patterns are more informative. The mutant peak observed at 3499 Da can directly be assigned from its mass, whereas the corresponding 3419 Da peak in the unmodified digest has four possible locations within the transcribed sequence.
Figure 2.
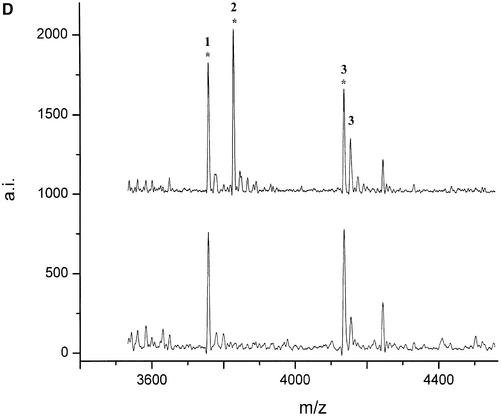
(Following two pages) De novo detection of polymorphisms in the bcl2 (A and B) and lman1 (C and D) genes by MALDI mass spectrometry. The mutations were detected by comparison of the digest spectra of eight unrelated animals. Peaks corresponding to T1 cleavage products are numbered (see Table 4 for annotation) and their respective cyclic phosphate intermediates are marked by an asterisk. (A) T1 digest of the forward transcript of (1995–2798 GenBank AF515848) and (B) of the reverse transcript of (2742–3540 GenBank AF515848). (C) The digest of the forward transcript of (17–781 GenBank AF515847) and (D) of (1803–2408 GenBank AF515847). Positions of the SNPs are deposited under the respective GenBank accession numbers.
The partial genomic sequence (2462 bp) obtained for the bovine lman1 gene was transcribed in four overlapping segments of ∼700 nt and the RNase digest patterns of eight unrelated animals were compared. Analysis of the peak patterns revealed two SNPs that could be confirmed by sequencing, together with three additional polymorphisms that remained undetected by RNase digest. A peak at 3233 Da (Fig. 2C) that was present in four of eight animals, but not in the control sequence (BAC clone) could be assigned to the fragment AUUACAAUAG resulting from an U→G mutation, introducing a new cleavage site at position 4 of the fragment accUauuacaauag. The second polymorphism was identified by the appearance of a peak at 3844 Da (Fig. 2D). This finding was confirmed as UUCAAAAUUACG by sequencing, resulting from an A→G mutation within the fragment UUCAAAAUUACAAAACUCAG.
The experimental evaluation suggests that about half of the present SNPs can be detected (Table 1). To get a better estimation and to understand how design of the PCR products and the use of modified nucleotides can influence the detection rate, extensive simulations were done. We randomly generated 10 000 sequences of 1000 bp and simulated the RNase digest of both the wild-type transcripts and a single random mutation (SNP). In the simulation a mutant was detected when at least one difference between the wild-type and mutant could be resolved in the mass spectrum. We defined the mass-dependent resolution from various digest spectra as the linear regression Δ = 1.7 + 0.001 ∗ mass. This regression was experimentally derived by measuring peak width at half maximum in the mass range from 900 to 15 000 Da in several independent spectra of RNase T1 digested transcripts. The simulation showed a clear correlation between the size of the digested PCR products and the probability to miss an existing polymorphism (Tables 2 and 3). The combined analysis of forward and reverse strand greatly increased the success rate. There is also a negative linear regression (P < 0.001) between the number of cleavage sites and the detection score.
Table 2. Detection probability: RNase T1 unmodified transcript; probability (%) of detecting one SNP in 1000 bpa.
| PCR product size | Forward ww/vvb | Forward ww/wv | Reverse ww/vv | Reverse ww/wv | Forw/Rev ww/vv |
|---|---|---|---|---|---|
| 1000 | 25.3 | 18.0 | 26.8 | 18.8 | 45.8 |
| 500 | 35.6 | 25.8 | 35.4 | 25.8 | 58.6 |
| 333 | 40.4 | 29.8 | 41.2 | 30.9 | 65.5 |
| 250 | 44.8 | 33.6 | 45.7 | 35.2 | 70.9 |
| 200 | 49.0 | 36.9 | 49.2 | 37.3 | 74.9 |
| 100 | 58.0 | 45.2 | 55.8 | 44.0 | 82.7 |
a10 000 random sequences with 1000 bp containing one random SNP were generated.
bThe peak pattern of wild-type (w) and variant (v) were simulated and compared in the homozygous (ww/vv) and heterozygous (ww/wv) form. A SNP was detected when at least one difference in the peak patterns was resolved at routine instrument settings. Smaller PCR products were designed with overlapping primer positions so that the entire sequence was covered.
Table 3. Detection probability: different RNases and modified transcripts; probability (%) of detecting one SNP in 1000 bp.
| PCR product size | RNase T1 α-thio CTP | RNase T1 2′-F-UTP | RNase A | RNase A 2′-F-UTP | RNase A 2′-F-CTP | Combination T1 α-thio/A 2′-F |
|---|---|---|---|---|---|---|
| 1000 | 70.6 | 51.2 | 16.7 | 79.4 | 79.1 | 92.2 |
| 500 | 83.4 | 64.1 | 24.4 | 88.2 | 87.3 | 95.3 |
| 333 | 89.3 | 71.3 | 30.1 | 91.1 | 90.8 | 95.7a |
| 250 | 91.2 | 76.5 | 34.8 | 93.0 | 92.4 | 95.8 |
| 200 | 92.9 | 79.8 | 37.9 | 94.2 | 93.2 | 95.9 |
| 100 | 94.7 | 87.6 | 48.5 | 95.0 | 94.5 | 95.9 |
aA detection rate of 96% has to be considered as the theoretical maximum, as 4% of the 1000 bp are occupied by the first and last primer and are therefore not sensitive for mutations.
The method can detect mutants in the homozygous and in the heterozygous form, but the simulation shows that the detection score is lower when only heterozygotes are available, i.e. for rare alleles that are of less value as genetic markers. For allele frequencies >0.18 a number of 30 unrelated individuals should be sufficient to include at least one that is homozygous for the rarer allele. The simulation also demonstrates the benefit of screening both complementary transcripts (forward/reverse) by using the T7/T3 strategy.
We also inspected the effect of various assay variations regarding application of RNases and modified nucleotides. While RNase A with its lower specificity expectedly decreases the detection score (see Table 3), the combination of RNAse A and a fluoro-nucleotide that selectively inhibits cleavage and thus renders RNase A monospecific, greatly enhances the detection probability. The use of mass-shifted nucleotides is also favorable for RNase T1 digest; the effect is more pronounced for α-thio-CTP than for 2′-F-UTP. Finally, a combined approach, where the PCR is split into four separate transcription/digestions, two with α-thio-CTP/RNase T1 and two with 2′-F-UTP/RNase A, allows detection rates close to 100%. We currently apply the α-thio-CTP/RNase T1 version for routine screening, which should detect ∼80% of the mutations.
Many SNP entries that are found in databases without detailed frequency and distribution data have to be tested for informativity in the population or breed of interest prior to the set-up of a genotyping assay. This can be done by running a RNaseCut experiment in a setting that allows detection of the putative SNP. When the SNP is confirmed and shows appropriate frequency, the assay can be set up. However, when the SNP fails, the flanking sequence that is also screened in the RNaseCut experiment may reveal alternative SNPs that can be used instead.
The method presented here is an attractive feature for existing MALDI genotyping platforms as it enables complete development of SNPs with minimal sequencing costs. If at all, only the final screening result has to be confirmed by sequencing a PCR product of an individual with diverging mass fingerprint in order to localize the mutation. The information that is derived from a variant mass fingerprint can be sufficient to exactly determine the position and nature of the mutation, in the case of ambiguities, a single additional RNaseCut experiment with a mass-shifted NTP or a sequencing run will resolve them.
Furthermore, unlike SSCP or DHPLC, the presence of multiple SNPs in one PCR product does not preclude correct interpretation. The total consumable costs per assay, even with a modified NTP, can be held below 1 Euro, which make it an economically attractive alternative to sequencing. Many automation solutions for MALDI-based SNP assays are compatible with the RNaseCut protocol, and even manually up to 100 samples can be passed per day.
Table 4. Fragment masses in Figure 2A–D.
| Spectrum | Signal | Massa | Sequence |
|---|---|---|---|
| 2A | 1 | 3136.0 | CCCUUCACCG |
| 1 | 3138.0 | ACUUCUCUCG | |
| 2 | 3231.0 | UAAAACCACG | |
| AAAACCACUG | |||
| 3 | 3419.2 | CUCCUUCCCUGb | |
| 4 | 3793.4 | CCAACCCUACCG | |
| 4 | 3795.4 | CAUCCCUUCAAG | |
| 2B | 1 | 1890.2 | CCCCUG |
| 2 | 1915.2 | ACUCUG | |
| 3 | 1938.2 | CCAAUG | |
| UCACAG | |||
| UACCAG | |||
| 3 | 1939.2 | UCAAUG | |
| 3 | 1940.2 | UUAUAG | |
| 4 | 1961.2 | CAACAG | |
| AACCAG | |||
| 5 | 1985.2 | ACAAAG | |
| 5 | 1986.2 | UAAAAG | |
| 6 | 2009.4 | AAAAAG | |
| 7 | 2220.4 | CCUCUAG | |
| 7 | 2222.4 | UCUUAUG | |
| 8 | 2243.4 | UCCACAG | |
| CUCACAG | |||
| 9 | 2267.4 | AAUCACG | |
| 9 | 2268.4 | AAAUCUG | |
| 10 | 2290.4 | ACACAAG | |
| 2C | 1 | 3207.0 | CCAUCAAACG |
| 1 | 3211.0 | UUUUAUAAAG | |
| 2 | 3233.0 | AUUACAAUAG | |
| 3 | 3280 | c | |
| 2D | 1 | 3774.4 | CUCAUAUUCUUG |
| 1 | 3775.4 | UUAUUACUUCUG | |
| 2 | 3844.4 | UUCAAAAUUACG | |
| 3 | 4151.6 | ACAUUUAAUUUAG |
aFor each fragment only the main product is listed. Each listed mass is accompanied by a –18 Da intermediate that is marked by an asterisk in the corresponding figures.
bFragments that are present in only one of the variants are in italics.
cInvariant fragment with unknown sequence.
Acknowledgments
ACKNOWLEDGEMENTS
The authors thank Tierzuchtforschung e.V. München for free allocation of measuring time on the MALDI-TOF mass spectrometer.
DDBJ/EMBL/GenBank accession nos AF515847, AF515848
REFERENCES
- 1.Nordhoff E., Kirpekar,F., Karas,M., Cramer,R., Hahner,S., Hillenkamp,F., Kristiansen,K., Roepstorff,P. and Lezius,A. (1994) Comparison of IR- and UV-matrix-assisted laser desorption/ionization mass spectrometry of oligodeoxynucleotides. Nucleic Acids Res., 22, 2460–2465. [DOI] [PMC free article] [PubMed] [Google Scholar]
- 2.Chiu N.H., Tang,K., Yip,P., Braun,A., Koster,H. and Cantor,C.R. (2000) Mass spectrometry of single-stranded restriction fragments captured by an undigested complementary sequence. Nucleic Acids Res., 28, e31. [DOI] [PMC free article] [PubMed] [Google Scholar]
- 3.Kirpekar F., Nordhoff,E., Kristiansen,K., Roepstorff,P., Lezius,A., Hahner,S., Karas,M. and Hillenkamp,F. (1994) Matrix assisted laser desorption/ionization mass spectrometry of enzymatically synthesized RNA up to 150 kDa. Nucleic Acids Res., 22, 3866–3870. [DOI] [PMC free article] [PubMed] [Google Scholar]
- 4.Kwon Y., Tang,K., Cantor,C., Koster,H. and Kang,C. (2001) DNA sequencing and genotyping by transcriptional synthesis of chain-terminated RNA ladders and MALDI-TOF mass spectrometry. Nucleic Acids Res., 29, e11. [DOI] [PMC free article] [PubMed] [Google Scholar]
- 5.Krebs S., Seichter,D. and Forster,M. (2001) Genotyping of dinucleotide tandem repeats by MALDI mass spectrometry of ribozyme-cleaved RNA transcripts. Nat. Biotechnol., 19, 877–880. [DOI] [PubMed] [Google Scholar]
- 6.Hahner S., Ludemann,H.C., Kirpekar,F., Nordhoff,E., Roepstorff,P., Galla,H.J. and Hillenkamp,F. (1997) Matrix-assisted laser desorption/ionization mass spectrometry (MALDI) of endonuclease digests of RNA. Nucleic Acids Res., 25, 1957–1964. [DOI] [PMC free article] [PubMed] [Google Scholar]
- 7.Maxam A.M. and Gilbert,W. (1977) A new method for sequencing DNA. Proc. Natl Acad. Sci. USA, 74, 560–564. [DOI] [PMC free article] [PubMed] [Google Scholar]
- 8.Tolson D.A. and Nicholson,N.H. (1998) Sequencing RNA by a combination of exonuclease digestion and uridine specific chemical cleavage using MALDI-TOF. Nucleic Acids Res., 26, 446–451. [DOI] [PMC free article] [PubMed] [Google Scholar]
- 9.Gish G. and Eckstein,F. (1988) DNA and RNA sequence determination based on phosphorothioate. Science, 240, 1520–1522. [DOI] [PubMed] [Google Scholar]
- 10.von Wintzingerode F., Bocker,S., Schlotelburg,C., Chiu,N.H., Storm,N., Jurinke,C., Cantor,C.R., Gobel,U.B. and van den Boom,D. (2002) Base-specific fragmentation of amplified 16S rRNA genes analyzed by mass spectrometry: a tool for rapid bacterial identification. Proc. Natl Acad. Sci. USA, 99, 7039–7044. [DOI] [PMC free article] [PubMed] [Google Scholar]
- 11.Shchepinov M.S., Denissenko,M.F., Smylie,K.J., Worl,R.J., Leppin,A.L., Cantor,C.R. and Rodi,C.P. (2001) Matrix-induced fragmentation of P3′-N5′ phosphoramidate-containing DNA: high-throughput MALDI-TOF analysis of sequence. Nucleic Acids Res., 29, 3864–3872. [DOI] [PMC free article] [PubMed] [Google Scholar]
- 12.Kirpekar F., Douthwaite,S. and Roepstorff,P. (2000) Mapping posttranscriptional modifications in 5S ribosomal RNA by MALDI mass spectrometry. RNA, 6, 296–306. [DOI] [PMC free article] [PubMed] [Google Scholar]
- 13.Pieken W.A., Olsen,D.B., Benseler,F., Aurup,H. and Eckstein,F. (1991) Kinetic characterization of ribonuclease-resistant 2′-modified hammerhead ribozymes. Science, 253, 314–317. [DOI] [PubMed] [Google Scholar]
- 14.Loverix S., Winqvist,A., Stromberg,R. and Steyaert,J. (2000) Mechanism of RNase T1: concerted triester-like phosphoryl transfer via a catalytic three-centered hydrogen bond. Chem. Biol., 7, 651–618. [DOI] [PubMed] [Google Scholar]
- 15.Griffiths A.D., Potter,B.V. and Eperon,I.C. (1987) Stereospecificity of nucleases towards phosphorothioate-substituted RNA: stereochemistry of transcription by T7 RNA polymerase. Nucleic Acids Res., 15, 4145–4162. [DOI] [PMC free article] [PubMed] [Google Scholar]


