


Abstract
Serial analysis of gene expression (SAGE) is a widely used and powerful technique to characterize and compare transcriptomes. Although several modifications have been proposed to the initial protocol with the aim of reducing the amount of starting material, unless additional PCR steps are added, the technique is still limited by the need for at least 1 µg of total RNA. As extra PCR amplification might introduce representation biases, current SAGE protocols are not fully suitable for the study of small, microdissected tissue samples. We propose here an alternative method involving the linear amplification of small mRNA fragments containing the SAGE tags. The procedure allows preparation of libraries of over 100 000 tags from as few as 2500 cells. A satisfactory correlation was observed between a microSAGE library made from 5 µg of total thyroid RNA, and a library prepared from 50 ng of the same RNA preparation according to the present protocol.
INTRODUCTION
Better understanding of many different biological processes would greatly benefit from the possibility of analyzing transcriptomes in subpopulations of cells isolated, e.g. by laser captured microdissection or fluorescence-activated cell sorting. Current methods to achieve this goal, including microarray and serial analysis of gene expression (SAGE), still suffer from several limitations: profiling of gene expression with microarrays can only identify the predefined transcripts present on the chip and requires significant amounts of starting RNA (1). SAGE is a powerful tool to determine expression profiles, requiring no a priori knowledge of the genes to be identified; however, the method has not been thoroughly validated for use with limited amounts of RNA.
Since its description in 1995 by Velculescu et al. (2), SAGE has been widely used in fields as diverse as cancer research, development and study of microorganisms (3–5). The efficiency of the method has been emphasized recently as a means to identify novel transcripts or genes that are difficult to identify by conventional methods (6). With the advent of high throughput DNA sequencing and the progress in the annotation of genomes, SAGE qualifies as an extremely powerful tool for mRNA profiling. The amount of input RNA in the initial protocol was as high as 5 µg of poly(A) RNA (approximately 5 × 10⁶ cells). Despite several modifications, described as microSAGE (7) (www.sagenet.org/sage_protocol.htm), current protocols still require 5 × 10⁴ cells, or ∼1 µg of total RNA, which is not compatible with application of the method to small microdissected tissue samples.
Different attempts have been made to lower the quantity of input material (8–10). PCR-SAGE (8) and SAGE-Lite (9) both rely upon the inherent poly(C) terminal transferase activity of reverse transcriptase to switch templates during DNA polymerization (Clontech SMART system). This allows generation of PCR-amplified cDNA prior to the SAGE procedure. Starting with nine human GV oocytes [900 pg of poly(A) RNA], PCR-SAGE (8) was able to generate a library validated by the presence of transcripts known to be expressed in oocytes. SAGE-Lite (9), starting with 50 ng of total RNA derived from cerebrovascular tissue or HT1080 cells, was validated in a similar way. MiniSAGE (11) and SADE (12), by diminishing the loss of material throughout the procedure, permitted the amount of input RNA to be lowered somewhat (1 µg of total RNA and 105 cells, respectively). The microSAGE technique developed by Datson et al. (10) included an extra PCR amplification of the ditags, with the result of increasing the amount of duplicate dimers and of tags corresponding to adaptors. By a similar approach of two-step PCR amplification of the ditags and other minor modifications, Schober et al. (13) were able to generate a SAGE library from one single PC-3 cell, but with no convincing validation of the results.
Most of these methods include additional PCR steps, either before or after the generation of the SAGE tags. This is expected to introduce significant biases in the resulting SAGE libraries. In an attempt to lower the amount of input RNA while avoiding the pitfalls associated with additional PCR steps, we devised a SAGE protocol in which a loop of linear amplification of RNA (14) has been included (Fig. 1). The procedure, which involves T7 RNA polymerase-dependent transcription of the mRNA segment between the tag and the poly(A) tail, allowed us to generate large SAGE libraries from 50 ng of total RNA. This protocol, which we call SAR-SAGE (small amplified RNA-SAGE), yielded a mouse thyroid tag library displaying the expected tissue-specific transcript profile and a satisfactory correlation with a library obtained from 5 µg of the same (but unamplified) total RNA sample.
Figure 1.

Schematic representation of the additional loop of mRNA amplification of the SAR-SAGE procedure. The first steps of the amplification procedure (described under path 1) are in common with the classical microSAGE procedure (described under path 2). After cleavage with the anchoring enzyme, T7-SAGE adaptor containing the promoter of the T 7 RNA polymerase is ligated to the cohesive end of the cDNAs; this allows for the synthesis of small mRNA molecules harboring the SAGE tags. These RNAs are then used in the classical microSAGE procedure.
MATERIALS AND METHODS
RNA extraction
Thyroids from adult wild-type C57Bl mice were dissected, snap-frozen in liquid nitrogen and stored at –80°C. Fifty-four thyroids were pooled to obtain ∼100 mg of tissue, and total RNA was extracted with TRIZOL reagent (Gibco Life Technologies, Merelbeke, Belgium). The quality of RNA was tested on a 1% agarose gel by checking the integrity of the 18S and 28S bands. The quality of the RNA was analyzed further with a bioanalyser (Agilent®, Brussels, Belgium).
Amplification of RNA
A 50 ng aliquot of total RNA was used as starting material for the amplified library. Double-stranded cDNA synthesis and NlaIII digestion were performed with the I-SAGE kit (Invitrogen, Merelbeke, Belgium) following the manufacturer’s protocol, except that the reaction volumes were downsized to 20 µl for first-strand synthesis [with 20 µl of Dynabeads oligo(dT)25 (Dynal, Compiègne, France)], 150 µl for second-strand synthesis and 50 µl for cleavage with the anchoring enzyme.
A ‘T7-SAGE’ adaptor was devised, containing the T7 RNA polymerase promoter upstream of a 16 bp spacer (the reverse sequence of the last 10 bases of this spacer was chosen to avoid inclusion of any tag corresponding to a predicted mouse transcript), and with a catg protruding end. It was obtained through hybridization of the following two oligonucleotides: T7catg-f (5′-cagagaatgcataatacgactcactatagggatccacaagaactactacatg-3′) and T7-r (5′-PO4 tagtagttcttgtggatccctatagtgagtcgtattatgcattctctg-3′). A 30 ng aliquot of the T7-SAGE adaptor was ligated to the cohesive ends of the NlaIII-cleaved cDNA attached to oligo(dT)25 Dynabeads (final volume 10 µl; 2.5 U of T4 DNA ligase). After four washes with 100 µl of buffer D (I-SAGE kit) and two washes with 1× transcription buffer (MEGAscript kit, Ambion, Huntingdon, UK), transcription was performed in 20 µl with T7-megascript enzyme mix (Ambion, Huntingdon, UK), following the manufacturer’s instructions (3 h, 37°C, on a rotor). The mRNA segments resulting from the amplification were separated from the beads by sedimentation on a magnetic stand. They were purified on a microcon-10 column (Millipore, Brussels, Belgium) following the manufacturer’s instructions, except for an additional washing step with 500 µl of RNase-free water. The efficiency of transcription was checked by RT–PCR: 50 ng of total RNA and the product of two cycles of amplification starting from 50 ng of total RNA were used to initiate a SAGE library. After the second-strand synthesis, an aliquot of 1% was retrieved for PCR evaluation with 0.2 µM G3PDH-specific primers (5′-aaggagtaagaaaccctgga-3′ and 5′-cagcgaactttattgatggt-3′) with Taq polymerase (Qiagen, Leusden, The Netherlands) following the manufacturer’s instructions. An aliquot was removed at 18, 21, 24, 26 and 28 cycles (Fig. 2).
Figure 2.
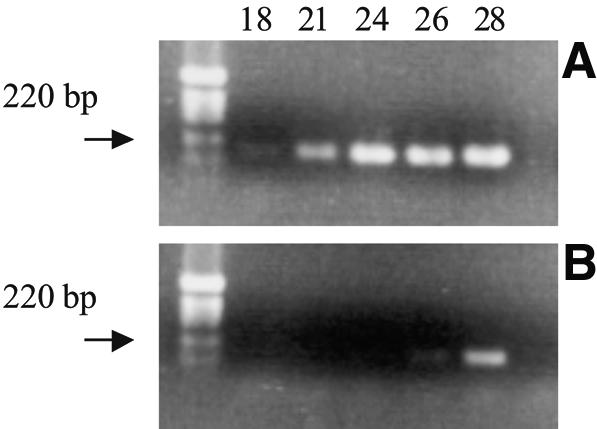
Estimation of the efficiency of the T7 amplification step by RT–PCR (see Materials and Methods): identical aliquots of cDNA resulting from reverse transcription of amplified RNA (A) or 50 ng of total RNA (B) were used as starting material for G3PDH-specific PCR. PCR products obtained after 18, 21, 24, 26 and 28 cycles were analyzed by agarose gel electrophoresis.
Generation of SAGE libraries
The synthetic small mRNAs obtained after one cycle of amplification, and 5 µg of total RNA were used to generate ditags with the I-SAGE kit following the manufacturer’s instructions, with minor modifications. Some reaction volumes were downsized: 60 µl for first-strand synthesis [with 60 µl of oligo(dT)25 Dynabeads], 450 µl for second-strand synthesis, 100 µl for cleavage with the anchoring enzyme, and 100 µl for cleavage with the tagging enzyme. After second-strand synthesis, extensive washes were necessary to avoid clumping of the beads. The ditags were diluted (1:80) and amplified by PCR with Taq polymerase (Qiagen, Leusden, The Netherlands) using 5′ biotinylated primers: primer 1 (5′-ggatttgctggtgcagtaca-3′) and primer 2 (5′-ctgctcgaattcaagcttct-3′). Amplification was performed for 30 cycles in 20% Q solution containing 600 nM of each primer, following the manufacturer’s instructions. The products from 288 and 192 PCRs were pooled for the non-amplified and amplified libraries, respectively, extracted with phenol– chloroform, ethanol precipitated and loaded onto a 10% polyacrylamide–10% spreadex minigel (Elchrom Scientific AG, Switzerland). Ditags of 102 bp were recovered from the gel and cleaved with NlaIII. The resulting 26 bp ditags were purified on streptavidin-coated magnetic beads as described (7,15). No further purification was perfomed by gel electrophoresis in order to limit the loss of material.
Concatemerization of ditags was performed as described (I-SAGE protocol). The length of the concatemers was between 500 and 2000 bp. Fragments ranging from 500 to 2000 bp for the non-amplified sample and from 500 to 1200 bp for the amplified sample were recovered after electrophoresis through a preparative 1.5% agarose gel, and extracted with the MinElute Gel extraction kit (Qiagen, Leusden, The Netherlands). In order to increase the cloning efficiency, the concatemers were rendered blunt with T4 DNA polymerase (Gibco-BRL, Merelbeke, Belgium), and cloned into the EcoRV site of pZErO-1. Transformation, bacterial culture, PCR amplification of the clones and sequencing were performed as described (I-SAGE).
Statistical analysis
Correlation between representation of tags in the two libraries was established using a variance-stabilizing transformation of abundance. This lowers the impact of very abundant tags, while decreasing simultanously the impact of the least expressed tags (0–2 copies per library). The transformation we used is of the form log10(n + k), were n is the absolute number of tags in the library (normalized for 10 000 tags) and k is a constant which was set to 10.
RESULTS
To decrease the amount of starting material required to generate comprehensive SAGE libraries from small tissue samples, we reasoned that linear amplification of the mRNA targets might have advantage over PCR by minimizing biases introduced by the amplification step. RNA amplification through T7 RNA polymerase-dependent transcription has been used efficiently to construct cDNA libraries from a single cell (14) and is currently included in some microarray protocols (16–18). Our approach consisted of including a T7 RNA polymerase promoter within an adaptor derived from the standard SAGE linker (Fig. 1). This allowed transcription of cDNA segments, extending from the last NlaIII site of transcripts to the poly(A) tail (step 1 in Fig. 1). As the cDNAs are immobilized on oligo(dT) magnetic beads, several rounds of transcription can be performed in succession with the same cDNA preparation, with the potential to increase the yield further in a linear way (19).
In order to allow for comparison of the new protocol with standard microSAGE, two mouse thyroid libraries were prepared. The first, starting with 5 µg of total RNA, was made according to the microSAGE protocol (I-SAGE kit), except for minor modifications described above (see Materials and Methods). The second, following the scheme described in Figure 1, started from 50 ng of the same RNA preparation. Both protocols produced large number of bacterial clones, with the potential to generate libraries of 105 and 7 × 10⁵ tags, for the non-amplified and amplified libraries, respectively.
We analyzed 9107 tags from the non-amplified library and 9016 tags from the amplified library. After exclusion of tags derived from the standard SAGE adaptors (A and B, for both libraries) and the T7-SAGE adaptor used for the amplified library (see Materials and Methods), 8670 and 7485 tags remained, respectively. A relatively high abundance of artifactual tags in the amplified library originate from the T7-SAGE adaptor. They correspond to DNA copies of the 5′ segment common to all T7-amplified transcripts (part of the T7-SAGE linker is transcribed). Although they should be removed by washing, after cleavage with NlaIII, a small amount of these 20 bp oligonucleotides remained in the assay, were able to ligate to SAGE linkers and were processed as tags (5% of the total in the amplified library).
The numbers of duplicate dimers were 206 and 675 in the unamplified and amplified library, respectively. They were found to be composed mainly of the association of the most frequent tags: the SAGE linkers themselves (4.25 and 8.5%, in the non-amplified and amplified libraries, respectively); the T7-SAGE adaptor (0 and 6.1%); thyroglobulin (6.8 and 5.8%); ATP synthase 6 (2.55 and 1.75%); the cytochrome c oxidase subunit 1 (1.65 and 1.67%); and cytochrome c oxidase subunit 3 (1.55 and 2%). They probably result, for a significant proportion, from the association of the most frequent tags present in the mixture prior to the PCR amplification step. For instance, association of the tags corresponding to thyroglobulin and T7-SAGE linker (the two most frequent tags in the amplified library) occurred 67 times with a predicted occurrence of 31 (frequency of the T7-SAGE linker tag × frequency of the thyroglobulin tag in the library: 558 × 506/9016). Thus the high number of duplicate dimers in the amplified library is not representative of an important PCR bias, rather it is likely to reflect the chance association of frequent tags prior to PCR. Whether a fraction of these tags should be included in the analysis is questionable.
The numbers of genes identified in the two libraries were very similar: 4484 for the non-amplified library and 3921 for the amplified library, 912 and 899 of them being represented at least twice; 1789 were common to both libraries. This is similar to the diversity observed in the human thyroid SAGE library (20) and indicates that the amplification step by T7-dependent transcription does not reduce the complexity of the final SAGE library.
The gene expression profile observed in our two libraries derived from mice thyroids is consistent with what is known of thyroid metabolism, and shows similarity to an available human thyroid SAGE library (20). Thyroglobulin, the major thyroid-specific protein and the precursor of thyroid hormones, constitutes the major molecular species of both libraries (6.5% of tags). This agrees with the notion that thyroglobulin synthesis amounts to 20–40% by weight of total protein synthesis in the thyroid (thyroglobulin is a 660 000 Da dimeric protein) (21). Also as expected, calcitonin, produced by thyroid C cells, and parathyroid hormone are highly represented (the parathyroid glands were not removed from the thyroid glands during tissue dissection). Ribosomal proteins are well represented, in agreement with the data obtained with the human thyroid SAGE library and consistent with the situation in most SAGE libraries. Several transcripts, although not thyroid specific, were shown to play a role in thyroid physiology: e.g. BiP chaperone (22), S-100 protein (23) and ferritin (24). A list of the most abundant tags, their corresponding gene (if available) and the representation of the corresponding genes in the human thyroid SAGE library are displayed in Table 1. Two different tags could be assigned to thyroperoxidase (TPO); the first, TTCATTCAGA, located between the ultimate 3′-CATG preceding a polyadenylation signal, was present only once in the non-amplified library, and not in the amplified library; the second, TCTGAAGCAC, precedes a poly(A) stretch further downstream in the 3′-non-coding sequence and appeared three times in the non-amplified library, and once in the amplified library. This is at variance with the expectation from the human thyroid SAGE library, according to which ∼50 tags should have been found (10% of the frequency of thyroglobulin tag) (20). Also, for both the non-amplified and the amplified libraries, several low abundance thyroid-specific transcripts are missing (TTF1, TTF2, Thox, pendrin and the TSH receptor). In contrast, Pax 8 and Gsα are present in the two libraries at a frequency comparable with that observed in human. With the restriction of possible incorrect identification of tags in the mouse (annotation of the mouse genome is lagging as compared with the human genome), the fact that these differences are observed for both the amplified and the non-amplified libraries suggests that they might truly reflect lower abundance in the mouse.
Table 1. List of the 51 most abundant tags sorted by the sum of their abundance in both the amplified and non-amplified libraries.

Ampl, number of tags in the amplified library; non ampl, number of tags in the control non-amplified library; human, number of tags in the human thyroid SAGE library (20). The number of tags was normalized to 10 000 tags per library.
Also for the most abundant tags, the differences observed between the two mouse libraries on one hand and the human library on the other are likely to reflect true species differences. One puzzling observation is the high abundance of tags corresponding to α- and β-globin transcripts in both the amplified and non-amplified libraries. Although no satisfactory explanation can be provided at present, globin transcripts were observed similarly in microarray experiments performed with the same and replicate RNA preparations (J.C.Goffard, L.Ling, H.Mircescu, P.Van Hummelen, C.Ledent, J.E.Dumont and B.Corvilain, in preparation); in addition, the presence of α-globin transcript was confirmed by RT–PCR in the starting RNA (data not shown).
A correlation of 97% was obtained when comparing the actual number of tags in the two libraries. This high correlation value is somehow artificial because of the disproportionate weight of the four most abundant tags (Fig. 3A). In order to minimize the optimistic and pessimistic influences of the most abundant and least abundant tags, respectively, we applied a variance-stabilizing transformation (see Materials and Methods). This gave a satisfactory correlation of 75% between our two mouse libraries (Fig. 3). If we consider the 151 most abundant tags (those for which the sum of their representation in the two libraries is greater than or equal to 10), only seven tags (4.5%) exhibit a difference of abundance >5-fold. Six out of the seven differences correspond to the loss of tags in the amplified library. Using the Fisher exact test with Bonferroni correction (P < 0.05), instead of fold change difference as above, we end up also with seven significantly discordant tags.
Figure 3.

Graphic representation of the correlation between the abundance of tags in the amplified and non-amplified libraries: (top) using the raw values of tag abundance per 10 000 tags in a direct plot; and (bottom) after variance-stabilizing transformation of the results as described in Materials and Methods (log scale). The two lines delineate a confidence interval for tags showing <5-fold variation.
DISCUSSION
One of our current aims is to apply the power of SAGE methodology to the identification of developmentally important transcripts in microdissected samples from mouse fetal tissue.
Standard protocols of the SAGE technique are not suited to this aim, and recent modifications, aimed at reducing the amount of starting material, all rely on PCR (8–10), which is expected to introduce representation biases. It is revealing that with one exception (12), none of these studies have validated their technique by comparing the results obtained from the same starting material with ‘classical’ SAGE and the micro-method. The authors of the SADE method (12) report a significant correlation (r = 0.88) between two small libraries obtained from the same kidney sample by the macro- and micro-method, but without showing the data.
Although under strict experimental conditions, PCR amplification has recently been shown to preserve cDNA representation in microarray experiments (25,26), the applicability of this procedure to the generation of representative (SAGE) cDNA libraries remains to be demonstrated. We have opted for a procedure which does not rely on additional PCR steps to generate SAGE libraries from small amounts of input RNA. It includes a loop of linear amplification with T7 RNA polymerase of the cDNA segments harboring the SAGE tags [i.e. extending from the most 3′ NlaIII site of the mRNA to the poly(A) tail]. The template for transcription by T7 RNA polymerase is made by ligating an adaptor containing the T7 polymerase promoter to NlaIII-cleaved cDNA (see Fig. 1). The linear character of the amplification by T7-dependent transcription has been shown to introduce minimal biases in the generation of cDNA libraries or in the preparation of labeled targets for microarray experiments (16,27,28). Except for the transcription step itself, which is targeted to amplification of the cDNA segment harboring the NlaIII-anchored tag, the present procedure does not introduce any extra enzymatic reaction in the classical SAGE protocol. This is expected to keep the representation biases associated with amplification as low as possible. As the cDNA template for transcription is immobilized on magnetic beads, it can be recovered quantitatively at the end of transcription and re-used in successive linear amplification cycles. Preliminary experiments indicate that this may allow for the generation of SAGE libraries from even smaller amounts of starting material.
Application of our protocol to total mouse thyroid RNA allowed preparation of SAGE tags in excess of 105 from 50 ng of starting material. When compared with a SAGE library prepared from 5 µg of the same RNA preparation according to an established protocol, the overall correlation was good (r = 0.75). This correlation compares well with microarray data of Iscove et al. (25) in which results obtained with PCR or linear amplification were compared with those from non-amplified samples. However, when individual tags were analyzed, significant discrepancies were observed, with under-representation of some relatively frequent tags in the amplified library. These differencies were observed for 4.5% of the most abundant tags. They are similar to those described previously for linear amplification in microarray experiments (16). This deviation is limited to a subpopulation of tags since it is not associated with a reduced overall complexity of the amplified library, and is not observed for less abundant tags. No direct or inverse correlation was found between the expected length of the mRNA segment containing the tag [from the NlaIII site to the poly(A) tail] and the deviation of representation between the two libraries (not shown). We presently have no explanation for these outliers. If one simulates gene hunting experiments with our method, it is expected that in the worst case (i.e. considering that the observed differences between the amplified and non-amplified libraries would apply to two similarly amplified libraries), a proportion of <4.5% false positives would be obtained, if one searches for transcripts with a differential expression of 5-fold or more. Although not negligible, this level of false positives may be acceptable in experiments in which the aim is identification of de novo gene induction. Also, from analysis of the available literature in which, with rare exceptions (12), correlations between standard and micro-methods are lacking, we are convinced that no current PCR-based method, be it for the generation of SAGE or standard cDNA libraries, does much better.
We conclude that our technique offers an interesting alternative to pre-PCR amplification in the preparation of SAGE libraries from small amounts of microdissected tissue samples. We expect it to be widely applicable during the current time window, when comprehensive microarrays covering all (alternative) transcripts are not widely available.
Acknowledgments
ACKNOWLEDGEMENTS
We thank J.-C. Goffard for the generous gift of mouse total RNA. C.V. is ‘Research Fellow’ of the Fonds National de la Recherche Scientifique. S.C. and F.L. are ‘Research Associates’ of the Fonds National de la Recherche Scientifique. D.V. is supported by the ‘Contrat Industriel de la Région Wallonne’. This study was supported by the Belgian State, Prime Minister’s office, Service for Sciences, Technology and Culture. Also supported by grants from the FRSM, FNRS and Association Recherche Biomédicale et Diagnostic. The scientific responsibility is assumed by the authors.
REFERENCES
- 1.Duggan D.J., Bittner,M., Chen,Y., Meltzer,P. and Trent,J.M. (1999) Expression profiling using cDNA microarrays. Nature Genet., 21, 10–14. [DOI] [PubMed] [Google Scholar]
- 2.Velculescu V.E., Zhang,L., Vogelstein,B. and Kinzler,K.W. (1995) Serial analysis of gene expression. Science, 270, 484–487. [DOI] [PubMed] [Google Scholar]
- 3.Polyak K. and Riggins,G.J. (2001) Gene discovery using the serial analysis of gene expression technique: implications for cancer research. J. Clin. Oncol., 19, 2948–2958. [DOI] [PubMed] [Google Scholar]
- 4.Logan M. (2002) SAGE profiling of the forelimb and hindlimb. Genome Biol., 3, REVIEWS1007. [DOI] [PMC free article] [PubMed] [Google Scholar]
- 5.Munasinghe A., Patankar,S., Cook,B.P., Madden,S.L., Martin,R.K., Kyle,D.E., Shoaibi,A., Cummings,L.M. and Wirth,D.F. (2001) Serial analysis of gene expression (SAGE) in Plasmodium falciparum: application of the technique to A–T rich genomes. Mol. Biochem. Parasitol., 113, 23–34. [DOI] [PubMed] [Google Scholar]
- 6.Chen J., Sun,M., Lee,S., Zhou,G., Rowley,J.D. and Wang,S.M. (2002) Identifying novel transcripts and novel genes in the human genome by using novel SAGE tags. Proc. Natl Acad. Sci. USA, 99, 12257–12262. [DOI] [PMC free article] [PubMed] [Google Scholar]
- 7.St Croix B., Rago,C., Velculescu,V., Traverso,G., Romans,K.E., Montgomery,E., Lal,A., Riggins,G.J., Lengauer,C., Vogelstein,B. et al. (2000) Genes expressed in human tumor endothelium. Science, 289, 1197–1202. [DOI] [PubMed] [Google Scholar]
- 8.Neilson L., Andalibi,A., Kang,D., Coutifaris,C., Strauss,J.F.,III, Stanton,J.A. and Green,D.P. (2000) Molecular phenotype of the human oocyte by PCR-SAGE. Genomics, 63, 13–24. [DOI] [PubMed] [Google Scholar]
- 9.Peters D.G., Kassam,A.B., Yonas,H., O’Hare,E.H., Ferrell,R.E. and Brufsky,A.M. (1999) Comprehensive transcript analysis in small quantities of mRNA by SAGE-lite. Nucleic Acids Res., 27, e39. [DOI] [PMC free article] [PubMed] [Google Scholar]
- 10.Datson N.A., Perk-de Jong,J., van den Berg,M.P., de Kloet,E.R. and Vreugdenhil,E. (1999) MicroSAGE: a modified procedure for serial analysis of gene expression in limited amounts of tissue. Nucleic Acids Res., 27, 1300–1307. [DOI] [PMC free article] [PubMed] [Google Scholar]
- 11.Ye S.Q., Zhang,L.Q., Zheng,F., Virgil,D. and Kwiterovich,P.O. (2000) miniSAGE: gene expression profiling using serial analysis of gene expression from 1 microg total RNA. Anal. Biochem., 287, 144–152. [DOI] [PubMed] [Google Scholar]
- 12.Virlon B., Cheval,L., Buhler,J.M., Billon,E., Doucet,A. and Elalouf,J.M. (1999) Serial microanalysis of renal transcriptomes. Proc. Natl Acad. Sci. USA, 96, 15286–15291. [DOI] [PMC free article] [PubMed] [Google Scholar]
- 13.Schober M.S., Min,Y.N. and Chen,Y.Q. (2001) Serial analysis of gene expression in a single cell. Biotechniques, 31, 1240–1242. [PubMed] [Google Scholar]
- 14.Eberwine J., Yeh,H., Miyashiro,K., Cao,Y., Nair,S., Finnell,R., Zettel,M. and Coleman,P. (1992) Analysis of gene expression in single live neurons. Proc. Natl Acad. Sci. USA, 89, 3010–3014. [DOI] [PMC free article] [PubMed] [Google Scholar]
- 15.Powell J. (1998) Enhanced concatemer cloning—a modification to the SAGE (serial analysis of gene expression) technique. Nucleic Acids Res., 26, 3445–3446. [DOI] [PMC free article] [PubMed] [Google Scholar]
- 16.Wang E., Miller,L.D., Ohnmacht,G.A., Liu,E.T. and Marincola,F.M. (2000) High-fidelity mRNA amplification for gene profiling. Nat. Biotechnol., 18, 457–459. [DOI] [PubMed] [Google Scholar]
- 17.Sotiriou C., Powles,T.J., Dowsett,M., Jazaeri,A.A., Feldman,A.L., Assersohn,L., Gadisetti,C., Libutti,S.K. and Liu,E.T. (2002) Gene expression profiles derived from fine needle aspiration correlate with response to systemic chemotherapy in breast cancer. Breast Cancer Res., 4, R3. [DOI] [PMC free article] [PubMed] [Google Scholar]
- 18.Ohyama H., Zhang,X., Kohno,Y., Alevizos,I., Posner,M., Wong,D.T. and Todd,R. (2000) Laser capture microdissection-generated target sample for high-density oligonucleotide array hybridization. Biotechniques, 29, 530–536. [DOI] [PubMed] [Google Scholar]
- 19.Marble H.A. and Davis,R.H. (1995) RNA transcription from immobilized DNA templates. Biotechnol. Prog., 11, 393–396. [DOI] [PubMed] [Google Scholar]
- 20.Pauws E., Moreno,J.C., Tijssen,M., Baas,F., de Vijlder,J.J. and Ris-Stalpers,C. (2000) Serial analysis of gene expression as a tool to assess the human thyroid expression profile and to identify novel thyroidal genes. J. Clin. Endocrinol. Metab., 85, 1923–1927. [DOI] [PubMed] [Google Scholar]
- 21.Vassart G., Refetoff,S., Brocas,H., Dinsart,C. and Dumont,J.E. (1975) Translation of thyroglobulin 33S messenger RNA as a means of determining thyroglobulin quaternary structure. Proc. Natl Acad. Sci. USA, 72, 3839–3843. [DOI] [PMC free article] [PubMed] [Google Scholar]
- 22.Muresan Z. and Arvan,P. (1998) Enhanced binding to the molecular chaperone BiP slows thyroglobulin export from the endoplasmic reticulum. Mol. Endocrinol., 12, 458–467. [DOI] [PubMed] [Google Scholar]
- 23.Nishimura R., Yokose,T. and Mukai,K. (1997) S-100 protein is a differentiation marker in thyroid carcinoma of follicular cell origin: an immunohistochemical study. Pathol. Int., 47, 673–679. [DOI] [PubMed] [Google Scholar]
- 24.Cox F., Gestautas,J. and Rapoport,B. (1988) Molecular cloning of cDNA corresponding to mRNA species whose steady state levels in the thyroid are enhanced by thyrotropin. Homology of one of these sequences with ferritin H. J. Biol. Chem., 263, 7060–7067. [PubMed] [Google Scholar]
- 25.Iscove N.N., Barbara,M., Gu,M., Gibson,M., Modi,C. and Winegarden,N. (2002) Representation is faithfully preserved in global cDNA amplified exponentially from sub-picogram quantities of mRNA. Nat. Biotechnol., 20, 940–943. [DOI] [PubMed] [Google Scholar]
- 26.Makrigiorgos G.M., Chakrabarti,S., Zhang,Y., Kaur,M. and Price,B.D. (2002) A PCR-based amplification method retaining the quantitative difference between two complex genomes. Nat. Biotechnol., 20, 936–939. [DOI] [PubMed] [Google Scholar]
- 27.Van Gelder R.N., von Zastrow,M.E., Yool,A., Dement,W.C., Barchas,J.D. and Eberwine,J.H. (1990) Amplified RNA synthesized from limited quantities of heterogeneous cDNA. Proc. Natl Acad. Sci. USA, 87, 1663–1667. [DOI] [PMC free article] [PubMed] [Google Scholar]
- 28.Baugh L.R., Hill,A.A., Brown,E.L. and Hunter,C.P. (2001) Quantitative analysis of mRNA amplification by in vitro transcription. Nucleic Acids Res., 29, e29. [DOI] [PMC free article] [PubMed] [Google Scholar]