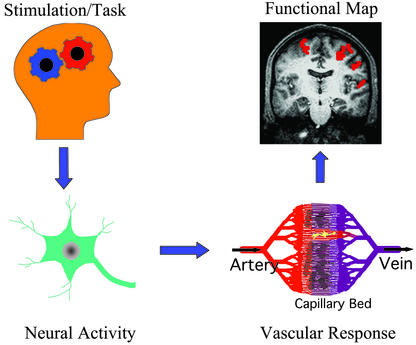
More than a century ago, Roy and Sherrington observed that a change in regional cerebral blood flow (CBF) could reflect neural activity (1). This concept is a basis for modern functional brain imaging technologies including functional magnetic resonance imaging (fMRI), positron emission tomography (PET), intrinsic optical imaging, and near infrared optical tomography. These methods have been extensively used to map various brain functions in humans and animals on a spatial scale of 50 micrometers to a few centimeters. To understand functional maps as “meaningful” neurophysiological parameter(s), a chain of events from behavior to functional signal recording should be understood (see Fig. 1). Task and/or stimulation induce synaptic and electric activities in localized regions, which will trigger changes in metabolic and hemodynamic responses including CBF. Then, brain mapping techniques detect a change in one or many vascular parameters, which can be displayed as a colorful functional image. However, the exact relationship between neural activity and a functional imaging signal is not well-understood. Therefore, understanding the physiological sources of the functional imaging signals is critically important as summed by Raichle, “We have at hand tools with the potential to provide unparalleled insights into some of the most important scientific, medical, and social questions facing mankind. Understanding those tools is clearly a high priority” (2).
Figure 1.
Schematic chain of processes from behavior to functional mapping.
This critical issue was investigated by Caesar et al. (3) in this issue of PNAS using rat cerebellum as a model, where excitatory and inhibitory neural activities in Purkinje cells can be controlled by climbing fiber and parallel fiber stimulations, respectively. When excitatory and inhibitory neural activities were independently modulated, CBF was detected by laser Doppler flowmeter. One important observation by Caesar et al. (3) is that blood flow response induced by neural activity is correlated with postsynaptic field potential activities, regardless of type of stimulus. Similar findings were also observed in rat somatosensory cortex and monkey visual cortex (4–8). The same conclusion was drawn whether inhibitory and excitatory stimuli were combined or either stimulation was used alone. Inhibitory synaptic activity increased CBF without producing any spiking activity (4), demonstrating that the action potential, by itself, does not significantly contribute to the CBF change. It should be noted that there is an alternative opinion that the spike activity is indeed an energy-consuming process and increases CBF (9). Generally, spiking patterns and rates (which can be measured by single-unit recordings) are the major interest of most neuroscientists. How can we interpret hemodynamic-based functional signals as a population of action potentials? It seems that we cannot consider
Regardless of stimulus, neural activity-induced blood flow response is correlated with postsynaptic activities.
the magnitude of functional imaging signals as an (even qualitative) index of neuronal action potentials. However, it has been observed, based on stimulation strength- (frequency, contrast, etc.) dependent studies, that the magnitude of the hemodynamic response in cerebrum is monotonically correlated with firing rates (5, 10–12). Taken together, the hemodynamic response is monotonically correlated with the synaptic activity (as shown by Caesar et al., ref. 3), which may be also related with the action potentials in the cerebrum, but probably not in the cerebellum. In fact, Logothesis et al. (5) demonstrated that the fMRI signal in monkey's visual cortex is correlated well with both multiunit activities and field potentials.
Another observation by Caesar et al. (3) is that the combined postsynaptic activity of sequential excitatory and inhibitory stimuli is greater than the activity induced by either of the two individual stimuli, but less than activity of the summation of two independent stimulations. When two stimuli are applied sequentially into the same region, the neural activity induced by the following stimulation is influenced by that of the preceding stimulation. During the “neural refractory” period, cells cannot recover fully from the neural activity induced by the preceding stimulation. This results in the reduction of the neural activity induced by subsequent stimulation. These electrical responsive properties of neurons can be investigated by using brain mapping techniques because the hemodynamic response is closely related to the magnitude of field potentials. Similarly, dynamics of neuronal activity over time can be measured by using the hemodynamic response.
An important but often ignored issue is how precisely the timing of neural activity can be measured from the sluggish hemodynamic response. Because the hemodynamic response takes a few seconds to be observed, it is considered that neural activity on the millisecond time scale is too fast to be resolved by hemodynamic-based imaging techniques. However, on some occasions, neural interaction can be detected by fMRI (6) using the property of temporal coupling between neural activity with refractoriness and CBF response (3). Travel times along different neuronal pathways can vary on the order of milliseconds; when a detection area includes the intersection of such pathways induced by multiple stimuli, the difference between the neuronal travel times can be measured. The slower neural activity is significantly reduced and possibly eliminated when it occurs within the neural refractory period induced by the preceding activity. Thus, by controlling onset times of two stimuli, the minimal hemodynamic response induced by two stimuli can be examined, providing a timing difference of the two neural pathways. Thus, the hemodynamic response can be used to detect neural timing differences by controlling input tasks (6).
Because hemodynamic response is closely related to synaptic activity, we might assume that the hemodynamic response is constant for as long as the neural activity remains constant (3). However, it is not rare to observe the hemodynamic refractoriness or the variation of hemodynamic response even though neural activity remains constant. When the interval between two stimulation periods is longer than 1 second (which is much longer than a neural refractory period), identical neural activity might be expected during the repeated stimulation periods. However, the hemodynamic response induced by the second stimulation is often less than that induced by the first stimulation (especially with intense stimulation strength), because of the hemodynamic refractoriness. Also, when the baseline vascular physiology differs because of various internal and external factors such as age, gender, and chemical substances, the hemodynamic response will modulate even if the same stimulus is used. For example, under low blood flow conditions induced by hyperventilation or by intake of vaso-constrictors such as caffeine, the stimulation-induced fMRI signal is enhanced compared with the normal condition (13). Under these conditions, the magnitude of hemodynamic response is not solely related to the intensity of neural activity.
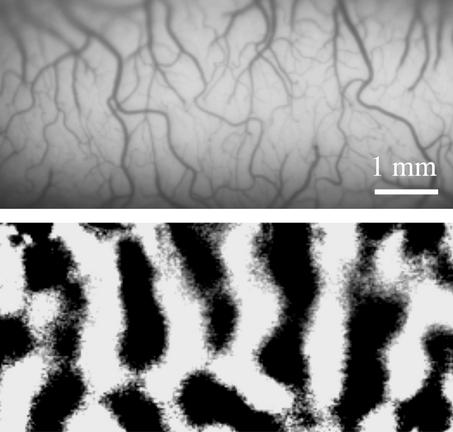
One major concern in the brain imaging community is how precisely can the hemodynamic signals pinpoint neural activity foci? Because the hemodynamic response is monotonically correlated with the magnitude of synaptic activity, as shown by Caesar et al. (3), we may consider that a region with higher hemodynamic signal has higher neural activity. However, this relationship is applicable only to parenchyma, and definitely not to regions with large vessels or cerebralspinal fluids. This issue was examined by Disbrow et al. (14) using anesthetized monkeys on a clinical scanner. They found that the overlap between fMRI signals (with 1.5 mm × 1.5 mm resolution) and electrophysiological foci was ≈50% and that the largest mismatch between the two measurements was located in areas close to large vessels. Thus, activation foci determined by fMRI may be shifted to large vessel regions. In typical human functional imaging studies with a few millimeters to a few centimeters spatial resolution, consequences of a large vessel contribution to imaging signals may not be serious because the shift of activation foci is relatively small. Nonetheless, to accurately localize neuronal active sites, it is important to remove “large vessel” contamination in functional signals. The large vessel contribution to fMRI and optical imaging signals can be reduced by using improved imaging and/or postprocessing technologies (15). For example, differential imaging methods [subtracting images obtained during one stimulus (e.g., 0° orientation) from those during orthogonal stimulus (e.g., 90° orientation)] have been used in intrinsic optical imaging and fMRI to remove nonspecific components (see Fig. 2).
Figure 2.
Intrinsic optical imaging of cat visual cortex. (Upper) Surface vascular patterns can be seen in a vessel-weighted image. (Lower) Dark patches indicate orientation columns induced by moving visual grids with 90° orientation. Image courtesy of M. Fukuda.
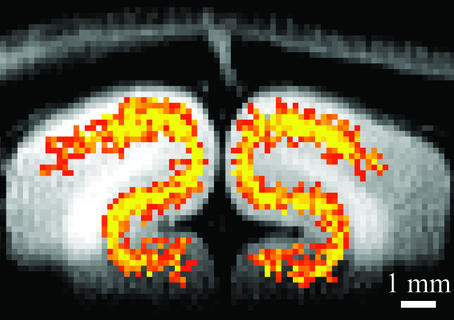
After the minimization of large vessel contribution, spatial resolution of hemodynamic-based techniques can depend on how finely blood flow is regulated. Malonek and Grinvald (16) used intrinsic optical imaging to investigate the spatial specificity of the hemodynamic response. They found that the hemodynamic response was not specific at the submillimeter functional level, describing the response as being analogous to “watering the whole garden for the sake of one thirsty flower” (16). However, intrinsic optical imaging signals contain significant contributions of large surface vessels, which may disperse reflected light into a larger area, resulting in a widespread response. Contrary to optical imaging studies (16), recent fMRI studies suggest that tissue-level CBF changes are specific to submillimeter functional domains (17). When tissue-specific functional imaging techniques are used, columnar and laminar functional images can be obtained (17) (see Fig. 3). This ability allows neuroscientists to visualize small computation modules of various functions and provides insights into how the brain works.
Figure 3.
Tissue-specific fMRI of the visual cortex. The highest activation (yellow) was detected at the middle cortical layers in gray matter. Tissue-specific hemodynamic responses can be used to map submillimeter columnar and laminar activity. Image courtesy of F. Zhao.
Overall, the systematic and careful work of Caesar et al. (3) clarified some outstanding issues in the brain mapping community. Postsynaptic field potential activity can be accurately inferred in time from sluggish hemodynamic-based imaging signals. To use close relationships between neural activity and CBF response, only parenchymal imaging signal should be detected. Caution should be exercised because this close coupling cannot be generalized for every condition and brain region. Future studies determining a chain of detailed events from behavior to generation of functional images can further elucidate the electrical and vascular physiological origins of functional imaging signals.
Footnotes
See companion article on page 4239.
References
- 1.Roy C S, Sherrington C S. J Physiol. 1890;1:85–108. doi: 10.1113/jphysiol.1890.sp000321. [DOI] [PMC free article] [PubMed] [Google Scholar]
- 2.Raichle M E. Proc Natl Acad Sci USA. 1998;95:765–772. doi: 10.1073/pnas.95.3.765. [DOI] [PMC free article] [PubMed] [Google Scholar]
- 3.Caesar K, Gold L, Lauritzen M. Proc Natl Acad Sci USA. 2003;100:4239–4244. doi: 10.1073/pnas.0635075100. [DOI] [PMC free article] [PubMed] [Google Scholar]
- 4.Lauritzen M. J Cereb Blood Flow Metab. 2001;21:1367–1383. doi: 10.1097/00004647-200112000-00001. [DOI] [PubMed] [Google Scholar]
- 5.Logothetis N K, Pauls J, Augath M, Trinath T, Oeltermann A. Nature. 2001;412:150–157. doi: 10.1038/35084005. [DOI] [PubMed] [Google Scholar]
- 6.Ogawa S, Lee T-M, Stepnoski R, Chen W, Zhu X-H, Ugurbil K. Proc Natl Acad Sci USA. 2000;97:11026–11031. doi: 10.1073/pnas.97.20.11026. [DOI] [PMC free article] [PubMed] [Google Scholar]
- 7.Brinker G, Bock C, Busch E, Krep H, Hossman K-A, Hoehn-Berlage M. Magn Reson Med. 1999;41:469–473. doi: 10.1002/(sici)1522-2594(199903)41:3<469::aid-mrm7>3.0.co;2-9. [DOI] [PubMed] [Google Scholar]
- 8.Mathiesen C, Caesar K, Akgoren N, Lauritzen M. J Physiol. 1998;512:555–566. doi: 10.1111/j.1469-7793.1998.555be.x. [DOI] [PMC free article] [PubMed] [Google Scholar]
- 9.Attwell D, Laughlin S B. J Cereb Blood Flow Metab. 2001;21:1133–1145. doi: 10.1097/00004647-200110000-00001. [DOI] [PubMed] [Google Scholar]
- 10.Arthurs O J, Boniface S. Trends Neurosci. 2002;25:27–31. doi: 10.1016/s0166-2236(00)01995-0. [DOI] [PubMed] [Google Scholar]
- 11.Heeger D J, Huk A C, Geisler W S, Albrecht D G. Nat Neurosci. 2000;3:631–633. doi: 10.1038/76572. [DOI] [PubMed] [Google Scholar]
- 12.Rees G, Friston K, Koch C. Nat Neurosci. 2000;3:716–723. doi: 10.1038/76673. [DOI] [PubMed] [Google Scholar]
- 13.Cohen E R, Ugurbil K, Kim S-G. J Cereb Blood Flow Metab. 2002;22:1042–1053. doi: 10.1097/00004647-200209000-00002. [DOI] [PubMed] [Google Scholar]
- 14.Disbrow E A, Slutsky D A, Roberts T P L, Krubitzer L A. Proc Natl Acad Sci USA. 2000;97:9718–9723. doi: 10.1073/pnas.170205497. [DOI] [PMC free article] [PubMed] [Google Scholar]
- 15.Kim S-G, Ogawa S. Curr Opin Neurobiol. 2002;12:607–615. doi: 10.1016/s0959-4388(02)00355-0. [DOI] [PubMed] [Google Scholar]
- 16.Malonek D, Grinvald A. Science. 1996;272:551–554. doi: 10.1126/science.272.5261.551. [DOI] [PubMed] [Google Scholar]
- 17.Duong T Q, Kim D-S, Ugurbil K, Kim S-G. Proc Natl Acad Sci USA. 2001;98:10904–10909. doi: 10.1073/pnas.191101098. [DOI] [PMC free article] [PubMed] [Google Scholar]


