Abstract
Cysteine plays a key role as a metal ligand in metalloproteins. In all well-recognized cases, however, it is the anionic cysteinate that coordinates. Several cysteinate-ligated heme proteins are known, but some fail to retain thiolate ligation in the ferrous state, possibly following protonation to form neutral cysteine. Ligation by cysteine thiol in ferrous heme proteins has not been documented. To establish spectroscopic signatures for such systems, we have prepared five-coordinate adducts of the ferrous myoglobin H94G cavity mutant with neutral thiol and thioether sulfur donors as well as six-coordinate derivatives such as with CO and, when possible, with NO and O2. A thiol-ligated oxyferrous complex is reported, to our knowledge for the first time. Further, a bis-thioether ferrous H93G model for bis-methionine ligation, as found in Pseudomonas aeruginosa bacterioferritin heme protein, is described. Magnetic CD spectroscopy has been used due to its established ability in axial ligand identification. The magnetic CD spectra of the H93G complexes have been compared with those of ferrous H175C/D235L cytochrome c peroxidase to show that its proximal ligand is neutral cysteine. We had previously reported this cytochrome c peroxidase mutant to be cysteinate-ligated in the ferric state, but the ferrous ligand was undetermined. The spectral properties of ferrous liver microsomal cytochrome P420 (inactive P450) are also consistent with thiol ligation. This study establishes that neutral cysteine can serve as a ligand in ferrous heme iron proteins, and that ferric cysteinate-ligated heme proteins that fail to retain such ligation on reduction may simply be ligated by neutral cysteine.
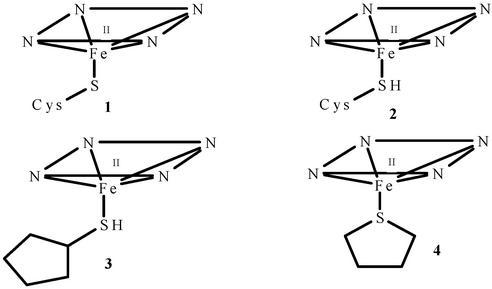
Cysteine serves as the proximal axial ligand in a number of heme enzymes, most notably the O2 activating enzymes cytochrome P450 and nitric oxide (NO) synthase (1). For catalytic activity, however, the cysteine must be deprotonated to cysteinate throughout the reaction cycle as the iron changes oxidation state from ferric to ferrous (1, Fig. 1) and ferryl states. The proximal cysteinate plays a key mechanistic role in providing a thiolate “push” (1–3), and various factors that stabilize thiolate ligation have been discussed (4, 5). Caldariomyces fumago chloroperoxidase also retains cysteinate coordination in all three oxidation states, although its reaction cycle does not involve ferrous heme (6).
Figure 1.
Five-coordinate sulfur donor-ligated ferrous heme adducts. 1, cysteine thiolate; 2, cysteine thiol; 3, CPSH; 4, THT.
A second set of cysteine-bound heme proteins has proximal cysteinate in the ferric but not the ferrous oxidation state. These proteins, which do not activate O2, include the CO-sensing CooA protein (7, 8) and cystathionine β synthase (9, 10).¶ Two related groups of heme proteins coordinated by cysteinate in ferric but not ferrous states are the proximal His-to-Cys mutants of myoglobin (Mb) (11, 12), heme oxygenase (13), and cytochrome c peroxidase (CCP) (14) and inactive forms of cytochrome P450 (P420) and chloroperoxidase (C420) (15, 16). The nature of the proximal ferrous ligand in these proteins is unclear except for CooA, which switches bound Cys-75 for His-77 after reduction. In some cases, neutral cysteine thiol has been suggested as a possible ferrous ligand (2) (8, 10, 15), and the mechanism of the CooA ligand switch has been proposed to go through a neutral cysteine-bound ferrous state before displacement by His (8).
To address the question of whether neutral cysteine is a reasonable ferrous heme ligand, we have investigated the binding of neutral thiol (cyclopentanethiol, CPSH) and thioether (tetrahydrothiophene, THT) sulfur donors to the ferrous H93G Mb (17) cavity mutant (3, 4). The study has involved the use of magnetic CD (MCD) spectroscopy, an especially well suited technique for investigating heme proteins of unknown axial coordination (18, 19). Axial ligands can often be identified by using MCD by comparing the spectra of structurally unknown heme centers to those of structurally defined heme complexes. MCD spectroscopy has been used for axial ligand determination in P450 (6), NO synthase (20), allene oxide synthase (21), and heme oxygenase (22). Previous studies from our laboratory have shown H93G Mb to be a versatile template for preparing heme iron ligand adducts of defined structure (4, 23, 24). In the present work, five-coordinate ferrous H93G complexes with two thiols and a thioether have been prepared as well as six-coordinate species such as with CO and, when possible, NO and O2. The resulting spectra have then been compared with parallel derivatives of ferrous H175C/D235L CCP to identify its proximal ligand. Earlier studies from our laboratories demonstrated that this CCP double mutant is coordinated by cysteinate in the ferric state, but the ferrous ligand was not identified (14).
Materials and Methods
Chemicals and Proteins.
Aldrich chemicals and Matheson gases were used. Imidazole-free sperm whale H93G Mb and H175C/D235L CCP were prepared as reported (14, 17, 25).
Sample Preparation.
Mb and CCP concentrations were determined by the pyridine hemochromogen method (26). Spectral measurements were obtained at 4°C with Mb (≈50 μM) in 100 mM potassium phosphate buffer at pH 7.0 as well as at pH 10.5 and with CCP (60–83 μM) in 50 mM potassium phosphate/50 mM KCl (pH 8.0) buffer (except Fig. 3, 50 mM potassium phosphate/75 mM KCl, pH 7.0) or at −40°C in a cryosolvent of ethylene glycol/buffer (60:40 vol/vol). For titration experiments, stock solutions of 20 mM CPSH or 30 mM THT in ethanol were added to 0.4 ml (l = 0.2 cm, [protein] = ≈50 μM] or 2 ml (l = 1 cm, [protein] = ≈5 μM) of dithionite-reduced protein under N2. Comparable amounts of ethanol did not produce spectral changes. Kd were determined by Hill and double reciprocal plots (27). Ferrous Mb samples were prepared by using solid Na2S2O4 under N2. The ferrous-CO and -NO Mb adducts were generated by addition of solid Na2S2O4, addition of THT or CPSH, and then gentle bubbling with CO or NO under N2 (23, 28). Ferrous-O2 complexes were formed at −40°C in a chest freezer by addition of minimal Na2S2O4 (from a 20 mg/ml solution) to an anaerobic ferric solution under N2, addition of THT or CPSH, and then thorough O2 bubbling. Ferrous-NO and -CO CCP samples were prepared by anaerobic addition of sodium dithionite followed by NO or CO.
Figure 3.
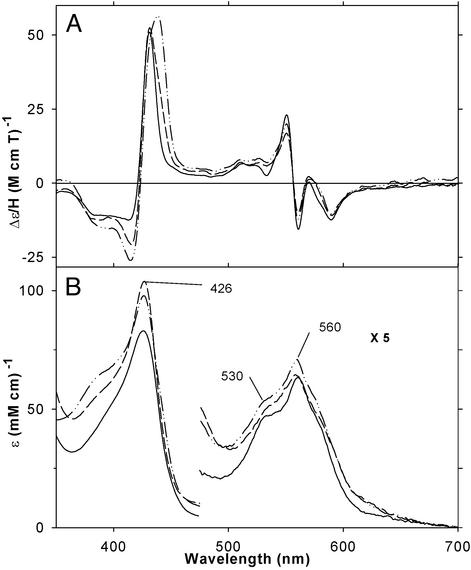
MCD (A) and EA (B) spectra at 4°C of ferrous H93G Mb in the presence of CPSH (480 μM) (dashed line) and THT (250 μM) (dash–dot–dot line) and of ferrous H175C/D235L CCP (solid line). See Materials and Methods for additional details.
Spectroscopic Techniques.
Electronic absorption (EA) spectra were recorded with a Varian Cary 400 spectrometer (at ≈4°C) or a Jasco (Easton, MD) J600A spectropolarimeter (at −40°C). MCD spectra were measured in a 0.2-cm cuvette at a magnetic field of 1.41 T with the Jasco J600A spectropolarimeter as described (29). Data acquisition and manipulation were done as reported (29), with Jasco software.
Results
In this study, we have used EA and MCD spectroscopy to investigate the binding of a neutral thiol and a thioether sulfur donors to ferrous H93G Mb and the formation of six-coordinate ferrous complexes such as with O2, CO, and NO. In parallel, we have studied ferrous H175C/D235L CCP (the proximal His-to-Cys mutant) and its complexes with CO and NO as well as ferrous cytochrome P420.
Thiol and Thioether Binding.
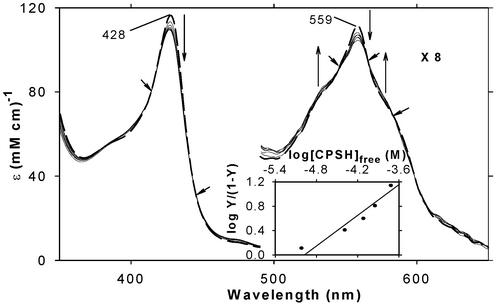
Fig. 2 shows the EA spectral changes that occur on stepwise addition of CPSH (20–240 μM) to dithionite-reduced ferrous H93G Mb (54 μM) under N2. Exogenous ligand-free ferrous H93G Mb exhibits an EA spectrum having a Soret peak at 428 nm and a prominent peak at 559 nm with flanking shoulders (≈530 and ≈575 nm) that is generally similar to those of other five-coordinate ferrous heme proteins such as Mb and horseradish peroxidase, except that the latter two proteins have somewhat red-shifted Soret peaks (at 434 and 436 nm, respectively). The spectral changes include a single set of two isosbestic points, indicated by small arrows, in the Soret region (300–500 nm) and three additional isosbestic points in the visible region (500–700 nm). Addition of more CPSH up to 1 mM caused very little further EA changes. The titration data were analyzed by using the Hill plot (see Data Analysis in ref. 27), which (Fig. 2 Inset) yielded a straight line with a slope of near unity (n = 0.80 ± 0.05) with an x axis intercept value of log [CPSH]free (in M) = ≈−5.0, indicating that ferrous H93G Mb and CPSH form a 1:1 (mol/mol) complex with a Kd value of ≈10 μM. Similar results were obtained with THT (Kd = ≈10 μM, Hill plot slope = ≈0.8; see Figs. 8A and 9, which are published as supporting information on the PNAS web site, www.pnas.org).
Figure 2.
EA spectral changes on titration of ferrous H93G Mb (54 μM) with CPSH at 4°C. Vertical arrows indicate the directions of absorbance change on addition of 0 (thick dashed line), 20, 40, 80, 120, 160, and 240 μM CPSH. The short arrows show isosbestic points. Hill plot of the titration data (absorbance change at 428 nm) is shown in Inset. In the y axis label, Y is fractional saturation of H93G Mb with CPSH. Thus, Y/(1-Y) = [CPSH-bound Mb]/[CPSH-free Mb]. Note that, based on separate titration data (not shown), Y = 0.93 was used at [CPSH] = 240 μM. In addition, because of the inherent difficulty in obtaining the free thiol concentration at low [CPSH]total, due to the very tight binding (high affinity), the data point at [CPSH]total = 20 μM was not used for the plot.
A secondary spectral change involving an increase in Soret peak intensity with new isosbestic points was observed at higher THT concentrations (2–31 mM, maximum solubility) (Kd = ≈66 mM at 4°C, Hill plot slope = ≈1.1, see Figs. 8B and 9) that became more prominent at −40°C (see below). Spectral changes at higher CPSH concentrations were not readily observed at 4°C but were clearly seen at −40°C (see below). Addition of imidazole (up to 2.5 mM) to mono THT-bound ferrous H93G Mb ([THT] = 2 mM) at 4°C resulted in formation of a five-coordinate ferrous–imidazole complex (23, 30), indicating that imidazole simply displaces THT from the ferrous heme iron rather than forming a THT–heme–imidazole six-coordinate complex. This suggests that THT and imidazole coordinate to the same site, i.e., presumably the proximal binding site as has been demonstrated for imidazole (30).
At pH 10.5, ferrous H93G Mb exhibits EA (not shown) and MCD spectra that are similar to those at pH 7.0 (Fig. 10, which is published as supporting information on the PNAS web site) except for ≈2-fold enhanced intensity for the derivative-shaped MCD spectrum centered at ≈555 nm and an only slightly (by 1 nm) red-shifted Soret MCD peak (at 429 nm) at pH 10.5. Ferrous H93G Mb forms a complex with CPSH at pH 10.5, whose Kd value (≈15 μM) and EA and MCD spectra (not shown) are also similar to those at pH 7.0 except for a more intense (by ≈1.8 times) visible region derivative-shaped MCD spectrum and slightly red-shifted (by ≈2 nm) MCD Soret peak (at 431 nm) as compared with those at pH 7.0. These pH-dependent subtle spectral differences for deoxyferrous H93G Mb and its CPSH complex are most likely due to the presence of a small amount of six-coordinate species at pH 10.5, as discussed for ferrous P420 (see below).
The CCP Double Mutant.
In Fig. 3, the MCD and EA spectra of the THT and CPSH adducts of ferrous H93G Mb at pH 7.0 are plotted and compared with those of the ferrous H175C/D235L CCP double mutant. The MCD spectrum of exogenous ligand-free H93G Mb (Fig. 10) is similar to that of its adduct with THT or CPSH but has a somewhat higher Soret peak intensity (≈65 M−1⋅cm−1⋅T−1). The ferrous THT and CPSH H93G Mb adducts have Soret EA peaks at around 426 nm, almost identical in wavelength to that of the H175C/D235L CCP double mutant. It should be noted that ferrous H175C/D235L CCP could be reversibly converted back to the cysteinate-ligated ferric state (14) by anaerobic oxidation with potassium ferricyanide. When the reoxidation was done with air, a new ill-defined ferric species was obtained, possibly due to oxidative modification of the proximal Cys sulfur (14).
Ferrous-O2 Adducts.
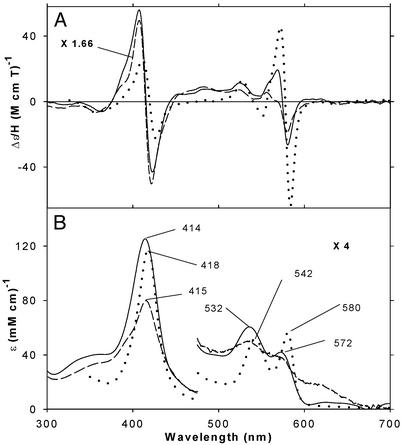
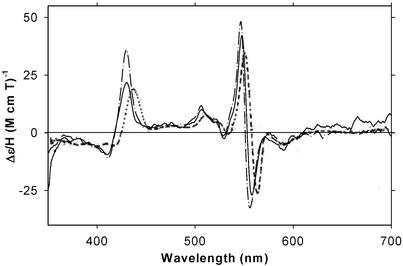
The −40°C MCD and EA spectra of the oxyferrous complexes of H93G Mb ligated by THT and CPSH are displayed in Fig. 4 together with the corresponding spectra of oxyferrous wild-type Mb (−10°C) (32). After the MCD and EA spectral measurements, CO gas was bubbled into the H93G Mb samples while keeping them in a dry ice/butanol bath (−58°C). By this treatment, nearly complete (>90% for THT) or partial (60–70% for CPSH) conversion to their ferrous–CO complexes was observed. The extent of conversion was judged from the magnitude of the further spectral changes at −40°C on addition (at 4°C) of sodium dithionite to completely reduce any autoxidized heme in the CO-bubbled samples. Conversion of the oxyferrous samples to the ferrous–CO state confirms that the former were predominantly oxyferrous complexes. Partial autoxidation of the oxyferrous CPSH-H93GMb sample is also evident from the presence of extra absorption bands at ≈630 and ≈390 nm and from the difference in the MCD spectral band pattern seen in the 500- to 600-nm region between the THT- and CPSH-containing samples. Once formed, the oxyferrous complexes of both THT- and CPSH H93G Mb were stable at −40°C for at least 1 h. Exogenous ligand-free H93G Mb did not form an oxyferrous complex under these conditions.
Figure 4.
MCD (A) and EA (B) spectra of oxyferrous H93G Mb at −40°C in the presence of CPSH (5 mM) (solid line; MCD data enlarged 1.66-fold) and THT (5 mM) (dashed line) and of oxyferrous wild-type Mb at −10°C (dotted line; replotted from data in ref. 32). See Materials and Methods for additional details.
Cytochrome P420.
The enzymatically inactive P420 form of cytochrome P450–2B4 (P450), generated by high salt treatment, is spectrally distinct from native P450–2B4 in the ferrous (Soret peak ≈426 nm for P420 vs. ≈410 nm for P450) and ferrous–CO states (≈420 vs. ≈450 nm) (33). The MCD spectrum of ferrous P420 (dashed line, Fig. 5) is similar to that of p-nitrothiophenol-bound ferrous H93G Mb that exhibits slight pH-dependent spectral intensities (solid line at pH 10.5 and dash–dot–dot line at pH 7.0 in Fig. 5). The EA spectra of p-nitrothiophenol- and thiophenol-bound ferrous H93G Mb (≈60 μM thiol, not shown) exhibit somewhat more pronounced and blue-shifted visible region peaks at 522 and 552 nm and also a blue-shifted Soret peak at ≈420 nm at 4°C at both pH values than that of the CPSH complex (Fig. 2), likely due to partial six coordination.
Figure 5.
MCD spectra at 4°C of ferrous P420 at pH 7.4 (dashed line; replotted from data in ref. 33) and ferrous H93G Mb in the presence of p-nitrothiophenol (60 μM) at pH 7.0 (dash–dot–dot line) and pH 10.0 (solid line).
Ferrous-CO Adducts.
Addition of CO to THT- and CPSH-ligated ferrous H93G Mb and to H175C/D235L CCP results in adducts having Soret absorption bands at ≈422 nm (see Fig. 11, which is published as supporting information on the PNAS web site). MCD spectral patterns and intensities for the three CO complexes are very similar to each other (Fig. 11) and also to those of His (or imidazole)-ligated ferrous-CO heme proteins such as H93G Mb (imidazole) (23).
Ferrous-NO Adducts.
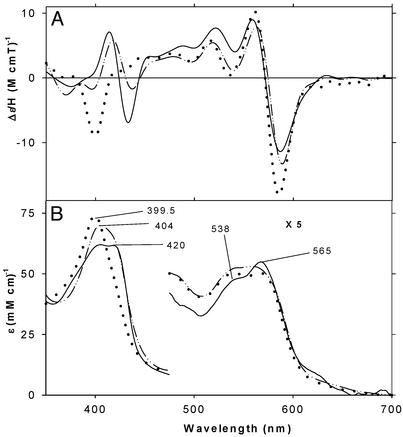
Addition of NO to THT-ligated ferrous H93G Mb and to ferrous H175C/D235L CCP generates complexes with similar spectral characteristics. The EA and MCD spectra of ferrous-NO H93G Mb (16 mM THT) and H175C/D235L CCP are plotted together in Fig. 6. In comparison, the corresponding spectra of ferrous-NO H93G Mb, which has been shown to form a nearly homogenous five-coordinate species in the presence of imidazole at relatively low concentration (≈0.1 mM) (23, 34), are overlaid. These three ferrous-NO heme complexes exhibit a Soret EA peak at ≈400 nm and a band at ≈480 nm in common indicating the presence of five-coordinate ferrous-NO species (35, 36). For CCP and H93G Mb (+16 mM THT), an additional Soret band or shoulder is seen at ≈420 nm that is likely originating from a six-coordinate species (34). MCD spectral characteristics of these ferrous–NO complexes are described in Discussion.
Figure 6.
MCD (A) and EA (B) spectra at 4°C of ferrous-NO adducts of H175C/D235L CCP (solid line) and of H93G Mb in the presence of THT (20 mM) (dash–dot–dot) and of ferrous-NO H93G Mb (+0.1 mM imidazole) (dotted line; replotted from data in refs. 23 and 34). See Materials and Methods for additional details.
Bis-Thiol/Thioether Ligation.
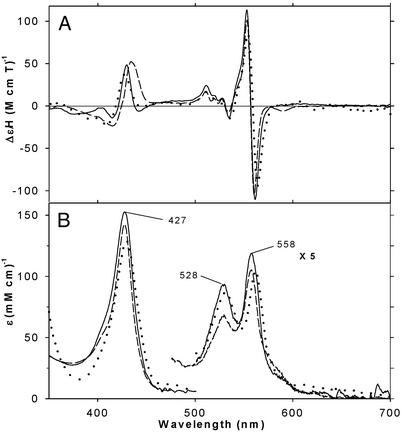
Finally, ferrous low-spin complexes of H93G Mb in the presence of higher THT and CPSH concentrations (see above) were prepared at low temperature (−40°C) and examined by MCD and EA spectroscopy (Fig. 7). Apparently homogenous six-coordinate low-spin complexes, presumably bis-THT and bis-CPSH adducts, were formed under the conditions used (60% vol/vol ethylene glycol, 5 mM ligand). EA peaks are seen at 427, 528, and 558 nm with MCD spectra consisting of sharp derivative-shaped and quite intense (±110 M−1⋅cm−1⋅T−1) visible bands centered at 557 nm and a mainly positive Soret feature at 429 (THT) and 435 (CPSH) nm (≈50 M−1⋅cm−1⋅T−1). Also shown in Fig. 7 are the calculated EA and MCD spectra (dotted lines) of a homogeneous bis-THT adduct of ferrous H93G Mb at 4°C (see Fig. 7 legend for details). Except for minor differences in peak/trough positions and intensities, the calculated EA and MCD spectra (dotted lines, at 4°C) and the low-temperature (−40°C) spectra (solid lines) are very similar to each other, indicating that the effects of the cryosolvent (60% ethylene glycol), if any, are relatively small. In the same cryosolvent at −40°C, ligand-free ferrous H93G Mb shows partially six-coordinate characteristics (spectrum not shown; see Discussion for more specific spectral descriptions for six-coordinate ferrous heme systems). However, it has a relatively intense Soret MCD peak (80 M−1⋅cm−1⋅T−1 at 429 nm), indicating that the ligand-free ferrous H93G Mb is still predominantly five-coordinate high spin at −40°C.
Figure 7.
MCD (A) and EA (B) spectra of bis-THT ([THT] = 5 mM; solid line) and partially bis-CPSH ([CPSH] = 5 mM; dashed line) complexes of ferrous H93G Mb at −40°C. See Materials and Methods for additional details. Calculated EA and MCD spectra of a homogeneous bis-THT adduct (a) (dotted line) and MCD of ferrous H93G Mb at 4°C, were obtained from titration data shown in Fig. 8B by extrapolation to 100% bis-THT saturation (a), based on the mono-THT ([THT] = 1 mM) (b) and partially (32%) saturated (with second THT) bis-THT ([THT] = 30.5 mM) ferrous H93G Mb (c) by: (a) = (b) + (100/32){(c)–(b)}.
Discussion
Ligation of Ferrous Heme Iron by Neutral Sulfur Donors.
Titration of exogenous ligand-free five-coordinate ferrous H93G Mb with CPSH (Fig. 2) leads cleanly to formation of a five-coordinate thiol-bound ferrous heme adduct (i.e., 1:1 ligand/heme iron complex) as judged by the determination of a Hill coefficient of close to unity. Similar data show that THT also forms a five-coordinate ferrous heme derivative (Figs. 8A and 9). Both ligands bind tightly to the ferrous heme iron with Kd values of 10–15 μM. Clearly the endogenous non-His axial ligand in ferrous H93G Mb [a five-coordinate species (31)], possibly water (31), can be readily replaced by neutral sulfur donor ligands.
The respective EA and MCD spectra of these species are quite similar to each other (Fig. 3). The MCD spectra are similar to those of high-spin ferrous heme complexes with a neutral fifth ligand such as imidazole (18, 19, 23) in having an asymmetric derivative-shaped band in the Soret region (300–500 nm) as the dominant feature with less intense peaks and troughs in the visible region (500–700 nm). Nonetheless, the spectra of the thiol- and thioether-ligated ferrous H93G Mb, while similar in general band pattern to that of five-coordinate imidazole-ligated ferrous wild-type Mb, are distinct in being less than half as intense in the Soret region and having a dissimilar and more intense derivative-shaped band pattern in the visible region. The data in Figs. 2 and 3 clearly demonstrate that well-behaved five-coordinate ferrous heme complexes with neutral thiol and thioether sulfur donor ligands (3, 4) can be prepared with H93G Mb.
We conclude that the thiol bound to ferrous H93G Mb is the neutral proton-bearing thiol, because its EA (Soret peak at 428 nm) (Fig. 3) spectra are quite distinct from those of thiolate-coordinated ferrous heme complexes such as in deoxyferrous P450 and its protein-free models (Soret peak at 408–412 nm) (6). The absence of a significant pH effect (between pH 7 and 10.5) on the EA and MCD spectra of the CPSH-bound ferrous H93G Mb additionally supports this conclusion. In addition, the Mb coordination site is not designed to bind anionic ligands in the ferrous state.
From the five-coordinate thiol and thioether ferrous H93G Mb adducts, six-coordinate derivatives with O2, CO, and, for thioether, with NO as the sixth ligand can be generated. Complexes of ferrous H93G Mb with two thioether or thiol ligands have also been made. These species have been characterized by EA and MCD spectroscopy (Figs. 4, 6, 7, and 11).
The MCD and EA spectra of thiol- and thioether-ligated oxyferrous H93G, stabilized at −40°C, are displayed in Fig. 4. A ferrous picket fence porphyrin thioether/O2 adduct has been reported by Collman and coworkers (37); however, this is the first example, to our knowledge, of a thiol-bound ferrous dioxygen adduct. Complex formation was reversible, as judged by the displacement of O2 by CO (data not shown), indicating that on reaction with dioxygen, the heme iron remains ferrous without appreciable oxidation to the ferric state. Some autoxidation apparently occurs in forming the thiol/O2 adduct, as judged by the minor EA shoulder at ≈620 nm (Fig. 4B). The MCD spectra of the oxyferrous H93G complexes have very similar band patterns to each other that are, in turn, generally typical of those observed for most oxyferrous heme iron species as exemplified by wild-type oxyferrous Mb (Fig. 4A). This band pattern consists of a derivative-shaped Soret feature and additional positive peaks in the visible region with another derivative-shaped term near 580 nm. In detail, however, the spectra of the thiol- and thioether-ligated oxyferrous derivatives differ noticeably from that of oxyferrous Mb in the relative Soret and visible region intensities, with the spectrum of oxyferrous Mb being more intense in the visible region in contrast to the more intense Soret features seen with the neutral sulfur donor oxyferrous species.
The MCD spectra of the thiol- and thioether-ligated ferrous-CO H93G derivatives are very similar to each other (Fig. 11). Both are typical of spectra reported for several heme complexes with neutral ligands trans to CO (18, 19, 37); only the thiolate-ligated ferrous-CO heme has unique EA and MCD spectral properties (6). The MCD spectrum of the thioether-ligated ferrous–NO H93G Mb adduct is overlaid in Fig. 6A with the spectra of the five-coordinate ferrous-NO H93G Mb state (23, 34) and of ferrous-NO H175C/D235L CCP. The distinctive feature in the spectrum of the five-coordinate species is the trough at ≈400 nm (−10 M−1·cm−1·T−1), whereas the most characteristic aspect of the latter spectrum is the derivative-shaped feature centered at ≈420 nm that is typical of six-coordinate ferrous-NO derivatives of heme proteins such as wild-type Mb (23). Thus, the MCD spectrum of ferrous-NO H175C/D235L CCP (Fig. 6A, solid line) represents a unique example for a neutral thiol-ligated ferrous-NO heme complex (see ref. 34). The spectrum of THT-ligated ferrous-NO H93G Mb suggests a mixture of five and six coordination with both a small trough at 400 nm and a derivative-shaped band pattern centered just above 420 nm.
The bis–thioether and bis–thiol complexes have MCD spectra (Fig. 7A) that follow the general pattern seen for low-spin six-coordinate ferrous heme iron systems (18, 19, 23) with weak peaks in the Soret region (≈50 M−1⋅cm−1⋅T−1 at ≈430 nm), an additional unique spectral pattern between 510 and 535 nm consisting of three small sharp peaks, and an intense derivative-shaped band at ≈555 nm. The two EA spectra are similar to each other (Fig. 7B). Of particular note, the spectrum of bis-THT ferrous H93G has its three major features at 427, 529, and 558 nm (Fig. 7B), essentially identical to peaks reported for two bis-Met-ligated ferrous cytochrome b562 mutants (λmax: 430, 426; 530, 528; and 561.5, 557 nm) (39). Pseudomonas aeruginosa bacterioferritin heme protein is a naturally occurring bis-Met-coordinated heme protein (40); bis-thioether-ligated ferrous (and ferric, data not shown) H93G Mb therefore provides a protein-based model system with which to probe the spectral properties of heme proteins with two axial methionines.
The Coordination Structure of H175C/D235L CCP.
The MCD spectrum of deoxyferrous H175C/D235L CCP closely matches those of both five-coordinate H93G complexes with CPSH and THT (Fig. 3). This provides strong evidence for neutral cysteine as the proximal ligand to ferrous H175C/D235L CCP. This CCP double mutant is cysteinate-ligated in the ferric state, but the ferrous protein does not retain bound cysteinate; the ferrous axial ligand was not identified (14). Additional support for the assignment of thiol coordination in the ferrous CCP double mutant comes from the close similarity between the MCD (Figs. 11A and 6A) and EA (Figs. 11B and 6B) spectra of the ferrous-CO and ferrous-NO derivatives to the respective spectra of the parallel ferrous H93G complexes with CPSH and THT trans to CO and (for THT) NO. As previously discussed (18, 19, 38), the spectra of ferrous-CO heme adducts with any type of neutral ligand trans to CO tend to be similar to each other. Nevertheless, taken as a whole, the spectra of the ferrous CCP double mutant, especially in the deoxyferrous state (Fig. 3), are most consistent with the assignment of neutral cysteine as the proximal ligand. This indicates that the anionic cysteinate coordinated in the ferric state (14) is protonated to form neutral cysteine, rather than being replaced, on reduction to the ferrous state.
The Coordination Structure of Liver Microsomal Cytochrome P420.
P450 forms an inactive spectroscopically distinct form called P420 because its ferrous-CO derivative absorbs maximally at 420 rather than at 450 nm. Although different P450 isozymes generate dissimilar P420 forms, identifying the changes that occur during inactivation can still provide important information about factors important for P450 activity (15). During the present study, we observed that the MCD spectrum (33) of the P420 form of liver microsomal P450 (P450–2B4) closely matches that of the five-coordinate ferrous H93G para-nitrothiophenol adduct (Fig. 5). The latter spectrum is generally similar to those displayed in Fig. 2 for CPSH- and THT-ligated ferrous H93G, but the central derivative-shaped visible regions feature is more prominent (Fig. 5). These spectral features of ferrous P420 and p-nitrothiophenol- (and thiophenol-) bound ferrous H93G Mb suggest that these ferrous proteins are not exclusively five-coordinate species, i.e., they are mainly high spin (S = 2) five-coordinate, but with a low-spin (S = 0) six-coordinate component. Subtle variations in spectral properties as a function of the exact thiol donor properties in five-coordinate ferric-thiolate H93G complexes have been reported (4); presumably the highly polarizable sulfur is especially sensitive to the nature of its aliphatic or aromatic component, or, in a protein, to the extent of hydrogen bonding and the polarity of the environment. The close similarity between the two MCD spectra in Fig. 5 that clearly differ from those of either five- or six-coordinate ferrous heme complexes having a thiolate ligand (6, 41) argues that this ferrous P420 is thiol bound and that P450–2B4 inactivation involves protonation of the cysteinate on heme iron reduction.
Conclusion and Implications for Heme Proteins That Lose Cysteinate Ligation on Reduction.
The present results using H93G Mb demonstrate that neutral thiols and thioethers can form well-behaved ferrous heme complexes and, therefore, that neutral cysteine is a plausible ligand in ferrous heme proteins. A number of heme proteins that are cysteinate-bound in the ferric state do not retain such coordination in the ferrous state. This includes the above-mentioned two examples: the proximal Cys-ligated CCP mutant and P420. The others are the CO-sensing CooA protein (7, 8, ¶), additional proximal His-to-Cys mutants such as with Mb (11, 12) and heme oxygenase (13), the inactive P420 forms of other P450s (15), and the inactive C420 form of chloroperoxidase (16). Ferric CooA is known to switch coordination from Cys-75 to His-77 after reduction. Rapid-scan absorption and freeze-quench studies of the ligand switch led to the proposal that cysteinate sulfur is first protonated after reduction and then it is neutral cysteine that is displaced by His (8). The present data suggest that a neutral cysteine-bound intermediate is feasible. In summary, the suggestion that uncharged cysteine thiol may be a ligand to ferrous heme iron (8, 10, 15) is borne out by the current results in which stable well-behaved complexes of ferrous H93G Mb with both thiol and thioether neutral sulfur donors are reported. Thus, the thiol form of cysteine is a plausible ligand for ferrous heme proteins (2, Fig. 1).
Supplementary Material
Acknowledgments
We thank Professor Steven G. Boxer for the H93G expression system. We are grateful for support from the National Institutes of Health (to J.H.D. and Y.L.) and Research Corporation (to J.H.D.).
Abbreviations
- MCD
magnetic CD
- EA
electronic absorption
- Mb
myoglobin
- CCP
cytochrome c peroxidase
- THT
tetrahydrothiophene
- CPSH
cyclopentanethiol
Footnotes
This paper was submitted directly (Track II) to the PNAS office.
Cystathionine β synthase, formerly hemoprotein H450, is thiolate-ligated in the ferrous state at alkaline pH, but not at acidic pH or when CO is bound (10).
References
- 1.Sono M, Roach M P, Coulter E D, Dawson J H. Chem Rev. 1996;96:2841–2887. doi: 10.1021/cr9500500. [DOI] [PubMed] [Google Scholar]
- 2.Dawson J H, Holm R H, Trudell J R, Barth G, Linder R E, Bunnenberg E, Djerassi C, Tang S C. J Am Chem Soc. 1976;98:3707–3709. doi: 10.1021/ja00428a054. [DOI] [PubMed] [Google Scholar]
- 3.Dawson J H. Science. 1988;240:433–439. doi: 10.1126/science.3358128. [DOI] [PubMed] [Google Scholar]
- 4.Roach M P, Pond A E, Thomas M R, Boxer S G, Dawson J H. J Am Chem Soc. 1999;121:12088–12093. [Google Scholar]
- 5.Poulos T L. J Biol Inorg Chem. 1996;1:356–359. [Google Scholar]
- 6.Dawson J H, Sono M. Chem Rev. 1987;87:1255–1276. [Google Scholar]
- 7.Shelver D, Thorsteinsson M V, Kerby R L, Chung S Y, Roberts G P, Reynolds M F, Parks R B, Burstyn J N. Biochemistry. 1999;38:2669–2678. doi: 10.1021/bi982658j. [DOI] [PubMed] [Google Scholar]
- 8.Nakajima H, Nakagawa E, Kobayashi H, Tagawa S, Aono S. J Biol Chem. 2001;276:37895–37899. doi: 10.1074/jbc.M105429200. [DOI] [PubMed] [Google Scholar]
- 9.Green E L, Taoka S, Banerjee R, Loehr T M. Biochemistry. 2001;40:459–463. doi: 10.1021/bi0010874. [DOI] [PubMed] [Google Scholar]
- 10.Svastits E W, Alberta J A, Kim I, Dawson J H. Biochem Biophys Res Commun. 1989;165:1170–1177. doi: 10.1016/0006-291x(89)92725-3. [DOI] [PubMed] [Google Scholar]
- 11.Adachi S, Nagano S, Watanabe Y, Ishimori K, Morishima I. Biochem Biophys Res Commun. 1991;180:138–144. doi: 10.1016/s0006-291x(05)81266-5. [DOI] [PubMed] [Google Scholar]
- 12.Hildebrand D P, Ferrer J C, Tang H-L, Smith M, Mauk A G. Biochemistry. 1995;34:11598–11605. doi: 10.1021/bi00036a036. [DOI] [PubMed] [Google Scholar]
- 13.Liu Y, Moenne-Loccoz P, Hildebrand D P, Wilks A, Loehr T M, Mauk A G, Ortiz de Montellano P R. Biochemistry. 1999;38:3733–3743. doi: 10.1021/bi982707s. [DOI] [PubMed] [Google Scholar]
- 14.Sigman J A, Pond A E, Dawson J H, Lu Y. Biochemistry. 1999;38:11122–11129. doi: 10.1021/bi990815o. [DOI] [PubMed] [Google Scholar]
- 15.Martinis S A, Blanke S R, Hager L P, Sligar S G, Hui Bon Hoa G, Rux J J, Dawson J H. Biochemistry. 1996;35:14530–14536. doi: 10.1021/bi961511u. [DOI] [PubMed] [Google Scholar]
- 16.Blanke S R, Martinis S A, Sligar S G, Hager L P, Rux J J, Dawson J H. Biochemistry. 1996;35:14537–14543. doi: 10.1021/bi961512m. [DOI] [PubMed] [Google Scholar]
- 17.Barrick D. Biochemistry. 1994;33:6546–6554. doi: 10.1021/bi00187a023. [DOI] [PubMed] [Google Scholar]
- 18.Dawson J H, Dooley D M. In: Iron Porphyrins, Part 3. Lever A B P, Gray H B, editors. New York: VCH; 1989. pp. 1–135. [Google Scholar]
- 19.Cheek J, Dawson J H. In: Handbook of Porphyrins and Related Macrocycles. Kadish K, Smith K, Guilard R, editors. Vol. 7. New York: Academic; 2000. pp. 339–369. [Google Scholar]
- 20.Sono M, Stuehr D J, Ikeda-Saito M, Dawson J H. J Biol Chem. 1995;270:19943–19948. doi: 10.1074/jbc.270.34.19943. [DOI] [PubMed] [Google Scholar]
- 21.Abraham B D, Sono M, Boutard O, Shriner A, Dawson J H, Brash A R, Gaffney B J. Biochemistry. 2001;40:2251–2259. doi: 10.1021/bi002121h. [DOI] [PubMed] [Google Scholar]
- 22.Hawkins B K, Wilks A, Powers L S, Ortiz de Montellano P R, Dawson J H. Biochim Biophys Acta. 1996;1295:165–173. doi: 10.1016/0167-4838(96)00031-3. [DOI] [PubMed] [Google Scholar]
- 23.Pond A E, Roach M P, Thomas M R, Boxer S G, Dawson J H. Inorg Chem. 2000;39:6061–6066. doi: 10.1021/ic0007198. [DOI] [PubMed] [Google Scholar]
- 24.Dawson J H, Pond A E, Roach M P. Biopolymers (Biospectroscopy) 2002;67:200–206. doi: 10.1002/bip.10087. [DOI] [PubMed] [Google Scholar]
- 25.Yeung B K, Wang X, Sigman J A, Petillo P A, Lu Y. Chem Biol. 1997;4:215–221. doi: 10.1016/s1074-5521(97)90291-x. [DOI] [PubMed] [Google Scholar]
- 26.Fuhrhop J-H, Smith K M. In: Porphyrins and Metalloporphyrins. Smith K M, editor. Amsterdam: Elsevier; 1975. pp. 804–807. [Google Scholar]
- 27.Sono M, Andersson L A, Dawson J H. J Biol Chem. 1982;257:8308–8320. [PubMed] [Google Scholar]
- 28.Yonetani T, Yamamoto H, Erman J E, Leigh J S, Jr, Reed G S. J Biol Chem. 1972;247:2447–2455. [PubMed] [Google Scholar]
- 29.Huff A M, Chang C K, Cooper D K, Smith K M, Dawson J H. Inorg Chem. 1993;32:1460–1466. [Google Scholar]
- 30.Decatur S M, Boxer S G. Biochemistry. 1995;34:2122–2129. doi: 10.1021/bi00007a004. [DOI] [PubMed] [Google Scholar]
- 31.Franzen S, Bailey J, Dyer R B, Woodruff W H, Hu R B, Thomas M R, Boxer S G. Biochemistry. 2001;40:5299–5305. doi: 10.1021/bi0023403. [DOI] [PubMed] [Google Scholar]
- 32.Sono M, Eble K S, Dawson J H, Hager L P. J Biol Chem. 1985;260:15530–15535. [PubMed] [Google Scholar]
- 33.Dawson J H, Trudell J R, Linder R E, Barth G, Bunnenberg E, Djerassi C. Biochemistry. 1978;17:33–42. doi: 10.1021/bi00594a006. [DOI] [PubMed] [Google Scholar]
- 34.Voegtle H L, Sono M, Adak S, Pond A E, Tomita T, Perera R, Goodin D B, Ikeda-Saito M, Stuehr D J, Dawson J H. Biochemistry. 2003;42:2475–2484. doi: 10.1021/bi0271502. [DOI] [PubMed] [Google Scholar]
- 35.Yoshimura T, Ozaki T. Arch Biochem Biophys. 1984;229:126–135. doi: 10.1016/0003-9861(84)90137-1. [DOI] [PubMed] [Google Scholar]
- 36.Decatur S M, Franzen S, DePillis G D, Dyer B, Woodruff W H, Boxer S G. Biochemistry. 1996;35:4939–4944. doi: 10.1021/bi951661p. [DOI] [PubMed] [Google Scholar]
- 37.Jameson G B, Robinson W T, Collman J P, Sorrell T N. Inorg Chem. 1978;17:858–864. [Google Scholar]
- 38.Collman J P, Sorrell T N, Dawson J H, Trudell J R, Bunnenberg E, Djerassi C. Proc Natl Acad Sci USA. 1976;73:6–10. doi: 10.1073/pnas.73.1.6. [DOI] [PMC free article] [PubMed] [Google Scholar]
- 39.Barker P D, Nerou E P, Cheesman M R, Thomson A J, de Oliveria P, Hill H A O. Biochemistry. 1996;35:13618–13626. doi: 10.1021/bi961127x. [DOI] [PubMed] [Google Scholar]
- 40.Cheesman M R, Thomson A J, Greenwood C, Moore G R, Kadir F. Nature. 1990;346:771–773. doi: 10.1038/346771a0. [DOI] [PubMed] [Google Scholar]
- 41.Dawson J H, Andersson L A, Sono M. J Biol Chem. 1983;258:13637–13645. [PubMed] [Google Scholar]
Associated Data
This section collects any data citations, data availability statements, or supplementary materials included in this article.


