Abstract
First measurements of oxygen grain boundary diffusion coefficients in nanocrystalline yttria-doped ZrO2 (n-ZrO2⋅6.9 mol % Y2O3) are presented. The 18O diffusion profiles measured by secondary ion mass spectroscopy are much deeper in the nanocrystalline specimens than in single crystals. An oxygen diffusivity, DB, in the grain boundaries can be deduced, which is ≈3 orders of magnitude higher than in single crystals. From the present data the temperature variation of the oxygen grain boundary diffusivity, DB = 2.0 × 10⁻⁵ exp (−0.91 eV/kBT) m2/s, and the oxygen surface exchange coefficient, k = 1.4 × 10⁻² exp (−1.13 eV/kBT) m/s, are derived.
Yttria stabilized zirconia (ZrO2⋅Y2O3) is widely used as an electrolyte material in solid oxide fuel cells or oxygen sensors. The technological importance of the material arises from its extraordinary oxygen transport properties, which are attributed to an oxygen vacancy mechanism. The replacement of quadrivalent Zr by trivalent Y gives rise to a high concentration of structural oxygen vacancies for charge compensation and stabilizes the cubic phase (1). The structural vacancies dramatically increase the mobility of oxygen ions, and the highest ionic conductivities were reported for Y2O3 concentrations of 7–10 mol % (2).
There is a broad interest in reducing the high operating temperatures of solid oxide fuel cells, typically 900–1,000°C, and resulting degradation effects by increasing the oxygen ion conductivity of the electrolyte. In undoped monoclinic nanocrystalline ZrO2 it was found that the diffusion of oxygen in interfaces is 103 to 104 times faster than in the bulk of the crystallites (3). The question arises as to whether the high oxygen diffusivities of ZrO2⋅Y2O3 upon doping can be further enhanced by the introduction of a large number of crystallite interfaces. A reason for an enhanced oxygen diffusion could be a loosely packed grain boundary structure, which is well established for pure metals (4), or easy formation of vacancy-type free volumes within the grain boundaries (5). On the other hand, there are reports that oxygen transport across grain boundaries could be impeded by a blocking effect due to space charge layers in the grain boundary region (6) or silica-containing grain boundary phases (7). In the present study, we present direct measurements of the grain boundary diffusion coefficients in nanocrystalline ZrO2⋅Y2O3, which are accomplished by using 18O as a tracer and secondary ion mass spectroscopy for depth profiling.
Fully dense nanocrystalline ZrO2⋅Y2O3 bulk specimens were synthesized by dc sputtering of a ZrY metal target and crystallite condensation in an argon atmosphere at 240 Pa. Subsequent oxidation by slow exposure to an oxygen atmosphere (2,000 Pa) and in situ uniaxial compaction at high pressures (2 GPa) yielded disk-shaped specimens 5 mm in diameter with a relative mass density ρ/ρ0 ≈89% of the green body and a mean crystallite size <5 nm. From the sputter target with the composition of Zr84Y16, specimens with the final composition of ZrO2⋅6.9 mol % Y2O3 were prepared.
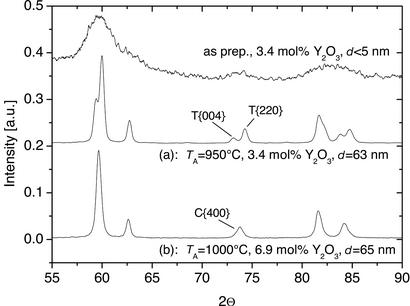
Annealing in pure oxygen at atmospheric pressure at high temperatures led to a complete oxidation of the specimens, densification, and grain growth. Volume-averaged mean crystallite sizes d = 65 nm (1,000°C) and d = 99 nm (1,080°C) were determined from the broadening of the x-ray diffraction lines βk by a Rietveld fit by using Voigt functions (8–10). A qualitative analysis of the high indexed tetragonal (T) and cubic (C) reflections T{004}, C{400}, and T{220} at 2Θ ≈ 74° of the x-ray diffraction patterns revealed a cubic crystal structure of the nanocrystalline ZrO2⋅6.9 mol % Y2O3 specimens after annealing (Fig. 1).
Figure 1.
The x-ray diffractograms of nanocrystalline ZrO2⋅Y2O3 specimens allow the determination of the crystallite size d from the line broadening and a qualitative analysis of the crystal structure. Depending on the dopant concentration, tetragonal (a) and cubic (b) specimens, which can be distinguished by the C{400} reflection, were obtained after sintering at TA. The cubic specimens were used for the diffusion experiments.
The sintering behavior and microstructure of the specimens were investigated by measurement of the mass density (Archimedes technique and geometrical studies), microporosimetry (11), and optical microscopy. After sintering at 1,000°C and 1,080°C, the annealing out of nanoscaled pores and an increase in mass density to ρ/ρ0 = 96% were observed. In this state, a few microcracks were found between dense nanocrystalline agglomerates with a diameter of ≈100 μm (12). These cracks may contribute to a slightly increased 18O background level (0.2%) in the 18O diffusion profiles without further affecting the shape of the profiles (3).
Profiles of 18O diffusion were measured on cubic nanocrystalline-ZrO2⋅6.9 mol % Y2O3 specimens and single crystal ZrO2⋅9.5 mol % Y2O3 specimens (Zirmat, North Billerica, MA). A specimen surface roughness of <10 nm in a surface area of 100 × 100 μm2 was achieved by 1-μm diamond paste polishing. The diffusion anneals were performed in a 150-cm3 quartz glass recipient at a 100-kPa pressure of 18O in the temperature range between 200°C and 500°C. The temperature slopes of heating and cooling for the diffusion anneals were taken into account (13) for the determination of the diffusivities.
The 18O diffusion profiles were measured by using the Cameca IMS-6f Secondary Ion Mass Spectroscopy facility at Chalmers University. Depth profiles were obtained by sputtering the specimen surface with a Cs+ primary ion beam in an area of 250 × 250 μm2 and analyzing the secondary ions emitted from the center of the crater (50 μm in diameter). A depth calibration was performed by measuring the crater depth with a surface profilometer and monitoring the Zr signal. The 18O diffusion profiles were measured in both the nanocrystalline and the single crystal specimens for a direct comparison of the diffusion behavior and a precise determination of the volume diffusion coefficient DV.
In the present case of high oxygen volume diffusivities DV in the ZrO2⋅Y2O3 single crystals (see Fig. 2), the oxygen flux
 |
1 |
is limited by the oxygen exchange across the gas/solid interface as determined by the rate constant k (surface exchange coefficient) as well as the relative 18O concentrations cgas in the gas phase and cS at the surface of the solid. For this situation the 18O diffusion profile
 |
2 |
has been derived (14) with h = k/D. From a fit of Eq. 2 to the 18O profile c(z), the 18O background level c0, the exchange rate k, and the volume 18O diffusivity DV can be determined.
Figure 2.
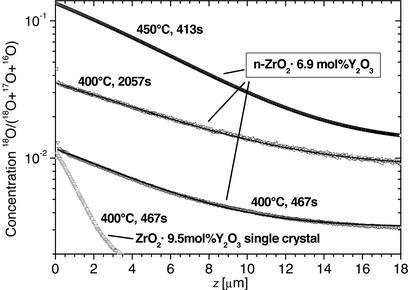
Diffusion profiles of oxygen self-diffusion in a ZrO2⋅9.5 mol % Y2O3 single crystal with a (100) surface and in nanocrystalline ZrO2⋅Y2O3 measured by secondary ion mass spectroscopy. The diffusion anneals were carried out in a 10-kPa, 97% enriched 18O atmosphere at the temperatures and times indicated. The deeper penetration of the tracer in nanocrystalline specimens compared with single crystals indicates faster effective diffusion due to the large volume fraction of grain boundaries. The shape of the profiles is typical for diffusion from a constant source under type A kinetics (see text) with a limited gas exchange at the specimen surface.
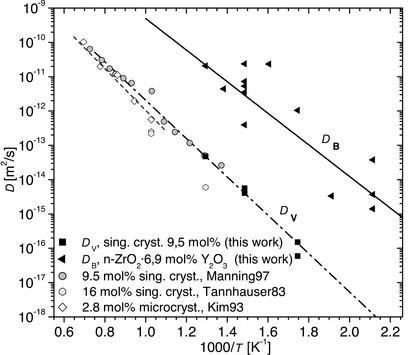
The study of ZrO2⋅9.5 mol % Y2O3 single crystals with a (100) surface extends the earlier data for DV (15–17) to lower temperatures. An activation enthalpy HV = (1.11 ± 0.06) eV, in agreement with the value of the conductivity measured by impedance spectroscopy (18), together with a pre-exponential factor D0V = 0.8 × 10⁻⁶ m2/s is derived by fitting the Arrhenius equation
 |
3 |
to the volume diffusion coefficients DV (see Fig. 3); kB denotes the Boltzmann constant.
Figure 3.
Volume and interface diffusion coefficients of 18O in ZrO2⋅Y2O3 and comparison with data from literature (15–17). The diffusion in the interfaces of nanocrystalline ZrO2⋅6.9 mol % Y2O3 is 3 orders of magnitude faster than in the bulk of single crystal ZrO2⋅9.5 mol % Y2O3. The activation enthalpies of (1.11 ± 0.06) eV for volume diffusion and (0.91 ± 0.2) eV for grain boundary diffusion were derived.
A much higher 18O diffusivity in the nanocrystalline ZrO2⋅6.9 mol % Y2O3 specimens than in the single crystals is evidenced by the deeper penetration of the diffusion profiles at 400°C shown in Fig. 2. We assume a type A diffusion behavior because the volume diffusion length  is much larger than the crystallite size d < 100 nm (19, 20). In this case, simultaneous contributions from the grains (DV) and the grain boundaries (DB) yield an effective diffusivity
 |
4 |
which is obtained from the diffusion profiles by a fit of Eq. 2. The volume fraction f = 2δ/d of grain boundaries is characterized by the grain size d and the grain boundary width δ ≈ 0.5 nm (21, 22) and is used together with the above DV values from the above oxygen diffusion measurements on ZrO2⋅9.5 mol % Y2O3 single crystals to deduce the grain boundary diffusion coefficients DB.
We use these DV values for the oxygen volume diffusivity in the nanocrystalline specimen irrespective of the fact that the composition is slightly different in the single crystal and the nanocrystalline specimens. This idea is reasonable because in this composition range the ion conductivity in ZrO2⋅Y2O3 single crystals is observed to be practically independent of composition (2, 18).
The scattering of the DB values (Fig. 3) originates from structural differences between the specimens, e.g., differences in agglomeration and crack formation during sintering, and inhomogeneities within the specimen, e.g., an inhomogeneous grain size distribution, resulting in a small dependence of the profile on the analysis spot. An enhancement of the specimen homogeneity could be reached by ultrasonic treatment of the nanostructured powder before compaction to avoid particle agglomeration. Experiments involving diffusion under high 18O pressure to enhance the signal-to-background ratio of the tracer are in preparation.
The grain boundary oxygen diffusivity DB = 2.0 × 10⁻⁵ exp (−0.91 eV/kBT) m2/s is deduced to be by 3 orders of magnitude higher than the volume diffusivity DV = 8.0 × 10⁻⁷ exp (−1.11 eV/kBT) m2/s (see Fig. 3). This finding may indicate that the concentration and/or the mobility of the oxygen vacancies in the interfaces are even higher than in doped single crystals.
A high oxygen diffusivity in grain boundaries as measured here can be deduced from structural studies as discussed in the following. Specific information on the atomic structure of ZrO2⋅10 mol % Y2O3 grain boundaries has recently been obtained by analytical high-resolution transmission electron microscopy (23, 24). Making use of Z-contrast imaging and electron energy-loss spectroscopy (EELS) on a symmetric 24° [001] tilt boundary an increase of the yttrium concentration in the grain boundary core by about a factor of 2 has been found, as anticipated by early auger electron spectroscopy/x-ray photoelectron spectroscopy (25) and energy dispersive x-ray spectroscopy (22) studies. A concomitant increase in the concentration of oxygen vacancies exceeding the value expected from the enhanced yttrium concentration has been observed in agreement with atomic simulations of the grain boundary (23). From the excess oxygen vacancies and the EELS studies it is furthermore concluded that there are 1.45 free electrons per formula unit available in the grain boundary.
In high-resolution electron micrographs of ZrO2⋅Y2O3 films with 10–15 mol % Y2O3 narrow grain boundaries (≈0.5 nm) with free volumes are observed (26). In the vicinity of the grain boundary stacking faults or distortions of adjacent lattice planes may further contribute to an enhancement of the concentration and mobility of free volumes for oxygen transport. This enhancement may also occur as a consequence of the increased mean square displacement of oxygen ions obtained from molecular dynamics studies of a Σ5 twist boundary (27).
Furthermore, the activation enthalpy HB = (0.91 ± 0.2) eV of the grain boundary oxygen diffusivity observed here seems to be reduced in comparison to the value HV = (1.11 ± 0.06) eV for volume diffusion, which indicates an enhanced mobility of the oxygen ions in ZrO2⋅Y2O3 grain boundaries. The activation enthalpy HB clearly does not exceed the value HV as expected from the behavior of the oxygen activation enthalpy in bulk crystals (18), which increases with yttrium concentration. Thus, the reduction within the yttrium-rich grain boundary originates from structural modifications.
Conventionally the oxygen diffusivity D is correlated to the ion conductivity σ, as investigated by impedance spectroscopy, via the Nernst–Einstein relationship
 |
5 |
where e denotes the electronic charge, α the charge number of the diffusing species, nO2− the atomic concentration of the diffusing O2− ions, and fD a correlation factor. Making use of the oxygen diffusivities DV measured in ZrO2⋅Y2O3 single crystals (15) or in the present study together with the bulk conductivity σV (15, 18), reasonable values of α = 2 and fD = 0.33 can be deduced. It is unclear whether Eq. 5 holds for the case of oxygen diffusion in grain boundaries or whether it should be modified and further studies are required. The oxygen diffusivity in grain boundaries is enhanced by a factor of 1,000 beyond that of bulk crystals as shown above, whereas the ion conductivity is reduced (6, 28), reportedly due to interfacial space charges (6, 29). Yet, with decreasing grain size, the specific conductivity of grain boundaries is reported to increase (28), but not beyond the bulk conductivity σV. For elucidating the correlation between the diffusivity and the conductivity in grain boundaries, measurements of the ion conductivity in the same specimens as used for the present diffusion experiments are required.
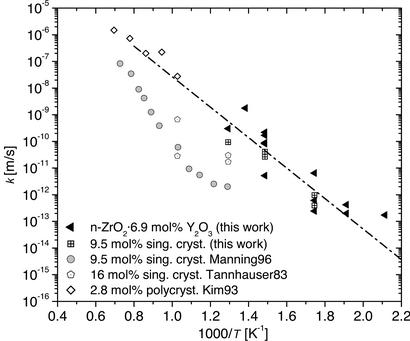
In the case of the high interfacial oxygen diffusivity demonstrated here, a high surface oxygen exchange rate is of additional importance for future experiments. The surface exchange coefficient k derived from a fit of Eq. 2 to the diffusion profiles in nanocrystalline ZrO2⋅6.9 mol% Y2O3 does not significantly differ from the values for ZrO2⋅9.5 mol % Y2O3 single crystals. From this similarity we conclude that the exchange coefficient for oxygen at the grain boundaries is not significantly different from that for the bulk surface. The temperature variation k = 1.4 × 10⁻² exp (−1.13 eV/kBT) m/s of the exchange coefficient (see Fig. 4) for the present nanocrystalline ZrO2⋅6.9 mol % Y2O3 specimens gives an activation enthalpy of 1.13 eV, similar to the value derived from the present experiments on ZrO2⋅9.5 mol % Y2O3 single crystals and to the values for microcrystalline ZrO2⋅2.8 mol % Y2O3 (17). The much lower exchange coefficients reported for (100) surfaces of ZrO2⋅9.5 mol % Y2O3 single crystals (15) may originate from different surface structure and pretreatment.
Figure 4.
Surface exchange coefficients k for 18O exchange at the surface of ZrO2⋅Y2O3 and comparison with data from literature (15–17). The slow gas exchange leads to low tracer concentrations at the surface. An activation enthalpy for the exchange process of Hk = 1.13 eV is derived from the temperature dependence of k.
In conclusion, we point out that in the present studies of the oxygen diffusivity DB in nanocrystalline ZrO2⋅6.9 mol % Y2O3 oxygen diffusivities in grain boundaries enhanced by a factor of 1,000 have been observed with a temperature dependence according to DB = 2.0 × 10⁻⁵ exp (−0.91 eV/kBT) m2/s. For promising future applications of this high oxygen diffusivity an enhancement of the oxygen surface exchange coefficient k = 1.4 × 10⁻² exp (−1.13 eV/kBT) m/s is desirable.
Acknowledgments
The valuable technical assistance in the specimen preparation and the chemical analysis by H. Wendel and A. Maier, Max-Planck-Institut für Metallforschung, Stuttgart, is gratefully acknowledged. This work was supported by Deutsche Forschungsgemeinschaft Grant Scha428/30-1.
References
- 1.Eichler A. Phys Rev B Condens Matter. 2001;64:1–8. [Google Scholar]
- 2.Strickler D W, Carlson W G. J Am Ceram Soc. 1964;47:122–127. [Google Scholar]
- 3.Brossmann U, Würschum R, Södervall U, Schaefer H-E. J Appl Phys. 1999;85:7646–7654. [Google Scholar]
- 4.Schaefer H-E, Reimann K, Straub W, Phillipp F, Tanimoto H, Brossmann U, Würschum R. Mater Sci Eng A. 2000;286:24–28. [Google Scholar]
- 5.Würschum R, Shapiro E, Dittmar R, Schaefer H-E. Phys Rev B Condens Matter. 2000;62:12021–12027. [Google Scholar]
- 6.Guo X, Maier J. J Electrochem Soc. 2001;148:E121–E126. [Google Scholar]
- 7.Badwal S P S. Solid State Ionics. 1995;76:67–80. [Google Scholar]
- 8.Reimann K, Fecht H-J, Schaefer H-E. Scri Mater. 2001;44:1999–2003. [Google Scholar]
- 9.Rietveld H M. J Appl Crystallogr. 1969;2:65–71. [Google Scholar]
- 10.Reimann K, Würschum R. J Appl Phys. 1997;81:7186–7192. [Google Scholar]
- 11.Brunauer S, Emmett P H, Teller E. J Am Chem Soc. 1938;60:309–319. [Google Scholar]
- 12.Knöner G. Master Thesis. Stuttgart: University of Stuttgart; 2002. [Google Scholar]
- 13.Killoran D R. J Electrochem Soc. 1962;190:170–171. [Google Scholar]
- 14.Crank J. The Mathematics of Diffusion. London: Oxford Univ. Press; 1957. pp. 30–35. [Google Scholar]
- 15.Manning P S, Sirman J D, Souza R A, Kilner J A. Solid State Ionics. 1997;100:1–10. [Google Scholar]
- 16.Tannhauser D S, Kilner J A, Steele B C H. Nucl Instrum Methods. 1983;218:504–508. [Google Scholar]
- 17.Kim B-K, Park S-J, Hamaguchi H. J Am Ceram Soc. 1993;76:2119–2122. [Google Scholar]
- 18.Filal M, Petot C, Mokchah M, Chateau C, Carpentier J L. Solid State Ionics. 1995;80:27–35. [Google Scholar]
- 19.Fisher J C. J Appl Phys. 1951;22:74–79. [Google Scholar]
- 20.Harrison L G. Trans Faraday Soc. 1961;57:1191–1199. [Google Scholar]
- 21.Nitsche R, Rodewald M, Skandan G, Fuess H, Hahn H. Nanostruct Mater. 1996;7:535–546. [Google Scholar]
- 22.Merkle K L, Bai G-R, Li Z, Song C-Y, Thompson L J. Phys Status Solidi A. 1998;166:73–89. [Google Scholar]
- 23.Lei Y, Ito Y, Browning N D. J Am Ceram Soc. 2002;85:2359–2363. [Google Scholar]
- 24.Dickey E C, Fan X. J Am Ceram Soc. 2001;84:1361–1368. [Google Scholar]
- 25.Theunissen G S A M, Winnubst A J A, Burggraaf A J. J Mater Sci. 1992;27:5057–5066. [Google Scholar]
- 26.Merkle K L, Thompson L J, Bai G-R, Eastman J A. MRS Symp Proc. 2001;654:AA1.6.1–AA1.6.6. [Google Scholar]
- 27.Fisher C A J, Matsubara H. J Eur Ceram Soc. 1999;19:703–707. [Google Scholar]
- 28.Mondal P, Klein A, Jaegermann W, Hahn H. Solid State Ionics. 1999;118:331–339. [Google Scholar]
- 29.Guo X. Solid State Ionics. 1995;81:235–242. [Google Scholar]


