

Abstract
Sickness evokes various neural responses, one of which is activation of the hypothalamo–pituitary–adrenal (HPA) axis. This response can be induced experimentally by injection of bacterial lipopolysaccharide (LPS) or inflammatory cytokines such as IL-1. Although prostaglandins (PGs) long have been implicated in LPS-induced HPA axis activation, the mechanism downstream of PGs remained unsettled. By using mice lacking each of the four PGE receptors (EP1–EP4) and an EP1-selective antagonist, ONO-8713, we showed that both EP1 and EP3 are required for adrenocorticotropic hormone release in response to LPS. Analysis of c-Fos expression as a marker for neuronal activity indicated that both EP1 and EP3 contribute to activation of neurons in the paraventricular nucleus of the hypothalamus (PVN). This analysis also revealed that EP1, but not EP3, is involved in LPS-induced activation of the central nucleus of the amygdala. EP1 immunostaining in the PVN revealed its localization at synapses on corticotropin-releasing hormone-containing neurons. These findings suggest that EP1- and EP3-mediated neuronal pathways converge at corticotropin-releasing hormone-containing neurons in the PVN to induce HPA axis activation upon sickness.
During sickness, various responses of the CNS are evoked in animals through the immune–brain interaction, one prominent example being the activation of the hypothalamo–pituitary–adrenal (HPA) axis (1, 2). In this response, a population of parvocellular neurons in the paraventricular nucleus of the hypothalamus (PVN) are activated to secrete corticotropin-releasing hormone (CRH), which then triggers the release of adrenocorticotropic hormone (ACTH) from the pituitary to the plasma, and the latter finally stimulates the secretion of corticosteroids (2). This neuroendocrine cascade is a primordial step in host defense mechanism that is mobilized upon exposure to a large variety of stresses (2–4). Activation of the HPA axis that occurs during systemic diseases can be mimicked experimentally by injection of bacterial endotoxin, lipopolysaccharide (LPS), or inflammatory cytokines such as IL-1. By using these models, the mechanism of the sickness-induced HPA axis activation has been studied extensively, and these studies suggest the involvement of prostaglandins (PGs) in the initiation of this neuroendocrine cascade.
PGs are lipid mediators produced from arachidonic acid by the sequential actions of cyclooxygenases (COX) and respective synthases, and they include PGD2, PGE2, PGF2α, PGI2, and thromboxane A2 (5). They are released from cells in response to a variety of physiological and pathological stimuli and act in the vicinity of their site of synthesis. Roles of PGs have been studied by examining actions of either exogenously applied PGs or nonsteroidal antiinflammatory drugs (NSAIDs), such as indomethacin, that block the production of PGs by inhibiting COX. Indeed, in previous experiments the HPA axis activation by either LPS or IL-1 was attenuated by pretreatment of animals with NSAIDs, and PGE2 injected centrally into the brain induced PVN activation and ACTH release (6–11). However, the inhibition by NSAIDs was not always complete, was often short-lived, and was sometimes inconsistent (2). In addition, no systematic effort to pinpoint the identity of the critical PG involved in this process has yet been performed. Consequently, the physiological significance of PGs in HPA axis regulation has remained obscure. This situation appears to be mainly because of the lack of appropriate experimental tools to dissect various PG-mediated steps in the CNS.
PGs exert their effects through interaction with eight types and subtypes of cell surface receptors. They include PGD receptor (DP), four subtypes of PGE receptor (EP1, EP2, EP3, and EP4), PGF receptor (FP), PGI receptor (IP), and thromboxane A receptor (TP). All of these receptors are G protein-coupled receptors with seven transmembrane domains (5). We have disrupted genes for these receptors individually in mice and analyzed phenotypes of the resulting knockout animals (12–17). Using these mice, we showed previously that the PGE receptor EP3 in the brain plays a critical role in the generation of febrile response to LPS and IL-1β (15). Because LPS and IL-1 evoke activation of the HPA axis together with fever under these conditions, we suspected that PGE2–EP3-mediated mechanism also might underlie elicitation of other CNS responses to sickness. Our results suggest that LPS-induced ACTH release indeed is defective in EP3-deficient mice. However, we found that this ACTH response also is defective in EP1-deficient mice. Furthermore, both EP1 and EP3 play a critical role in regulating the PVN in the HPA axis activation.
Materials and Methods
Mice.
Mice lacking EP1, EP2, EP3, or EP4 receptor were generated as described (14–16). With the exception of EP4−/− mice, each mutant line was backcrossed for more than five generations into C57BL/6CrSlc (Japan SLC, Hamamatsu, Japan). Because most EP4−/− mice die postnatally (14), survivors of the F2 progenies of EP4−/− mice in the mixed genetic background of 129/Ola × C57BL/6 were intercrossed and the resultant male survivors were used. All experiments were performed according to the guidelines for animal experiments of Kyoto University.
Measurement of LPS-Induced ACTH Release.
Before each experiment, 8- to 12-week-old male mice were caged individually for 3 days under standard conditions (12-h light/12-h dark cycle; light on between 0900 and 2100), with free access to chow and water, and handled daily. Each mouse was injected i.p. with 0.11 ml of an LPS (Escherichia coli O26:B6) suspension (0.02 mg/ml) and killed by decapitation. Plasma ACTH concentration was determined with an immunoradiometric assay kit as described (18). A volume of 0.22 ml of indomethacin solution (5 mg/ml in Dulbecco's PBS) or vehicle was injected i.p. 15 min before LPS injection. An EP1 antagonist, ONO-8713 (19), kindly provided by Ono Pharmaceutical (Osaka), was dissolved at a concentration of 10 mg/ml in 1 M NaOH containing 5% glucose. The solution was adjusted to pH 9.0 with 5 M HCl and then diluted 10-fold with PBS before i.p injection of 0.22 ml 60 min before LPS injection.
Immunohistochemistry.
For immunostainings of c-Fos and CRH, mice were killed by transcardiac perfusion with 0.1 M phosphate buffer containing 4% paraformaldehyde. Coronal brain sections of 30-μm thickness were prepared, and c-Fos immunoreactivity (Fos-IR) was detected by using a rabbit polyclonal anti-c-Fos antibody (1:2,000 dilution, Ab-5; Oncogene Science) and a Vectastain ABC-PO kit (Vector Laboratories), as described (20). Two sections with the highest numbers of Fos-IR-positive cells were identified for each region, and the mean number was taken as the representative score for each mouse. For double immunostaining, sections were incubated with the anti-c-Fos and guinea pig anti-CRH (1:200 dilution, T-5007; Peninsula Laboratories) antibodies. Signals were detected with Alexa 488-labeled anti-rabbit and Alexa 594-labeled anti-guinea pig IgG antibodies (1:200 dilution; Molecular Probes), respectively.
Immunostaining of COX-1, COX-2, and microsomal PGE synthase-1 (mPGES-1) was carried out as described (21, 22) by using mouse anti-COX-1 (1:500 dilution, 160110; Cayman Chemical, Ann Arbor, MI), goat anti-COX-1 (1:1,000 dilution, sc-1752, Lot D-208; Santa Cruz Biotechnology), rabbit anti-mouse COX-2 (1:1,000 dilution, 160126; Cayman Chemical), rabbit anti-mPGES-1 (1:1,500 dilution, 160140; Cayman Chemical), or guinea pig anti-mPGES-1 (1:500 dilution; ref. 23) antibodies. COX-1-IR was detected by Alexa 488-labeled anti-mouse and/or Alexa 594-labeled anti-goat IgG antibodies (1:500 dilution; Molecular Probes). Signals for COX-2 and mPGES-1 were detected with a biotinylated anti-rabbit IgG antibody (Jackson ImmunoResearch) followed by Alexa 488- or Alexa 594-labeled streptavidin (Molecular Probes) or with Alexa 488-labeled anti-guinea pig IgG antibody. The specificity of each signal was confirmed by the use of two independent antibodies for COX-1 and mPGES-1 or by loss of COX-2-IR on brain sections from COX-2−/− mice.
For immunostaining of EP1, synaptophysin, and CRH, fresh brains were frozen, cut coronally at a thickness of 10 μm, then serially treated with 95% ethanol at −20°C for 30 min and 100% acetone for 3 min at room temperature. They were incubated with rabbit anti-EP1 (1:400 dilution) (24), mouse anti-synaptophysin (1:50 dilution, 61012; Progen, Heidelberg), and/or guinea pig anti-CRH antibodies. Signals were detected with fluorescein- and/or Texas red-labeled secondary antibodies (1:200 dilution). All fluorescent images were acquired with laser-scanning confocal microscopy [MRC1024 (Bio-Rad) or LSM510 (Zeiss)].
Semiquantitative RT-PCR.
Mice were injected with LPS (2.5 mg/kg) i.p. and killed by decapitation 3 h later. The hypothalamus was isolated as defined (25) and homogenized within 3 min after decapitation. Total RNA was extracted by using TRIzol solution (Invitrogen) and subjected to semiquantitative RT-PCR by using Light-Cycler (Roche Diagnostics) as described (26). Primers and fluorescent probes for mouse c-fos and GAPDH mRNA were obtained from Nihon Gene Research Laboratories (Sendai, Japan). The amount of c-Fos mRNA was normalized to that of GAPDH mRNA from the same cDNA sample and is shown as the ratio to the value in vehicle-treated wild-type mice.
Statistical Analyses.
Data are shown as means ± SEM. Comparison of two groups was analyzed by Student's t test. For comparison of more than two groups with comparable variances, one-way ANOVA was performed first. Then, either Dunnett's or Tukey's test was used to evaluate pairwise group difference. If the variances of the groups were significantly different, a Kruskal–Wallis test followed by Dunn's test was used for nonparametric comparisons. The analyses were performed with the use of prism 3.0 software (GraphPad, San Diego).
Results
LPS-Induced HPA Axis Activation Is Impaired in EP1−/− and EP3−/− Mice.
Given the previous inconsistent effects of NSAIDs on ACTH release (see ref. 2), we first examined the time course of inhibition of ACTH response to LPS by indomethacin. We measured the plasma ACTH concentration at various times after LPS injection (0.1 mg/kg i.p.) without (vehicle/LPS) or with (IND/LPS) indomethacin administered (50 mg/kg i.p.) 15 min before LPS injection (Fig. 1A). The ACTH concentration in the vehicle/LPS group significantly increased at 60 min, peaked at 120 min, and decreased but still remained higher than the control at 180 min, whereas no change was observed in control mice injected with saline. Indomethacin treatment before LPS challenge abolished the ACTH increase at 60 and 180 min. The peak response at 120 min was not affected significantly, although the value at 120 min also tended to be lower than that for the vehicle/LPS group. These results indicate that the LPS-induced ACTH release in mice is composed of two components: an indomethacin-sensitive component that was apparent at all time points and an indomethacin-resistant component that was transient and peaked at 120 min. A similar NSAID effect on LPS-induced ACTH release was reported previously (27).
Figure 1.

Impaired LPS-induced ACTH release in EP1−/− and EP3−/− mice. (A) Inhibition of LPS-induced ACTH release by indomethacin. Time course of the plasma ACTH concentration after injection of LPS (0.1 mg/kg i.p.) or saline is shown in the absence (Vehicle) or presence (IND) of indomethacin pretreatment (nine mice per group). ○, Vehicle + saline; ●, vehicle + LPS; ▴, indomethacin + LPS. ***, P < 0.001 vs. Vehicle/saline; ##, P < 0.01; ###, P < 0.001 vs. IND/LPS. (B) Effects of EP deficiency on LPS-induced ACTH release. Wild-type mice were injected with either saline (n = 6) or LPS (n = 9). EP1−/− (n = 9), EP2−/− (n = 9), EP3−/− (n = 9), and EP4−/− (n = 5) mice were injected with LPS. Their plasma ACTH concentrations were measured after 1 h. ***, P < 0.001. (C) Structure of ONO-8713. (D) Inhibition of LPS-induced ACTH release by ONO-8713 (n = 6 each). ***, P < 0.001. (E) Effect of ONO-8713 on LPS-induced increase in body temperature (n = 6 each). **, P < 0.01.
We next examined whether LPS induces the release of ACTH in mice deficient in any one of the four EP subtypes. The plasma ACTH level from the knockout and wild-type mice was measured at 1 h after LPS challenge. At this time point, EP2−/− and EP4−/− mice exhibited an increase in ACTH concentration similar to that apparent in wild-type mice (Fig. 1B). However, no increase in ACTH concentration was found in either EP1−/− or EP3−/− mice. As found in the indomethacin-treated animals, both EP1−/− and EP3−/− mice elicited a peak of ACTH release at 2 h after LPS injection, but neither of them showed the increase at 3 h (data not shown). The impairment in EP1−/− and EP3−/− mice was confirmed by comparing the responses among littermates born from EP1- or EP3-heterozygous mice (data not shown). The role of EP1 in ACTH release was confirmed further pharmacologically by the use of a highly selective EP1 antagonist, ONO-8713 (19) (Fig. 1C). The treatment with this antagonist suppressed the LPS-induced ACTH release in wild-type mice, whereas it did not affect the febrile response, an EP3-mediated process (15) (Fig. 1 D and E). These results suggest that both EP1 and EP3 play a crucial role in mediating LPS-induced ACTH release and, further, that EP1 participates in this response by a process independent of EP3-mediated febrile response.
Defective LPS-Induced c-Fos Expression in Neurons of EP1−/− and EP3−/− Mice.
The loss of LPS-induced ACTH release by EP1 or EP3 deficiency described above could be attributed to defect(s) either in PVN activation or in CRH action on the pituitary. To examine which step is affected by EP1 or EP3 deficiency, we determined LPS-induced c-fos expression in the PVN and the pituitary of wild-type, EP1−/−, and EP3−/− mice. Because substantial Fos-IR was detected not at 60 min but at 120 min after LPS injection, the numbers of positive cells were determined at the latter time point. Wild-type, EP1−/−, and EP3−/− mice showed similar numbers of Fos-IR-positive cells in the PVN with no significant difference among the groups (Fig. 2A). No difference was found, either, in the pituitary among the three lines of mice (data not shown). Although these results appeared to suggest that neither EP1 nor EP3 deficiency affects neuronal activation in these areas, we suspected that either deficiency did affect the activation but only to the level that was sufficient to blunt ACTH release but not sufficient to decrease the number of Fos-IR-positive cells. It is known that the level of c-Fos has a rather complex relationship with neuronal firing (28). Because both EP1 and EP3 are involved in ACTH release, it is possible that inhibition of one of these receptors leaves the pathway mediated by the other receptor intact, which may be sufficient for Fos induction. We therefore decided to inhibit all of the PG-mediated pathways by treatment with indomethacin and examine its effects on Fos induction. Indeed, in keeping with previous studies (9, 10), the treatment with indomethacin significantly decreased the number of LPS-induced Fos-IR-positive cells in the PVN (Fig. 2B). We therefore administered ONO-8713 to EP3−/− mice to block both EP1 and EP3 in these animals and measured c-Fos expression in the PVN. Intriguingly, treatment of EP3−/− mice with ONO-8713 resulted in a decrease in the number of Fos-IR-positive cells to an extent comparable to that found in indomethacin-treated wild-type mice (Fig. 2B). Double immunostaining with c-Fos and CRH antibodies revealed that most c-Fos-positive neurons in the PVN of wild-type mice were CRH-immunoreactive (Fig. 2C). Thus, c-Fos reduction in EP3−/− mice with ONO-8713 is likely to occur in CRH-containing neurons in the PVN.
Figure 2.

LPS-induced c-Fos response in wild-type, EP1−/−, and EP3−/− mice. (A) Fos-IR response in the PVN. The numbers of Fos-IR-positive cells in the PVN of each group of mice are shown (n = 7 each). (B) Effects of indomethacin and ONO-8713 on Fos-IR response in the PVN. Wild-type mice (BL6) treated with either vehicle (Veh; n = 7) or indomethacin (IND; n = 7) or EP3−/− mice treated with ONO-8713 (ONO; n = 9) were challenged with LPS and analyzed for c-Fos response. *, P < 0.05 vs. vehicle-treated wild-type mice. (C) Double immunostaining of c-Fos and CRH in the PVN of LPS-treated wild-type mice. Arrowheads and arrows show Fos-IR-positive neurons with or without CRH-IR, respectively. (Bar = 50 μm.) (D) Induction of c-fos mRNA. Wild-type (BL6), EP1−/−, and EP3−/− mice (the numbers appear in parentheses) were injected with either vehicle or LPS, and c-fos mRNA in the hypothalamus was quantified by RT-PCR. The amount of c-fos mRNA was normalized to that of GAPDH mRNA. ###, P < 0.001 vs. vehicle-treated mice of the respective genotype; ***, P < 0.001 vs. LPS-treated wild-type mice. (E) Fos-IR response in the central nucleus of the amygdala (CeA) (n = 7 each). *, P < 0.05 and **, P < 0.01 vs. EP3−/− and wild-type mice, respectively. (F) Fos-IR response in the nucleus of the solitary tract (NTS). The numbers of wild-type, EP1−/−, and EP3−/− mice are 13, 14, and 8, respectively.
Because the above c-Fos assay measured the number of Fos-IR-positive cells irrespective of its amount in each cell, we next quantified the amount of c-Fos mRNA by RT-PCR. Because of the detection threshold of this method, we treated mice with a high dose of LPS (2.5 mg/kg i.p.) and subjected the whole hypothalamus to the analysis. The LPS injection indeed induced a significant amount of c-Fos mRNA in the hypothalamus, and this induction was impaired in both EP1−/− and EP3−/− mice (Fig. 2D). These results strongly suggest that both EP1 and EP3 mediate LPS-induced activation of the hypothalamus. This is consistent with a view that a pathway mediated by either EP1 or EP3 alone can activate neurons in the PVN to some extent, but the synergistic activation by both pathways is required for PVN activation sufficient for ACTH release.
We next extended the Fos-IR analysis to other regions known to be activated in response to LPS in rats (9, 10, 29). They include the central nucleus of the amygdala (CeA), the nucleus of the solitary tract (NTS), and the ventrolateral medulla (VLM). A sizable number of neurons were responsive to LPS in CeA of wild-type mice (Fig. 2E). Notably, EP1−/− mice showed a significant reduction in the number of Fos-IR-positive cells (Fig. 2E), indicating the involvement of EP1 in LPS-induced activation of CeA neurons. A small decrease in c-Fos expression also was noted in NTS of EP1−/− mice compared with wild-type mice, but the difference was not statistically significant (Fig. 2F). No decrease was found in either region of EP3−/− mice. In the VLM, only very sparse c-Fos staining was observed in LPS-treated wild-type mice (data not shown), which precluded quantitative comparison among mice of different genotypes. A similar c-Fos analysis also was performed in EP2−/− and EP4−/− mice. However, no difference was found in any of the above regions of EP2−/− or EP4−/− mice as compared with wild-type or control mice of identical genetic background (data not shown).
EP1 Is Localized at the Synapse on CRH-Containing Neurons in the PVN.
The above findings demonstrated that EP1 and EP3 distinctly but synergistically regulate LPS-induced CNS responses. Localization of EP3 in the brain already was studied extensively by both in situ hybridization (20, 30, 31) and immunohistochemistry (32). Whereas the former studies detected little hybridization signals for EP3 mRNA in the PVN, the latter study reported moderate EP3-IR in the neuropil in this area, suggesting that EP3 may be present at terminals of neurons projecting to this area. On the other hand, in situ hybridization studies of EP1 (20, 33) revealed weak and diffuse signals in the PVN and provide no information on its expression in CeA. No systematic analysis of EP1 immunostaining in the brain is yet available. We therefore examined EP1 expression in these areas by immunohistochemistry using an anti-EP1 antibody (24).
We first verified the specificity of this antibody by using cultured cells expressing cloned EP1 or EP3 receptor. This antibody stained COS-7 cells expressing EP1 and not cells transfected with either LacZ or EP3 (Fig. 3A). Brain sections then were subjected to staining with this antibody. As shown in Fig. 3B, EP1-IR was detected in the PVN and CeA of wild-type mice as punctate signals. On the other hand, little, if any, signal was found in the corresponding brain regions of EP1−/− mice, indicating that the IR detected in wild-type mice represents EP1. Double immunostaining showed that most of EP1-IR puncta in the PVN and CeA were colocalized with those stained for synaptophysin (Fig. 3C and data not shown). Furthermore, some, if not all, EP1-IR puncta were clearly juxtaposed with CRH-IR-positive neurons in the PVN (Fig. 3D). These data suggest that EP1 is present at the synapses on CRH-containing neurons in the PVN.
Figure 3.

Localization of EP1 in PVN and CeA. (A) Specificity of the antibody. EP1-IR of COS-7 cells expressing LacZ (Mock), EP1, or EP3 is shown. (Bar = 50 μm.) (B) EP1-IR in PVN and CeA of wild-type (WT) and EP1−/− (KO) mice. (Bar = 200 μm for PVN and 25 μm for CeA.) (C) Double immunostaining of EP1 and synaptophysin (Syp). Arrows show the colocalized signals of EP1-IR and Syp-IR. (Bar = 20 μm.) (D) Double immunostaining of EP1 and CRH. (Bar = 10 μm.)
Localization of Enzymes in PGE Synthesis.
Given the local action of PGs, the site of PGE2 synthesis is critical to understand where and how EP1 and EP3 are activated. We therefore examined the localization of enzymes responsible for PGE2 synthesis, namely, COX-1, COX-2, and mPGES-1, in the PVN by immunohistochemistry. As reported (21), COX-1-IR was expressed constitutively on glia-like cells in the PVN (Fig. 4) as well as other brain areas (data not shown) of mice with or without LPS. In contrast, COX-2-IR was inducible and was detectable in the PVN only at 3 h, but not at 1 h, after LPS challenge as a pattern reminiscent of blood vessels (Fig. 4 and data not shown). mPGES-1 also was stained in the vessel-like structure within the PVN, but the level of its expression appeared unaltered with or without LPS challenge (Fig. 4). This constitutive expression of mPGES-1 was in contrast to the previous reports that it is induced by LPS challenge (22, 34). The specificity of this mPGES-1-IR was confirmed by using two independent mPGES-1 antibodies, which yielded overlapped staining patterns (data not shown).
Figure 4.
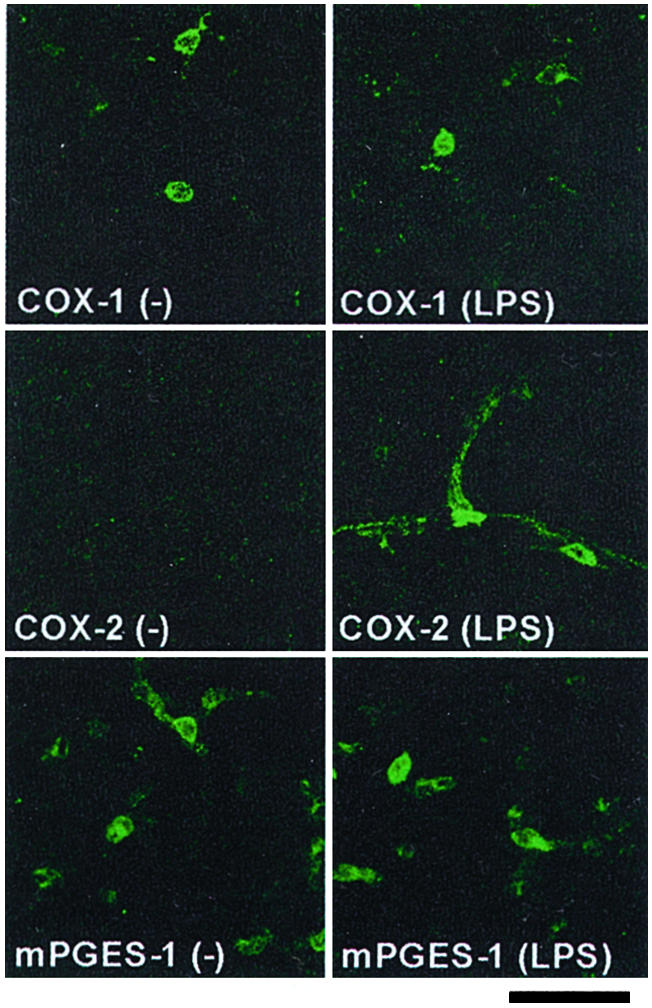
Localization of enzymes for PGE2 synthesis in the PVN. Wild-type mice were treated with or without LPS, and the brain was isolated and subjected to the analysis 3 h after injection. (Bar = 30 μm.)
Discussion
A role of PGs in the HPA axis activation induced by LPS or inflammatory cytokines has long been suggested (6–11). However, the importance and identity of the PG-mediated process in this response have remained to be examined (2). This is probably because pharmacological effects of NSAIDs were variable and because specific drugs for each PG receptor subtype were not available. With the use of knockout mice deficient in each of the four PGE receptor subtypes, we showed that LPS-induced ACTH release was impaired in mice deficient in either EP1 or EP3 but not in those lacking either EP2 or EP4 (Fig. 1). This study thus unambiguously demonstrated the direct involvement of PGE2 in LPS-induced HPA axis activation. Given the specific involvement of EP3 but not EP1 in LPS-induced fever generation (15), this study further suggests that at least some PG-mediated mechanisms are different in fever generation and ACTH release induced by LPS. Our findings appear contradictory to the current proposal that EP4 may be a primary PGE receptor mediating the HPA axis activation (35). This proposal is based on the findings that LPS injection induces EP4 in CRH-containing neurons in rat PVN (20, 35). Our results, together with the finding that the EP4 induction is sensitive to NSAID treatment (35), suggest that the EP4 induction is secondary to other PG-mediated processes.
Given the primary role of EP1 and EP3 in ACTH release, we further addressed the site at which EP1 and EP3 act in the HPA axis. The PVN and the pituitary are two critical sites regulating the HPA axis. By using c-Fos as a marker for neuronal activation, we showed that EP1- and EP3-mediated pathways are likely to converge onto the PVN (Fig. 2), although our study did not rule out their involvement in the pituitary. Given that a PG-dependent component of ACTH release is abolished in both EP1−/− and EP3−/− mice (Fig. 1), the synergistic action of EP1 and EP3 appears to be required for PVN activation for ACTH release at least under our experimental conditions. However, we do not exclude a possibility that these two pathways may work differently in time and/or in response to different doses of LPS.
Then, what are the neuronal substrates for the EP1- and EP3-mediated PVN activation? There are multiple brain areas that could regulate the PVN directly or indirectly (36). Forebrain limbic areas, including ventral subiculum, prefrontal cortex, and CeA, are thought to regulate the PVN through intermediate areas such as the bed nucleus of stria terminalis, the preoptic area, and other hypothalamic nuclei. In parallel, the medullary catecholaminergic cell groups such as the VLM directly project to and activate the PVN. Our c-Fos study (Fig. 2) revealed that the number of LPS-induced Fos-IR-positive cells was diminished in CeA of EP1−/− mice, thus implicating the EP1 action in regulating CeA neurons. Consistently, EP1-IR was detected at synapses on CeA neurons (data not shown). On the other hand, the preoptic area and the VLM are possible sites of the EP3 action, because they express EP3 (30–32) and have been suggested to be involved in PGE-mediated HPA axis activation (7, 9, 10, 37). In addition to the PVN activation from other areas, it is also possible that PGs act within the PVN. Indeed, both EP1 and EP3 are distributed in the neuropil of the PVN (Fig. 3 and ref. 32).
Then, what is the cellular mechanism of EPs to activate PVN neurons? Our immunostaining revealed that EP1-IR is localized at the synapse on PVN and CeA neurons (Fig. 3 and data not shown). This finding implicates EP1 in direct regulation of synaptic transmission in the PVN and CeA. It is also reported that EP3 regulates γ-aminobutyrate (GABA)ergic synaptic transmission by a presynaptic mechanism in the supraoptic nucleus (38). GABAergic inputs from similar areas are also found on neurons in the PVN (39). Therefore, EP1 and EP3, which are expressed in neurons, may directly regulate synaptic connections that serve for HPA axis activation. EP1 is present at only a small population of synapses on CRH-containing neurons in the PVN, indicating that EP1 regulates a distinct type of synaptic inputs to CRH-containing neurons. The origin of these projections remains to be clarified.
PGs are formed locally and act in the vicinity of their synthesis (5). It generally is believed that PG synthesis in response to LPS or inflammatory cytokines is catalyzed by COX-2 and mPGES-1 induced in brain vasculature (22, 34). We examined this issue in the PVN and confirmed that COX-2 is induced and coexpressed with mPGES-1 in brain vasculature at 3 h after injection of LPS (Fig. 4), although we found that mPGES-1 is constitutively expressed without LPS stimulation. It is possible that these enzymes catalyze the formation of PGE2 in the PVN. It was reported previously that PGE2 is produced significantly in the PVN upon IL-1β injection (40). However, induction of COX-2 in endothelial cells was not observed as early as 1 h after the injection. On the other hand, we observed constitutive expression of COX-1 in glia-like cells in the PVN. There are several reports indicating the involvement of glia in PG production in the brain. Microglial cells produce a large amount of PGs when incubated with LPS in vitro (41). PG synthesis associated with neuronal activation also was reported in astrocytes (42). Furthermore, COX-2 is constitutively expressed and localized to the somatodendritic region of excitatory neurons in the cerebral cortex, the hippocampus (including subiculum), and the amygdala (43, 44), all of which may contribute to HPA axis activation (36). Therefore, it is possible that multiple pathways for PG synthesis, each of which is activated in a different temporal pattern in response to LPS, contribute to PG-mediated HPA axis activation.
In summary, we demonstrated that two distinct pathways mediated by EP1 and EP3 are activated in response to LPS and are required for LPS-induced PVN activation in the HPA axis. This knowledge will help further clarify novel neural mechanisms implicated in sickness-induced CNS symptoms.
Acknowledgments
We thank A. Shimatsu, Y. Sugimoto, and E. Segi for helpful discussions and comments, K. Matsumura for advice on the immunohistochemistry of COX-1, COX-2, and mPGES-1, N. Eguchi for a guinea pig anti-mPGES-1 antibody, C. Hamada for advice on statistical analyses, K. Deguchi, N. Kitagawa, and T. Fujiwara for animal care and breeding, and T. Arai and H. Nose for secretarial assistance. This work was supported in part by Grants-in-Aid for Scientific Research from the Ministry of Education, Science, Sports and Culture of Japan and by grants from the Organization for Pharmaceutical Safety and Research of Japan, the Mitsubishi Foundation, and the ONO Medical Research Foundation. T.F. is a postdoctoral fellow of the Japan Society for the Promotion of Science.
Abbreviations
- ACTH
adrenocorticotropic hormone
- CeA
central nucleus of the amygdala
- COX
cyclooxygenase
- CRH
corticotropin-releasing hormone
- HPA
hypothalamo–pituitary–adrenal
- IR
immunoreactivity
- LPS
lipopolysaccharide
- mPGES-1
microsomal prostaglandin E synthase
- NSAIDs
nonsteroidal antiinflammatory drugs
- NTS
nucleus of the solitary tract
- PG
prostaglandin
- PVN
paraventricular nucleus of the hypothalamus
- VLM
ventrolateral medulla
Footnotes
This paper was submitted directly (Track II) to the PNAS office.
References
- 1.Kent S, Bluthé R-M, Kelley K W, Dantzer R. Trends Pharmacol Sci. 1992;13:24–28. doi: 10.1016/0165-6147(92)90012-u. [DOI] [PubMed] [Google Scholar]
- 2.Turnbull A V, Rivier C L. Physiol Rev. 1999;79:1–71. doi: 10.1152/physrev.1999.79.1.1. [DOI] [PubMed] [Google Scholar]
- 3.Kopin I J. Ann NY Acad Sci. 1995;771:19–30. doi: 10.1111/j.1749-6632.1995.tb44667.x. [DOI] [PubMed] [Google Scholar]
- 4.Johnson E O, Kamilaris T C, Chrousos G P, Gold P W. Neurosci Biobehav Rev. 1992;16:115–130. doi: 10.1016/s0149-7634(05)80175-7. [DOI] [PubMed] [Google Scholar]
- 5.Narumiya S, Sugimoto Y, Ushikubi F. Physiol Rev. 1999;79:1193–1226. doi: 10.1152/physrev.1999.79.4.1193. [DOI] [PubMed] [Google Scholar]
- 6.Morimoto A, Murakami N, Nakamori T, Sakata Y, Watanabe T. J Physiol (London) 1989;411:245–256. doi: 10.1113/jphysiol.1989.sp017571. [DOI] [PMC free article] [PubMed] [Google Scholar]
- 7.Katsuura G, Arimura A, Koves K, Gottschall P E. Am J Physiol. 1990;258:163–171. doi: 10.1152/ajpendo.1990.258.1.E163. [DOI] [PubMed] [Google Scholar]
- 8.Rivier C, Vale W. Endocrinology. 1991;129:384–388. doi: 10.1210/endo-129-1-384. [DOI] [PubMed] [Google Scholar]
- 9.Lacroix S, Rivest S. J Comp Neurol. 1997;387:307–324. doi: 10.1002/(sici)1096-9861(19971020)387:2<307::aid-cne11>3.0.co;2-r. [DOI] [PubMed] [Google Scholar]
- 10.Ericsson A, Arias C, Sawchenko P E. J Neurosci. 1997;15:7166–7179. doi: 10.1523/JNEUROSCI.17-18-07166.1997. [DOI] [PMC free article] [PubMed] [Google Scholar]
- 11.Nasushita R, Watanobe H, Takebe K. Prostaglandins Leukotrienes Essent Fatty Acids. 1997;56:165–168. doi: 10.1016/s0952-3278(97)90515-9. [DOI] [PubMed] [Google Scholar]
- 12.Murata T, Ushikubi F, Matsuoka T, Hirata M, Yamasaki A, Sugimoto Y, Ichikawa A, Aze Y, Tanaka T, Yoshida N, et al. Nature. 1997;388:678–682. doi: 10.1038/41780. [DOI] [PubMed] [Google Scholar]
- 13.Sugimoto Y, Yamasaki A, Segi E, Tsuboi K, Aze Y, Nishimura T, Oida H, Yoshida N, Tanaka T, Katsuyama M, et al. Science. 1997;277:681–683. doi: 10.1126/science.277.5326.681. [DOI] [PubMed] [Google Scholar]
- 14.Segi E, Sugimoto Y, Yamasaki A, Aze Y, Oida H, Nishimura T, Murata T, Matsuoka T, Ushikubi F, Hirose M, et al. Biochem Biophys Res Commun. 1998;246:7–12. doi: 10.1006/bbrc.1998.8461. [DOI] [PubMed] [Google Scholar]
- 15.Ushikubi F, Segi E, Sugimoto Y, Murata T, Matsuoka T, Kobayashi T, Hizaki H, Tuboi K, Katsuyama M, Ichikawa A, et al. Nature. 1998;395:281–284. doi: 10.1038/26233. [DOI] [PubMed] [Google Scholar]
- 16.Hizaki H, Segi E, Sugimoto Y, Hirose M, Saji T, Ushikubi F, Matsuoka T, Noda Y, Tanaka T, Yoshida N, et al. Proc Natl Acad Sci USA. 1999;96:10501–10506. doi: 10.1073/pnas.96.18.10501. [DOI] [PMC free article] [PubMed] [Google Scholar]
- 17.Matsuoka T, Hirata M, Tanaka H, Takahashi Y, Murata T, Kabashima K, Sugimoto Y, Kobayashi T, Ushikubi F, Aze Y, et al. Science. 2000;287:2013–2017. doi: 10.1126/science.287.5460.2013. [DOI] [PubMed] [Google Scholar]
- 18.Takao T, Nakata H, Tojo C, Kurokawa H, Nishioka T, Hashimoto K, De Souza E. Brain Res. 1994;649:265–270. doi: 10.1016/0006-8993(94)91073-1. [DOI] [PubMed] [Google Scholar]
- 19.Watanabe K, Kawamori T, Nakatsuji S, Ohta T, Ohuchida S, Yamamoto H, Maruyama T, Kondo K, Ushikubi F, Narumiya S, et al. Cancer Lett. 2000;156:57–61. doi: 10.1016/s0304-3835(00)00440-7. [DOI] [PubMed] [Google Scholar]
- 20.Oka T, Oka K, Scammell T E, Lee C, Kelly J F, Nantel F, Elmquist J E, Saper C B. J Comp Neurol. 2000;428:20–32. doi: 10.1002/1096-9861(20001204)428:1<20::aid-cne3>3.0.co;2-x. [DOI] [PubMed] [Google Scholar]
- 21.Li S, Wang Y, Matsumura K, Ballou L R, Morham S G, Balatteis C M. Brain Res. 1999;825:86–94. doi: 10.1016/s0006-8993(99)01225-1. [DOI] [PubMed] [Google Scholar]
- 22.Yamagata K, Matsumura K, Inoue W, Shiraki T, Suzuki K, Yasuda S, Sugiura H, Cao C, Watanabe Y, Kobayashi S. J Neurosci. 2001;21:2669–2677. doi: 10.1523/JNEUROSCI.21-08-02669.2001. [DOI] [PMC free article] [PubMed] [Google Scholar]
- 23.Lazarus M, Kubata B K, Eguchi N, Fujitani Y, Urade Y, Hayaishi O. Arch Biochem Biophys. 2002;397:336–341. doi: 10.1006/abbi.2001.2614. [DOI] [PubMed] [Google Scholar]
- 24.Bhattacharya M, Peri K G, Almazan G, Ribeiro-da-Silva A, Shichi H, Durocher Y, Abramovitz M, Hou X, Varma D R, Chemtob S. Proc Natl Acad Sci USA. 1998;95:15792–15797. doi: 10.1073/pnas.95.26.15792. [DOI] [PMC free article] [PubMed] [Google Scholar]
- 25.Calogero A E, Gallucci W T, Kling M A, Chrousos G P, Gold P W. Brain Res. 1989;505:7–11. doi: 10.1016/0006-8993(89)90109-1. [DOI] [PubMed] [Google Scholar]
- 26.Fujiwaki R, Hata K, Nakayama K, Moriyama M, Iwanari O, Katabuchi H, Okamura H, Sakai E, Miyazaki K. Int J Cancer. 2002;99:328–335. doi: 10.1002/ijc.10319. [DOI] [PubMed] [Google Scholar]
- 27.Rivier C. In: Bilateral Communication Between the Endocrine and Immune Systems. Grossman C, editor. Vol. 7. New York: Springer; 1994. pp. 183–196. [Google Scholar]
- 28.Shin C, McNamara J O, Morgan J I, Curran T, Cohen D R. J Neurochem. 1990;55:1050–1055. doi: 10.1111/j.1471-4159.1990.tb04595.x. [DOI] [PubMed] [Google Scholar]
- 29.Elmquist J K, Scammell T E, Jacobson C D, Saper C B. J Comp Neurol. 1996;371:85–103. doi: 10.1002/(SICI)1096-9861(19960715)371:1<85::AID-CNE5>3.0.CO;2-H. [DOI] [PubMed] [Google Scholar]
- 30.Sugimoto Y, Shigemoto R, Namba T, Negishi M, Mizuno N, Narumiya S, Ichikawa A. Neuroscience. 1994;62:919–928. doi: 10.1016/0306-4522(94)90483-9. [DOI] [PubMed] [Google Scholar]
- 31.Ek M, Arias C, Sawchenko P, Ericsson-Dahlstrand A. J Comp Neurol. 2000;428:5–20. doi: 10.1002/1096-9861(20001204)428:1<5::aid-cne2>3.0.co;2-m. [DOI] [PubMed] [Google Scholar]
- 32.Nakamura K, Kaneko T, Yamashita Y, Hasegawa H, Katoh H, Negishi M. J Comp Neurol. 2000;421:543–569. doi: 10.1002/(sici)1096-9861(20000612)421:4<543::aid-cne6>3.0.co;2-3. [DOI] [PubMed] [Google Scholar]
- 33.Batshake B, Nilsson C, Sundelin J. Eur J Biochem. 1995;231:809–814. doi: 10.1111/j.1432-1033.1995.tb20765.x. [DOI] [PubMed] [Google Scholar]
- 34.Ek M, Engblom D, Saha S, Blomqvist A, Jakobsson P, Ericsson-Dahlstrand A. Nature. 2001;410:430–431. doi: 10.1038/35068632. [DOI] [PubMed] [Google Scholar]
- 35.Zhang J, Rivest S. J Neurochem. 2000;74:2134–2145. doi: 10.1046/j.1471-4159.2000.0742134.x. [DOI] [PubMed] [Google Scholar]
- 36.Herman J P, Cullinan W E. Trends Neurosci. 1997;20:78–84. doi: 10.1016/s0166-2236(96)10069-2. [DOI] [PubMed] [Google Scholar]
- 37.Scammell T E, Elmquist J K, Griffin J D, Saper C B. J Neurosci. 1996;16:6246–6254. doi: 10.1523/JNEUROSCI.16-19-06246.1996. [DOI] [PMC free article] [PubMed] [Google Scholar]
- 38.Shibuya I, Setiadji S V, Ibrahim N, Harayama N, Maruyama T, Ueta Y, Yamashita H. J Neuroendocrinol. 2002;14:64–72. doi: 10.1046/j.1365-2826.2002.00741.x. [DOI] [PubMed] [Google Scholar]
- 39.Armstrong W E. In: The Rat Nervous System. 2nd Ed. Paxinos G, editor. San Diego: Academic; 1995. pp. 377–390. [Google Scholar]
- 40.Watanobe H, Takebe K. Neuroendocrinology. 1994;60:8–15. doi: 10.1159/000126714. [DOI] [PubMed] [Google Scholar]
- 41.Minghetti L, Levi G. Prog Neurobiol. 1998;54:99–125. doi: 10.1016/s0301-0082(97)00052-x. [DOI] [PubMed] [Google Scholar]
- 42.Bezzi P, Carmingnoto G, Pasti L, Vesce S, Rossi D, Lodi Rizzini B, Pozzan T, Volterra A. Nature. 1998;391:281–285. doi: 10.1038/34651. [DOI] [PubMed] [Google Scholar]
- 43.Breder C D, Dewitt D, Kraig R P. J Comp Neurol. 1995;355:296–315. doi: 10.1002/cne.903550208. [DOI] [PMC free article] [PubMed] [Google Scholar]
- 44.Kaufmann W E, Worley P F, Pegg J, Bremer M, Isakson P. Proc Natl Acad Sci USA. 1996;93:2317–2321. doi: 10.1073/pnas.93.6.2317. [DOI] [PMC free article] [PubMed] [Google Scholar]