

Abstract
A central question in protein–DNA recognition is the origin of the specificity that permits binding to the correct site in the presence of excess, nonspecific DNA. In the P22 Arc repressor, the Phe-10 side chain is part of the hydrophobic core of the free protein but rotates out to pack against the sugar-phosphate backbone of the DNA in the repressor-operator complex. Characterization of a library of position 10 variants reveals that Phe is the only residue that results in fully active Arc. One class of mutants folds stably but binds operator with reduced affinity; another class is unstable. FV10, one member of the first class, binds operator DNA and nonoperator DNA almost equally well. The affinity differences between FV10 and wild type indicate that each Phe-10 side chain contributes 1.5–2.0 kcal to operator binding but less than 0.5 kcal/mol to nonoperator binding, demonstrating that contacts between Phe-10 and the operator DNA backbone contribute to binding specificity. This appears to be a direct contribution as the crystal structure of the FV10 dimer is similar to wild type and the Phe-10-DNA backbone interactions are the only contacts perturbed in the cocrystal structure of the FV10-operator complex.
Keywords: Arc repressor, operator DNA, phosphate contacts, protein core, mutants
The molecular architectures of many complexes of transcription factors and other DNA-binding proteins with their specific DNA recognition sites have been determined. In examining these structures, it is natural to focus on contacts between protein side chains and DNA bases as the primary way in which binding specificity is achieved. Recognition, however, is a structural process in which the overall fit of the entire protein and the DNA needs to be considered. In fact, relatively little is known in precise terms about the determinants of DNA-binding specificity, in part because a side chain will contribute to specificity only to the extent that it makes stronger contacts with its specific DNA than with nonspecific DNA. This contribution cannot be determined by inspection of a specific complex alone, and structural information for nonspecific complexes is scant.
Arc is a small, homodimeric repressor of the ribbon–helix–helix family of transcription factors (1). In the cocrystal structure, Arc dimers bind to adjacent subsites of a 21-bp operator, and the β-sheet and N-terminal arms of an Arc dimer are positioned to contact a DNA subsite (2). As shown in Fig. 1A, the aromatic rings of Phe-10 and Phe-10′ protrude from the β-sheet and pack against phosphate oxygens and ribose atoms of the DNA backbone. In the free Arc dimer, Phe-10 is predominantly buried in the hydrophobic core (≈12% solvent accessibility), but NMR studies suggest that Phe-10 is in dynamic equilibrium between its “free” core position and its operator “bound” position (3–5). Fig. 1B shows that the Phe-10 ring must move from its position in the free dimer by rotation about χ1 to permit contacts with the operator backbone.
Figure 1.

(A) In the Arc-operator complex (2), the N-terminal arms and β-sheet of each Arc dimer are positioned to contact the operator DNA, and the side chains of Phe-10 and Phe-10′ interact with phosphate oxygen and ribose atoms of the DNA backbone. These contacts between Phe-10 and the DNA backbone contribute to both the specificity and affinity of operator binding as described in the text. This panel and Fig. 3A were prepared by using molscript (26). (B) Superimposition of the conformation of the Phe-10 side chain in unbound Arc (blue) and operator-bound Arc (yellow).
Previous studies have shown that mutations at Phe-10 can reduce operator binding and protein stability (6–8). Here, we ask whether any other amino acid side chains can replace Phe-10 and produce a stably folded protein with full repressor activity. We then characterize the stability and DNA-binding affinity of several of the position 10 mutants and determine the crystal structure of the FV10 protein alone and in complex with operator DNA. The genetic studies show that Phe-10 is unique among the naturally occurring amino acids in being compatible with stable Arc folding and strong, specific operator binding. The biochemical and crystallographic studies strongly suggest that interactions between Phe-10 and the sugar-phosphate backbone of operator DNA contribute directly to Arc’s operator affinity and ability to discriminate between operator and nonoperator DNA.
METHODS
Mutagenesis and Screening.
A position 10 Arc library was constructed in plasmid pSA300, which contains a synthetic arc gene under control of a tac promoter, and a strS gene under the control of an Arc-repressible promoter (9). Mutants were generated by cassette or PCR mutagenesis using standard procedures. Escherichia coli strain X90 was transformed with mutagenized plasmid, clones were isolated, and mutations were identified by DNA sequencing. Measurement of the intracellular steady-state levels of Arc mutants was performed by electrophoresis of whole-cell lysates on SDS-polyacrylamide gels as described (10). One group of mutants had levels of protein accumulation similar to wild type. The remaining mutants were present at less than 10% of the wild-type level.
Mutants were screened for function in E. coli strain UA2F. Active Arc represses transcription of the cat gene in this strain and thus, in the presence of chloramphenicol, cells producing inactive protein live and those producing active protein die (11). pSA300 also contains an Arc-repressible strS gene (9). In the presence of active protein, transcription of the dominant strS gene is repressed and the cell can grow in the presence of streptomycin. E. coli UA2F cells were transformed with the mutant library, grown overnight at 37°C in Luria–Bertani (LB)-ampicillin broth, diluted 100-fold into LB-ampicillin broth, and grown for 3 h to midlog phase. At this point, the cultures were divided equally, and Arc expression was induced in one portion by adding isopropyl β-d-thiogalactoside (IPTG) to 100 μg/ml. Growth was continued for 30 min, and the cultures were struck either onto LB agar supplemented with 100 μg/ml of chloramphenicol, 100 μg/ml of ampicillin, 50 μg/ml of kanamycin, and 0.5 mg/ml of IPTG where appropriate, or onto similar plates in which the chloramphenicol was replaced with 50 μg/ml of streptomycin. Mutants were scored as partially active if they conferred resistance to streptomycin and/or susceptibility to chloramphenicol only when transcription of the mutant arc gene was induced with IPTG.
Protein Purification and Stability.
Arc and mutant proteins were purified to apparent homogeneity as described (12). The unfolding reaction is a concerted transition between native dimers and denatured monomers and was measured in a buffer containing 50 mM Tris⋅HCl, pH 7.5, 100 mM KCl, and 0.2 mM EDTA (7, 12). For thermal melts, protein at a concentration of 10 μM was heated in 1°C steps and equilibrated for 1 min at each temperature, and the circular dichroism (CD) ellipticity at 222 nm was averaged for 30 s. Urea denaturation was performed at 25°C by using 10 μM protein. The extent of denaturation was monitored by changes in ellipticity at 230 nm by using an Aviv 60DS CD spectrometer (Aviv Associates, Lakewood, NJ). Data were fit as described (7, 10, 12).
DNA-Binding Assays.
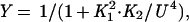
Gel mobility-shift assays were used to monitor binding of Arc and Arc mutants to the 27-bp arc operator DNA fragment O1 at 25°C in a buffer containing 10 mM Tris⋅HCl, pH 7.5, 100 mM KCl, 3 mM MgCl2, 0.1 mM EDTA, 0.02% Nonidet P-40, and 100 μg/ml BSA (13, 14). The binding data were fit to the equations:
 |
 |
where Y is the fraction of bound, 32P-labeled operator DNA, K1 is the equilibrium constant for dimer dissociation and unfolding, K2 is the equilibrium constant for dissociation of the tetrameric protein–DNA complex into two free dimers and operator DNA, PT is the total concentration of Arc in monomer equivalents, and U is the free concentration of Arc monomers (14).
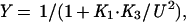
Competition gel mobility-shift assays were performed under the same conditions used for the gel shift assays. Each assay tube contained 10 pM of a 22-bp, 32P-end-labeled, DNA duplex (top strand; 5′-CCTGACATGATAGAAGCACGTT-3′) containing the left arc operator subsite (underlined) and either wild-type Arc (1.6 nM) or the mutant FV10 protein (200 nM). Competitor DNA was either the unlabeled 22-bp subsite duplex or double-stranded, calf-thymus DNA (Amersham Pharmacia) sonicated to an average length of 200 bp. Equilibrium dissociation constants were calculated from nonspecific DNA competition experiments by fitting to the equations:
 |
 |
 |
 |
where Y is the fraction of bound, 32P-labeled subsite DNA in the experiment, K1 and U are defined above, K3 is the equilibrium constant for dissociation of an Arc dimer from single-subsite DNA, FREEDNA and DNATOT are the concentrations of free and total competitor DNA (in units of mol/liter of bp equivalents), and KC is the equilibrium constant for dissociation of an Arc dimer from a 10-bp site in nonspecific DNA. These equations ignore the small concentration of Arc bound to the labeled DNA, assume that all nonspecific sites have the same affinity for Arc, and assume that DNA contains overlapping nonspecific sites of 10 bp. This last assumption is not critical, as changing the site size to 5 or 15 bp instead of 10 bp changes the derived values of KC by less than 30%. For experiments in which unlabeled subsite DNA was the competitor, the concentration of free competitor (mol/liter of the 22-bp duplex) was calculated as FREEDNA = DNATOT⋅(1−Y) and KC was set equal to K3.
Crystallization and Structure Determination.
Crystals of the FV10 dimer (space group P212121) were obtained by seeding with small crystals of wild-type Arc (15), and diffraction data were collected at room temperature. Rigid-body refinement, Powell energy minimization, simulated-annealing refinement, and restrained individual atomic B-factor refinement were performed by using x-plor version 3.1 (16). To minimize model bias, overlapping simulated-annealing omit maps were calculated and used to direct rebuilding of the models and structural changes were accepted only if they reduced Rfree. Wild-type cocrystals (space group P21) of Arc bound to a 21-bp operator duplex with single-base, complementary 5′ overhangs were grown as described (2). Crystals of the FV10-operator DNA complex were obtained only after seeding with small crystals of the wild-type Arc-operator complex. Diffraction data from the mutant and wild-type cocrystals were collected at low temperature in a stream of cold nitrogen. Both structures were determined by using the refinement methods described above. The coordinates of the room-temperature FV10 dimer (ID code 1BAZ), the low-temperature FV10-operator complex (ID code 1BDV), and the low-temperature wild-type complex (ID code 1BDT) may be obtained from the Brookhaven Protein Data Bank. The previously determined room-temperature wild-type cocrystal structure (ID code 1PAR) and the low-temperature wild-type cocrystal structure (ID code 1BDT) have an rms deviation of 0.48 Å for Cα atoms of the protein and P atoms of the DNA backbone.
RESULTS
Mutagenesis.
Genetic experiments show that Phe-10 plays a unique role in Arc function, which cannot be replaced by other naturally occurring amino acids. The codon for Phe-10 was randomized, and transformants were screened for Arc repressor function and steady-state expression levels in vivo. Phe was recovered as the only amino acid that resulted in a stable Arc protein with full biological activity. The mutants comprise three groups: (A) variants with Val, Ile, Leu, Met, and Tyr showed reduced activity but had steady-state levels within 50% of wild type; (B) the His mutant had reduced activity and a steady-state level less than 10% of wild type; and (C) the Gly, Ala, Ser, Thr, Pro, Asp, Glu, Gln, Lys, Arg, and Trp mutants had expression levels less than 10% of wild type and showed no activity. Asn and Cys were not recovered but based on chemical similarity to other inactive mutants are probably also incapable of substituting for Phe-10. Because proteolysis reduces the steady-state levels of unstable Arc mutants (9, 10), the class B and C mutants are likely to be less stable than wild type and the class A mutants.
Dimer Stability and Operator DNA Binding.
The FV10, FY10, and FH10 mutants were purified for comparisons of protein stability and operator binding with wild-type Arc. In thermal denaturation experiments (Fig. 2A), wild-type Arc (tm 53.7°C) was found to be the most thermally stable, followed by FV10 (tm 52.3°C), FY10 (tm 47.8°C), and FH10 (tm 44.7°C). The same rank order of stabilities was observed in equilibrium constants of dimer dissociation and unfolding (Ku) calculated from urea-denaturation experiments (Table 1). These studies show that replacing Phe-10 with Val, Tyr, or His destabilizes Arc but only by 0.2, 0.6, and 1.0 kcal/mol, respectively.
Figure 2.

(A) Thermal stability monitored by circular dichroism. (B) Operator-DNA binding assayed by gel mobility-shift experiments. The dotted lines are theoretical fits of the data by using the Ku and K2 values listed in Table 1.
Table 1.
Equilibrium dimer stability and operator binding
| Protein | Ku, M | ΔΔGu, kcal/mol | K2, M2 | ΔΔGd, kcal/mol |
|---|---|---|---|---|
| Arc | 7.0 × 10⁻⁸ | 0.0 | 1.5 × 10⁻²³ | 0.0 |
| FV10 | 1.0 × 10⁻⁷ | 0.2 | 2.0 × 10⁻¹⁹ | 5.6 |
| FY10 | 1.9 × 10⁻⁷ | 0.6 | 6.0 × 10⁻²⁰ | 4.9 |
| FH10 | 3.8 × 10⁻⁷ | 1.0 | 8.0 × 10⁻²² | 2.3 |
Ku is the equilibrium constant for dimer dissociation and unfolding (A2 ⇌ 2U) at 25°C, pH 7.5, 100 mM KCl, 0.2 mM EDTA calculated from urea denaturation experiments. ΔΔGu = −RT ln(Ku−mut/Ku−wt). K2 is the equilibrium constant for dissociation of the A4O operator complex to free dimers and operator (A4O ⇌ 2A2 + O). ΔΔGd = −RT ln(K2−mut/K2−wt).
As shown in Fig. 2B, wild-type Arc binds to operator DNA with higher affinity than do any of the purified mutants. Some of the reduced operator affinities of these mutants results from their reduced dimer stabilities because operator binding is thermodynamically linked to folding and dimerization (13). However, even after correcting for differences in dimer stability, the mutant proteins bind operator more poorly than wild type. Table 1 lists equilibrium constants (K2) for dissociation of two wild-type or mutant dimers from operator DNA. The corresponding ΔΔGd values (Table 1) show that the wild-type dimer binds operator best followed by the dimers of FH10, FY10, and FV10. Among the three mutants, the His-10 side chain apparently is able to make more energetically favorable operator contacts than the Tyr-10 or Val-10 side chains.
Crystal Structures of FV10 and the FV10-Operator Complex.
We chose FV10 for further characterization and crystallized the FV10 dimer by itself and in complex with the arc operator. The FV10 dimer structure was solved at 1.9-Å resolution and the FV10-operator complex was solved at 2.8-Å resolution. Data and refinement statistics are given in Table 2. The FV10 dimer structure is very similar to wild type with an 0.4-Å rms deviation for the main-chain atoms of residues 6–46 (Fig. 3A). The most significant structural change occurs near the site of the mutation in the β-sheet and involves a movement of the Cα atom of Val-10 toward the hydrophobic core of the protein. This Cα shift of Val-10 mimics a Cα shift of Phe-10 that is observed in the cocrystal structure of wild-type Arc (Fig. 3B; ref. 2). In both cases, the movement of the Cα of residue 10 and nearby main-chain atoms can be viewed as a relaxation that prevents formation of a cavity or void in the protein core. Without such relaxation, cavities would be created in the FV10 dimer when Phe-10 was replaced with the smaller Val side chain and in the wild-type cocrystal when the Phe-10 side chain moves out of the core to contact the DNA sugar-phosphate backbone.
Table 2.
Statistics for crystallographic data processing and refinement
| FV10 1BAZ | FV10-operator 1BDV | Arc-operator 1BDT | |
|---|---|---|---|
| Measured reflections | 43,212 20.0–1.9 Å | 24,727 20.0–2.8 Å | 32,910 20.0–2.5 Å |
| Unique reflections | 16,796 20.0–1.9 Å | 8691 20.0–2.8 Å | 12,055 20.0–2.5 Å |
| Data completeness | 89.9% 20.0–1.9 Å | 97.5% 20.0–2.8 Å | 98.3% 20.0–2.5 Å |
| Rmerge | 0.087 | 0.081 | 0.075 |
| Rcryst (90% of data) | 0.213 6.0–1.9 Å | 0.252 20.0–2.8 Å | 0.236 20.0–2.5 Å |
| Rfree (10% of data) | 0.273 6.0–1.9 Å | 0.297 20.0–2.8 Å | 0.282 20.0–2.5 Å |
| Total protein and DNA atoms | 1,530 | 2,452 | 2,676 |
| Total waters | 67 | 35 | 83 |
| rmsd ideal bond lengths | 0.010 Å | 0.010 Å | 0.007 Å |
| rmsd ideal bond angles | 1.434° | 1.573° | 1.339° |
rmsd, rms deviation.
Figure 3.

(A) Superposition of backbone traces of the structures of the wild-type Arc dimer (cyan) and the mutant FV10 dimer (magenta). The Cα atoms of Phe-10 and Val-10 are shown as small spheres. (B) Superposition of the polypeptide backbones of residues 8–14 of wild-type Arc (magenta), the FV10 mutant (cyan), and wild-type Arc in the operator-bound complex (gold). The side chains of Phe-10 or Val-10, Leu-12, and Trp-14 also are shown.
The structure of the FV10 tetramer-operator complex was solved from diffraction data collected at low temperature. We also redetermined the structure of the wild-type complex under the same conditions to allow better comparisons of the two structures. As shown in Fig. 4, the operator complexes of wild-type Arc and FV10 are extremely similar, with an 0.35-Å rms deviation for all atoms of the protein and DNA backbones. The most significant difference between the two cocrystal structures is that the Val-10 side chain is too far from the sugar-phosphate backbone of the operator DNA to make strong contacts. The side chain-base contacts in the FV10 protein–DNA interface are similar to those in wild type. Fig. 5, for example, shows that Gln-9 and Asn-11, two of the major base-contact residues, have the same basic conformations in the wild-type and FV10 complexes. Hence, the FV10 mutation does not result in significant structural rearrangements in the mutant dimer or in the mutant protein–DNA complex.
Figure 4.

Superimposition of the protein and DNA backbones from the protein-DNA cocrystal structures of wild-type Arc (yellow) and the FV10 mutant (orange). The wild-type Phe-10 side chains and mutant Val-10 side chains are shown in ball-and-stick representation.
Figure 5.

The base-contact residues, Gln-9 and Asn-11, have similar conformations in the wild-type Arc (Right) and FV10 (Left) cocrystal structures. Residues from the Arc B subunit are shown, and the electron density (1 σ) is from simulated-annealing omit maps.
Specificity of FV10-DNA Binding.
To quantify the contributions of Phe-10 to specific and nonspecific DNA binding, calf-thymus DNA and a 22-bp duplex containing a single arc operator subsite were used to compete for binding of wild-type Arc or the FV10 mutant to radiolabeled subsite DNA (Fig. 6). Fig. 6 (Upper) shows that calf-thymus DNA is a relatively poor competitor for wild-type Arc binding compared with operator-subsite DNA. By contrast, Fig. 6 (Lower) shows that specific and nonspecific DNA compete almost equally well for binding of the FV10 mutant protein. Thus, replacing Phe-10 with Val dramatically reduces Arc’s ability to discriminate between subsite operator DNA and nonoperator DNA.
Figure 6.

Competition of unlabeled specific and nonspecific DNA for wild-type Arc (Upper) or FV10 (Lower) binding to a 22-bp, 32P-labeled oligonucleotide containing the left arc operator subsite. Competition was assayed by the reduction in the binding of protein to the labeled subsite DNA in gel mobility-shift experiments.
Equilibrium dissociation constants for Arc and the FV10 mutant for operator-subsite DNA and nonspecific DNA are listed in Table 3. The FV10 mutation reduces the affinity for a site in nonspecific DNA by 4-fold (ΔΔG ≈ 0.8 kcal/mol) but reduces the affinity for an operator subsite by 1,400-fold (ΔΔG ≈ 4.2 kcal/mol). These data indicate that Phe-10 makes far stronger contacts with operator than with nonoperator DNA, thereby playing an important role in determining DNA-binding specificity as well as operator affinity.
Table 3.
Operator and nonoperator DNA binding
| Kd calf-thymus DNA | Kd operator-subsite DNA | |
|---|---|---|
| Wild type | 8.7 ± 3.6⋅10−8 M | 1.2 ± 0.6⋅10−11 M |
| FV10 | 3.3 ± 1.0⋅10−7 M | 1.7 ± 0.4⋅10−8 M |
| ΔΔGd | 0.8 ± 0.4 kcal/mol | 4.2 ± 2.4 kcal/mol |
Kd values are the average of three independent experiments (±SD) for experiments performed at 25°C, pH 7.5, and 100 mM KCl. The equilibrium constants for nonspecific DNA are microscopic constants for dissociation of an Arc dimer from a single nonspecific site. The equilibrium constants for arc operator DNA are for dissociation of an Arc dimer from a single subsite (for the sequence of the 22-bp subsite DNA, see ref. 14. ΔΔGd = −RT ln(Kd−wt/Kd−FV10).
DISCUSSION
The Phe-10 side chain plays a dual role in the structure and function of Arc repressor. In the free protein, it is an important contributor to dimer stability as part of the hydrophobic core and, in the operator-bound form, it is an important contributor to DNA binding affinity by packing against the sugar-phosphate backbone. Moving the Phe-10 side chain from the free to the operator-bound conformation exchanges protein–protein contacts for protein–DNA contacts (2, 3). In the free Arc dimer, 104 atoms of other amino acids are within 6 Å of the Phe-10 side chain. In the bound conformation, the number of protein atoms within this distance is reduced by 19 but these lost contacts are replaced by 35 new contacts of 6 Å or less with operator DNA atoms. Some of these new Phe-10-DNA contacts involve weakly polar interactions in which DNA phosphate oxygens are in the same plane and close to the Phe-10 ring, allowing the negative charge on the oxygens to interact favorably with the partial positive charge of the aromatic ring hydrogens (17, 18).
Mutagenic experiments show that no other amino acid can replace both the stability and DNA binding functions of Phe-10. Mutants with Ala, Gly, Ser, Thr, Pro, Asp, Gln, Glu, His, Lys, Arg, or Trp at position 10 are expressed at low levels, presumably because their instability results in proteolysis, and most are inactive in the cell. For the FH10 substitution, the dimer stability of the purified mutant protein is reduced by 1 kcal/mol and the free energy of operator binding is reduced by 2.3 kcal/mol, showing destabilizing effects on protein stability and operator binding. Mutants with Val, Tyr, Ile, Leu, or Met at position 10 are expressed at near wild-type levels but are only partially active in the cell. The purified FV10 and FY10 mutants have dimer stabilities reduced by 0.2 and 0.6 kcal/mol and free energies of tetramer-operator dissociation reduced by 5.6 kcal/mol and 4.9 kcal/mol, respectively.
Because the crystal structures of the FV10 dimer and the FV10-operator complex are very similar to the corresponding wild-type structures, much of the reduction in operator affinity observed for FV10 probably is caused directly by loss of the interactions between the Phe-10 side chain and the phosphate oxygens of the DNA backbone. In solution, the Phe-10-backbone contacts also may help to stabilize Arc’s β-sheet against wobbling, sliding, or twisting motions and thereby indirectly stabilize the side chain-base contacts made by other β-sheet residues.
As discussed above, it is not surprising that mutations like Phe-10→Val reduce operator binding affinity. However, comparison of the operator and nonoperator DNA binding affinities of wild-type Arc and the FV10 mutant shows that Phe-10 contributes to binding specificity as well as to binding affinity. The FV10 mutation decreases the specificity of binding for a single operator subsite by 350-fold, where specificity is defined as Knonspec/Ksubsite.
How does Phe-10 contribute to binding specificity? Several models could explain why Phe-10 makes better energetic contacts with the DNA backbone of an operator site than with the DNA backbone of a nonoperator site. Steric or hydrogen-bonding clashes may keep the β-sheet of Arc from fitting tightly into the major groove of a nonspecific site, thereby preventing Phe-10 from approaching the backbone closely enough to permit strong contacts. A similar situation is observed for the DNA-binding domain of glucocorticoid receptor bound to cognate and noncognate DNA sites (19, 20). Phe-10 may remain buried in the protein core in nonspecific complexes and therefore be unable to contact the DNA backbone. Finally, the base sequence of the arc operator may influence the conformation of the DNA-backbone atoms that are contacted by Phe-10, resulting in indirect readout of sequence (21–23). Each of these models predicts that Phe-10 will have different geometrical relationships to the backbone phosphates of operator and nonoperator sites and thus that the free energies of these interactions will differ significantly.
The results presented here show that contacts between the side chains of Phe-10 and the sugar-phosphate backbone are essential determinants of Arc repressor’s operator DNA binding specificity. Interactions with the phosphate backbone previously have been implicated in altering the DNA binding specificity of λ repressor (24, 25). If such interactions also are involved in determining the specificity of other protein–DNA interactions, as seems likely, then descriptions of the origins of binding specificity need to consider these interactions explicitly. Moreover, designing additional phosphate-backbone contacts into complexes might provide a means of improving the binding specificity of transcription factors and other DNA-binding proteins.
Acknowledgments
We thank Mark Rould, Tracy Smith, Dennis Rentzeperis, and Marcos Milla for help and advice and Carl Pabo for the use of x-ray equipment. This work was supported by National Institutes of Health Grant AI-16892 and postdoctoral fellowships from the American Cancer Society (J.F.S.) and the National Institutes of Health (A.W.K.).
Footnotes
Data deposition: The atomic coordinates reported in this paper have been deposited in the Protein Data Bank, Biology Department, Brookhaven National Laboratory, Upton, NY 11973 (PDB ID codes 1BAZ, 1BDV, and 1BDT).
References
- 1.Raumann B E, Brown B M, Sauer R T. Curr Opin Struct Biol. 1994;4:36–43. [Google Scholar]
- 2.Raumann B E, Rould M A, Pabo C O, Sauer R T. Nature (London) 1994;367:754–757. doi: 10.1038/367754a0. [DOI] [PubMed] [Google Scholar]
- 3.Breg J N, van Ophesden J H J, Burgering M J, Boelens R, Kaptein R. Nature (London) 1990;346:586–589. doi: 10.1038/346586a0. [DOI] [PubMed] [Google Scholar]
- 4.Bonvin A M J J, Vis H, Breg J N, Burgering M J M, Boelens R, Kaptein R. J Mol Biol. 1994;236:328–341. doi: 10.1006/jmbi.1994.1138. [DOI] [PubMed] [Google Scholar]
- 5.Nooren, I. M. A., Bietveld, A. W. M., Melacini, G., Sauer, R. T., Kaptein, R. & Boelens, R. (1999) Biochemistry, in press. [DOI] [PubMed]
- 6.Vershon A K, Blackmer K, Sauer R T. In: Protein Engineering: Applications in Science, Medicine, and Industry. Inouye M, Sarma R, editors. Orlando, FL: Academic; 1986. pp. 243–256. [Google Scholar]
- 7.Milla M E, Brown B M, Sauer R T. Nat Struct Biol. 1994;1:518–523. doi: 10.1038/nsb0894-518. [DOI] [PubMed] [Google Scholar]
- 8.Brown B M, Milla M E, Smith T L, Sauer R T. Nat Struct Biol. 1994;1:164–168. doi: 10.1038/nsb0394-164. [DOI] [PubMed] [Google Scholar]
- 9.Bowie J U, Sauer R T. J Biol Chem. 1989;264:7596–7602. [PubMed] [Google Scholar]
- 10.Milla M E, Brown B M, Sauer R T. Protein Sci. 1993;2:2198–2205. doi: 10.1002/pro.5560021219. [DOI] [PMC free article] [PubMed] [Google Scholar]
- 11.Vershon A K, Bowie J U, Karplus T M, Sauer R T. Proteins Struct Funct Genet. 1986;1:302–311. doi: 10.1002/prot.340010404. [DOI] [PubMed] [Google Scholar]
- 12.Bowie J U, Sauer R T. Biochemistry. 1989;28:7139–7143. doi: 10.1021/bi00444a001. [DOI] [PubMed] [Google Scholar]
- 13.Brown B M, Bowie J U, Sauer R T. Biochemistry. 1990;29:11189–11195. doi: 10.1021/bi00503a006. [DOI] [PubMed] [Google Scholar]
- 14.Brown B M, Sauer R T. Biochemistry. 1993;32:1354–1363. doi: 10.1021/bi00056a022. [DOI] [PubMed] [Google Scholar]
- 15.Jordan S R, Pabo C O, Vershon A K, Sauer R T. J Mol Biol. 1985;185:445–446. doi: 10.1016/0022-2836(85)90415-2. [DOI] [PubMed] [Google Scholar]
- 16.Brünger A T. x-plor, Version 3.1. New Haven, CT: Yale Univ. Press; 1992. [Google Scholar]
- 17.Thomas K A, Smith G M, Thomas T B, Feldmann R J. Proc Natl Acad Sci USA. 1982;79:4843–4847. doi: 10.1073/pnas.79.16.4843. [DOI] [PMC free article] [PubMed] [Google Scholar]
- 18.Burley S K, Petsko G A. Adv Protein Chem. 1988;39:125–189. doi: 10.1016/s0065-3233(08)60376-9. [DOI] [PubMed] [Google Scholar]
- 19.Luisi B F, Xu W X, Otwinowski Z, Freedman L P, Yamamoto K R, Sigler P B. Nature (London) 1991;352:497–505. doi: 10.1038/352497a0. [DOI] [PubMed] [Google Scholar]
- 20.Gewirth D T, Sigler P B. Nat Struct Biol. 1995;2:386–394. doi: 10.1038/nsb0595-386. [DOI] [PubMed] [Google Scholar]
- 21.Otwinowski Z, Schevitz R W, Zhang R G, Lawson C L, Joachimiak A, Marmorstein R Q, Luisi B F, Sigler P B. Nature (London) 1988;335:837. doi: 10.1038/335321a0. [DOI] [PubMed] [Google Scholar]
- 22.Sigler P B. 40 Years of the DNA Double Helix: Proceedings of the Robert A. Welch Foundation 37th Conference on Chemical Research. Houston, TX: The Welch Foundation; 1993. p. 63. [Google Scholar]
- 23.Rice P, Yang S, Mizuuchi K, Nash H A. Cell. 1996;87:1295–1306. doi: 10.1016/s0092-8674(00)81824-3. [DOI] [PubMed] [Google Scholar]
- 24.Nelson H M C, Sauer R T. Cell. 1985;42:549–558. doi: 10.1016/0092-8674(85)90112-6. [DOI] [PubMed] [Google Scholar]
- 25.Nelson H M C, Sauer R T. J Mol Biol. 1986;192:27–38. doi: 10.1016/0022-2836(86)90461-4. [DOI] [PubMed] [Google Scholar]
- 26.Kraulis P J. J Appl Crystallogr. 1991;24:964–950. [Google Scholar]