Abstract
The crystal structure of phosphoenolpyruvate carboxylase (PEPC; EC 4.1.1.31) has been determined by x-ray diffraction methods at 2.8-Å resolution by using Escherichia coli PEPC complexed with l-aspartate, an allosteric inhibitor of all known PEPCs. The four subunits are arranged in a “dimer-of-dimers” form with respect to subunit contact, resulting in an overall square arrangement. The contents of α-helices and β-strands are 65% and 5%, respectively. All of the eight β-strands, which are widely dispersed in the primary structure, participate in the formation of a single β-barrel. Replacement of a conserved Arg residue (Arg-438) in this linkage with Cys increased the tendency of the enzyme to dissociate into dimers. The location of the catalytic site is likely to be near the C-terminal side of the β-barrel. The binding site for l-aspartate is located about 20 Å away from the catalytic site, and four residues (Lys-773, Arg-832, Arg-587, and Asn-881) are involved in effector binding. The participation of Arg-587 is unexpected, because it is known to be catalytically essential. Because this residue is in a highly conserved glycine-rich loop, which is characteristic of PEPC, l-aspartate seemingly causes inhibition by removing this glycine-rich loop from the catalytic site. There is another mobile loop from Lys-702 to Gly-708 that is missing in the crystal structure. The importance of this loop in catalytic activity was also shown. Thus, the crystal-structure determination of PEPC revealed two mobile loops bearing the enzymatic functions and accompanying allosteric inhibition by l-aspartate.
Phosphoenolpyruvate carboxylase (PEPC; EC 4.1.1.31) catalyzes the irreversible carboxylation of phosphoenolpyruvate (PEP) to form oxaloacetate (OAA) and inorganic phosphate using Mg2+ as a cofactor.
The enzyme is widespread in all plants and many kinds of bacteria and performs anaplerotic functions by replenishing C4-dicarboxylic acids for the synthesis of various cellular constituents and for the maintenance of the citric acid cycle (1- 3). Higher plants have several isoforms of PEPC with different kinetic and regulatory properties that correlate with their respective roles in cellular metabolism (4). Considerable attention has been paid to this enzyme, because in C4 plants such as maize and sugarcane and in crassulacean acid metabolism (CAM) plants such as pineapple and cactus, one of the PEPC isoforms is expressed abundantly and plays a key role in C4 and CAM photosynthesis (5). Molecular structural studies on PEPC are thus expected to provide clues for the development of innovative strategies for the augmentation of productivity of photosynthetic organisms and for the conversion of CO2 into useful organic compounds.
PEPCs from various sources are usually composed of four identical subunits whose molecular masses are 95–110 kDa. The primary structure was first deduced from a cloned DNA of Escherichia coli in 1984 (6). Since then, more than 20 molecular species of PEPC have been established from their primary structures, including the enzymes from maize (7, 8), cyanobacteria (9), and an extreme thermophile (10). The alignment of all amino acid sequences available in 1994 and the construction of a phylogenetic tree by the neighbor-joining method showed that these various PEPCs had evolved from the same ancestral origin and that the amino acid identities and similarities among them were more than 31% and 52%, respectively (10, 11). E. coli PEPC is very similar to the plant enzyme in primary structure except for the extra residues at the N terminus in the latter, which comprise a regulatory phosphorylation domain (3). Thus, the three-dimensional structure of E. coli PEPC can be applied directly to plant PEPC.
X-ray crystallographic analysis (together with functional analysis by site-directed mutagenesis; ref. 12) of PEPC is indispensable for studies on the reaction mechanism and regulation by opposing allosteric effectors or covalent modification. However, this analysis has been hampered mainly because of the unavailability of a large amount of high-purity enzyme. This obstacle was overcome for E. coli PEPC when a simple method of preparation was established (13, 14) after the first preliminary crystallization report appeared in 1989 (15). After this report, however, several obstacles were encountered in determining the three-dimensional structure of PEPC. These included a polymorphism in the crystallization process and the instability of the crystals obtained. Finally, these obstacles were overcome by modifying the precipitant and additives used in the crystallization solution, together with the use of synchrotron radiation. Here, we report the three-dimensional structure of E. coli PEPC complexed with the allosteric inhibitor l-aspartate, determined by x-ray diffraction at 2.8-Å resolution.
METHODS
Crystallization and Diffraction Data.
PEPC from E. coli was crystallized as described (15), with minor but essential modifications. The mother solution in the 6-μl droplet contained 10 mg/ml protein in 50 mM Tris⋅HCl (pH 7.4) with 6 mM sodium l-aspartate, 45 mM CaCl2, 0.6 mM DTT, and 10% (wt/vol) polyethylene glycol 300. The droplet was equilibrated against a 500-μl reservoir solution containing 2.5 mM l-aspartate, 90 mM CaCl2, 0.25 mM DTT, and 15% (wt/vol) polyethylene glycol 300 in the same buffer. Crystals belong to the orthorhombic space group of I222, with unit cell parameters of a = 117.6, b = 248.4, and c = 82.7 Å. The asymmetric unit contains one PEPC monomer. Thus, the homotetrameric PEPC molecule has D2 crystallographic symmetry.
The statistics of diffraction intensities and initial phases determined by the multiple isomorphous replacement method are summarized in Table 1. X-ray diffraction intensities were measured at station BL6B of the Photon Factory (Tsukuba, Japan) with the Sakabe Weissenberg camera for macromolecular crystallography and with imaging plates as a detector (16). The data were processed with denzo and scaled with the program scalepack (17). The crystal structure was determined by multiple isomorphous replacement, and three useful heavy-atom derivatives were obtained by soaking crystals in the presence of 1 mM methylmercuric chloride, mersalyl acid, or the sodium salt of ethylmercurithiosalicylic acid. Heavy-atom parameters, including positions, occupancies, and temperature factors, were refined with the program mlphare (ref. 18; figure of merit of 0.47 at 2.8 Å). Solvent flattening and histogram matching were performed with the program dm (19).
Table 1.
Crystallographic data statistics
| Derivative | Diffraction data
|
Heavy-atom phasing statistics
|
|||
|---|---|---|---|---|---|
| Resolution, Å | Completeness, % | Rmerge,* % | Rcullis (accent/cent)† | Phasing power (accent/cent)‡ | |
| Native | 2.8 | 93.3 | 6.9 | — | — |
| CH3HgCl | 2.8 | 67.2 | 11.3 | 0.79/0.68 | 1.45/1.05 |
| Mersalyl acid | 3.5 | 60.2 | 7.7 | 0.89/0.79 | 0.90/0.73 |
| EMTS | 3.5 | 90.1 | 9.8 | 0.86/0.80 | 0.91/0.78 |
| Refinement statistics | |||||
| Resolution, 10.0–2.8 Å | |||||
| Observations, working/test, 26,242/1,409 | |||||
| Nonhydrogen protein atoms, 6,898 | |||||
| Solvent molecules, 39 | |||||
| Rcryst/Rfree§, 21.9%/25.9% | |||||
| rms deviation in bond length, 0.011 Å | |||||
| rms deviation in bond angle, 1.4° | |||||
EMTS, ethylmercurithiosalicylic acid.
Rmerge = Σ|I − 〈I〉|/ΣI, where I is the observed intensity. 〈I〉 is the average intensity of multiple observations of symmetry-related reflections.
Rcullis = Σ|FPH − FP| − FH (calc)|/Σ|FPH − FP|
Phasing power = Σ|FH (calc)|/Σ∥FPH − FP| − |FP (calc)|
Rcryst/Rfree = Σ(|FO| − |FC|)/Σ|FO|, where the crystallographic and free R-factor are calculated by using the working and free reflection sets, respectively.
Model Building and Refinement.
Interpretation of the electron-density map and building of the atomic model were performed with the graphics program o (20). The initial structure model, including partially resolved secondary structures, was refined with refmac (21), and manual modifications of the model structure were carried out repeatedly up to an R-factor of 21.9% for the significant 26,242 reflections with resolutions between 10.0 Å and 2.8 Å. With a 5% reflection test set (1,409 reflections), the Rfree (22) value is 25.9%. The rms deviation from standard values of bond lengths and angles are 0.011 Å and 1.4°, respectively. The final model contains 6,898 nonhydrogen protein atoms and 39 solvent molecules.
Native PAGE.
Both wild-type (WT) and mutant (R438C) enzymes were subjected to nondenaturing PAGE at either pH 9.5 or pH 7.4. The R438C enzyme was prepared by a method similar to that described (12). The electrophoresis buffers at pH 9.5 and pH 7.4 were prepared according to the buffer systems of Laemmli (23) and Weber and Osborn (24), respectively, but without SDS. The molecular mass of the partially dissociated species was estimated to be ≈200 kDa by gel-filtration chromatography on Superose 12 (Amersham Pharmacia).
RESULTS AND DISCUSSION
Tetramer Structure.
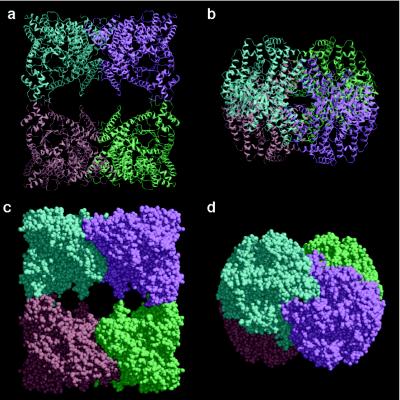
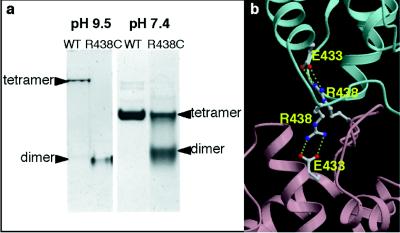
The overall structure of E. coli PEPC is shown in Fig. 1. The four identical subunits are related by the crystallographic 222 symmetry, resulting in a molecular symmetry of D2 for the enzyme. The space-filling model of the homotetramer (Fig. 1 c and d) clearly shows that two of the four monomers, colored blue and lavender or orange and green, form rather close intersubunit contacts, in contrast with the alternative pairs of monomers. The contact surface areas between blue and lavender subunits and blue and orange subunits were calculated to be 1,610 Å2 and 520 Å2, respectively, by using the program grasp (25), based on a probe radius of 1.4 Å. In the center of the tetramer of PEPC, there are vacant holes. Therefore, the tetramer structure of PEPC is best described as a “dimer of dimers”. In previous studies that used site-directed mutagenesis, the conserved Arg-438 residue was found to be essential for maintaining the tetrameric structure of the enzyme. The replacement of Arg-438 with Cys results in the partial dissociation of the tetramer into a dimer as shown by nondenaturing PAGE (Fig. 2a). After completion of the x-ray structure determination, Arg-438 was found at the boundary of the two neighboring subunits with rather loose contact, between the blue and orange monomer and the lavender and green monomer (Fig. 2b). The intersubunit interactions through Arg-438 are the salt bridges between this basic residue and Glu-433 of the neighboring subunit. By replacing Arg-438 with Cys, these salt bridges are disrupted, thus resulting in the dissociation of the tetrameric enzyme into two dimers. The revealed tetrameric structure of PEPC readily explains the inherent tendency of the enzyme to dissociate into rather stable dimers (26).
Figure 1.
Overall views of PEPC from E. coli. (a) Ribbon diagram of the homotetrameric PEPC, in which the four identical subunits colored in blue, lavender, green, and orange are related by the crystallographic twofold axes running vertically and horizontally on the page and perpendicularly to the page. (b) Ribbon diagram of tetrameric PEPC as in a but rotated 90° around a horizontal twofold axis. (c and d) Corey–Pauling–Koltun models of PEPC shown in the same orientations as a and b, respectively. The figures were produced with molscript (36) and raster3d (37).
Figure 2.
Intersubunit contacts in tetrameric PEPC. (a) Both WT and mutant (R438C) enzymes were subjected to native PAGE at pH 9.5 or pH 7.4. (b) Arg-438, which is essential for maintaining tetrameric structure, is salt-bridged to Glu-433 in the neighboring subunit. (Same color scheme as in Fig. 1a.)
Monomer Structure.
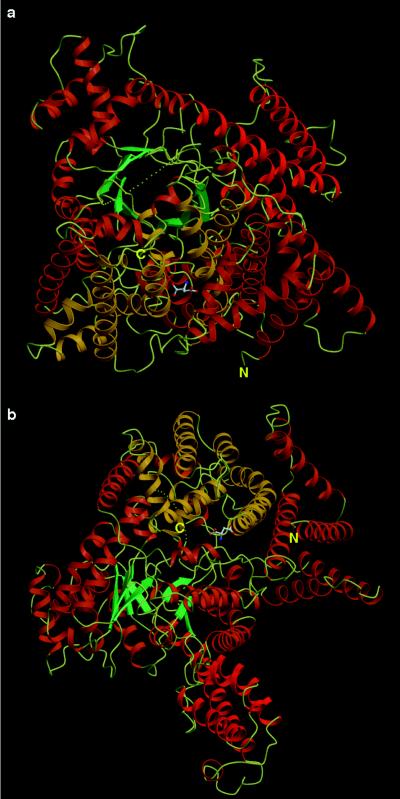
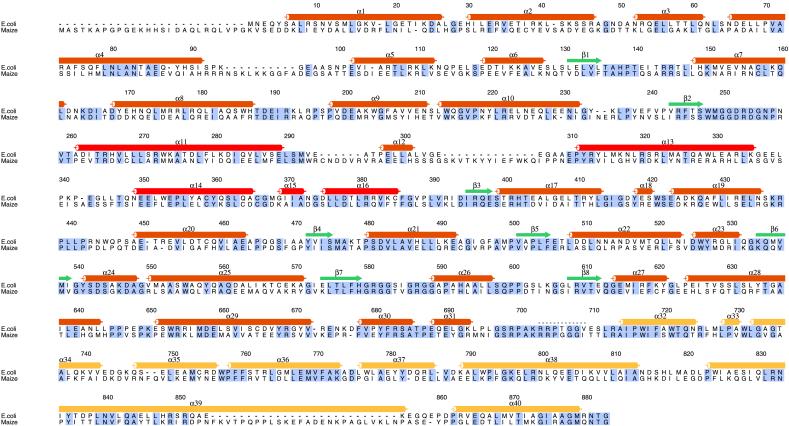
The intrasubunit structure of PEPC from E. coli is shown in Fig. 3 in a pair of molecular projections. The characteristic features of the structure are an eight-stranded β-barrel and an abundant number of α-helices. In Fig. 4, the relationships between the secondary structural elements and the primary structures of the E. coli and maize (C4) enzymes are shown. No β-strands are found, except for the eight forming the barrel. In contrast to the limited number of β-strands, there are a total of 40 α-helices. The α-helices include a total of 576 residues, which is 65% of the polypeptide, whereas the β-strands include 40 residues, which is 5% of the polypeptide. Many of the α-helices are located together on the C-terminal side of the β-barrel, whereas few of them are located on the N terminal (Fig. 3b). Aspartate, a negative effector molecule (2), was found among the α-helices on the C-terminal side of the barrel, as shown in Fig. 3.
Figure 3.
(a) Ribbon drawings of a PEPC monomer projected in the same direction as the orange subunit shown in Fig. 1a. (b) Ribbon diagram of a PEPC monomer as in a but rotated 90° around a horizontal axis. The α helices (α1–α32) and (α33–α40) are shown in orange and yellow, respectively. The four-helix bundle (α11, α13, α14, and α15 + α16) is shown in red. The eight β-strands are in blue green, and the connecting loops are in pale yellow. The pale yellow dotted line corresponds to the loop that could not be defined in the electron-density map. The negative allosteric effector, l-aspartate, is shown in a ball-and-stick model.
Figure 4.
Amino acid sequence alignment of E. coli and maize (C4) PEPC. The secondary structural features and residue numbers for E. coli PEPC, based on the structure reported herein, are indicated above its sequence. Residues that are identical in the two sequences are boxed in gray. Secondary structural elements of PEPC are indicated by cylinders (α-helices) or arrows (β-strands), and the missing loop from Lys-702 to Gly-708 is shown as dots. The α-helices are labeled α1–α40, and β-strands are numbered β1–β8. Color coding corresponds to that in Fig. 3. Secondary structural elements were determined with the dssp algorithm within the rasmol program (38). The figure was prepared with the program alscript (39). The specific site of phosphorylation of the maize enzyme is Ser-15 (3, 28).
The four-α-helix bundle shown in red in Fig. 3 is also a characteristic of the molecular structure of PEPC. The bundle is composed of helices α11 (Ala-261–Leu-290), α13 (Pro-311–Lys-335), α14 (Asn-349–Cys-366), and α15 + α16 (Asn-369–Cys-385). The helices are rather long and consist of 16–29 amino acid residues. The bundle forms on the boundary region with the closely associated monomer; therefore, its role may be in the stabilization of the tetrameric structure of PEPC.
The Aspartate Binding Site.
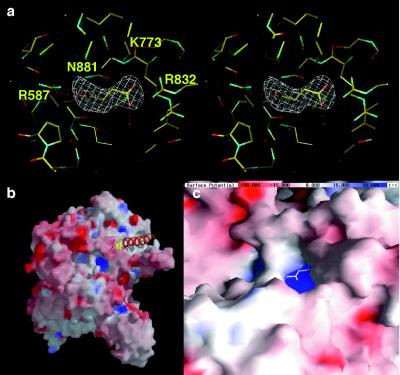
l-Aspartate is one of the allosteric effector molecules for PEPC that causes an inhibition of catalytic activity (2). The binding domain for this negative effector is shown in Fig. 5a; four amino acid residues, Lys-773, Arg-832, Arg-587, and Asn-881, participate in the binding of aspartate. Lys-773 is one of the two lysine residues strictly conserved in all PEPC sequences reported to date. When Lys-773 was replaced with alanine, enzymatic activity was lost completely and the accumulation of the mutant protein was decreased severely (12). Lys-773 is salt-bridged to the carboxyl group in the side chain of aspartate by full extension of its side chain. Arg-832, which is also conserved highly in all PEPCs (11), is also salt-bridged to the same carboxyl group. Arg-587 is the second arginine in the unique sequence of GRGGXXGRGG (XX = TV, SI, or SV), which is conserved in all PEPCs (11). This loop with six glycine residues provides a long flexible arm for the two functional arginine residues in this sequence. Arg-587 is salt-bridged to the carboxyl group of aspartate. The replacement of Arg-587 by Ser causes a virtual loss in overall catalytic activity to form oxaloacetate (27). The salt bridge between Arg-587 and aspartate strongly suggests that this essential arginine is trapped by the inhibitory effector molecule. Therefore, the active site of the enzyme may be defined within the region swept by the long flexible arm of Arg-587 supported on the flexible loop with this unique amino acid sequence in PEPC. The fourth residue supporting aspartate binding is Asn-881, which is conserved completely in all PEPCs (11). The participation of a near-terminal residue of the enzyme in the recognition and/or binding of an inhibitor is very interesting and will be discussed later.
Figure 5.
Aspartate binding site in E. coli PEPC. (a) Stereoview of the aspartate binding site. The map was calculated with (Fo − Fc, αcalc) in the resolution range of 10–2.8 Å, omitting aspartate coordinates, and contoured at the 4σ level. (b) View of electrostatic surface potential of PEPC calculated by grasp (25), omitting the aspartate and N-terminal helix (α1) coordinates. The N-terminal helix near the aspartate binding pocket is shown in orange. (c) Close-up view of the aspartate binding pocket. The effector l-aspartate binds in the inner part of the pocket.
Fig. 5b shows a grasp representation (25) of the PEPC monomer in which the molecular surface is colored according to electrostatic potential (blue for positive, red for negative). Near the N terminus is a channel with weak acidic residues around its entrance and strong basic residues at its bottom (Fig. 5 b and c). Through the channel, aspartate is seen at the bottom (Fig. 5c). This characteristic feature may explain the reduced sensitivity of higher plant PEPC to l-aspartate or l-malate when the plant-invariant serine residue near the N terminus extension, which is characteristic of plant PEPCs, is phosphorylated (3, 28) or replaced by an aspartic acid residue (3, 29), because the target serine is likely close to the entrance of the channel.
The Probable Active Site.
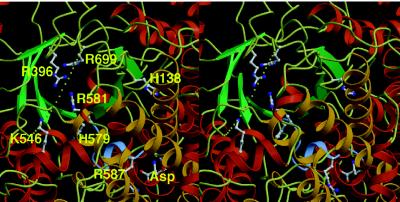
The chemical modifications of histidine, arginine, and lysine suggest that they are the essential residues involved in catalysis by PEPC (3). In PEPC, there are only two conserved histidines, His-138 and His-579. Site-directed mutagenesis of these histidines has identified their essential role in catalytic activity (30, 31). The locations of these two conserved histidines are shown in Fig. 6, together with other residues important for catalytic activity and the inhibitory effector aspartate. The residues and aspartate are close together on the C-terminal side of the β-barrel. The interatomic distances between the α-carbon atoms of the two histidines and the aspartate are in the range from 17 Å to 18 Å. Next to His-579, the unique amino acid sequence of GRGGSIGRGG is shown in blue in the figure. This sequence contains the two arginine residues that are important for enzyme catalysis. Arg-587 is stretched toward the aspartate and away from the two histidines in this inactive form of PEPC. This glycine-rich loop may be sufficiently mobile, even though the aspartate holds the loop away from the catalytic site and restricts its mobility.
Figure 6.
Stereoview of the probable active site of PEPC. H138, R396, K546, H579, R581, R587, R699, and aspartate are shown in ball-and-stick representation. The figure is drawn in the same orientation as Fig. 3a. The loop region of GRGGSIGRGG is shown in blue. The missing loop from Lys-702 to Gly-708 is shown as dots.
The few amino acid residues that are not traced in the crystal structure consist of three at the N terminus and seven in the loop from Lys-702 to Gly-708 shown as dots in Fig. 6. Therefore, this missing loop is very likely the active site of the enzyme. In the sequence of the loop, Arg-703 is conserved completely in all PEPCs, and Lys-702 and Arg-704 are well conserved in the form of either Lys or Arg. These functional residues are sandwiched by Ala-701 or Ser-701 and Gly-707 Gly-708, which make this loop flexible. In the aspartate complex of PEPC, this missing loop may have no ligands to fix its structure. The importance of this mobile loop in catalytic activity was indicated by several observations. First, when PEPC was treated with trypsin, the enzyme was inactivated readily, concomitant with a single cleavage at the carboxyl side of Arg-703 (T.Y., T. Kaz, and K.I., unpublished results). Second, when Arg-703 or both Arg-703 and Arg-704 were replaced by Gly, the kcat values decreased by ≈5- and 20-fold, respectively. As shown in Table 2, only the Km value for bicarbonate was increased markedly by the mutations among the three reaction components, suggesting the involvement of these basic residues in the binding of bicarbonate. Furthermore, in these mutant enzymes, the activity of an unfavorable side reaction, i.e., bicarbonate-dependent phosphoenolpyruvate hydrolysis (see refs. 3 and 30), appeared with kcat values of about 1.4 × 10² min−1 (T. Ken, H.M., Y.K., and K.I., unpublished results). Thus, it can be assumed that this loop and another loop containing Arg-581 and Arg-587 catch substrate molecules at the active site with their functional residues and form lids to protect the reaction intermediates from attack by surrounding water. Fig. 6 is the molecular projection along the axis of the β-barrel viewed from its C-terminal side. Located between the missing loop and the very end of the β-barrel are the conserved residues Arg-396, which is essential for PEPC function (32), and Lys-546, which is associated with bicarbonate binding (33), along with the conserved arginine residues Arg-581 and Arg-699. Thus, the active site of PEPC is likely at the region around the C-terminal side of the β-barrel.
Table 2.
Kinetic parameters of WT and mutant (Mut-1, Mut-2) PEPCs
| Enzyme |
Km, mM
|
kcat, min−1 | kcat/Km (HCO3−) | |||
|---|---|---|---|---|---|---|
| PEP | Mg2+ | HCO3− | ||||
| WT | 702KRRPTGG708 | 0.19 | 1.5 | 0.10 | 9.0 × 10³ | 9.0 × 10⁴ |
| Mut-1 | KGRPTGG | 0.29 | 0.88 | 0.55 | 1.8 × 10³ | 3.3 × 10³ |
| Mut-2 | KGGPTGG | 0.19 | 1.9 | 6.5 | 4.9 × 10² | 7.5 × 101 |
Methods for site-directed mutagenesis, enzyme purification, and kinetic measurement were the same as described (12).
The C Terminus Structure.
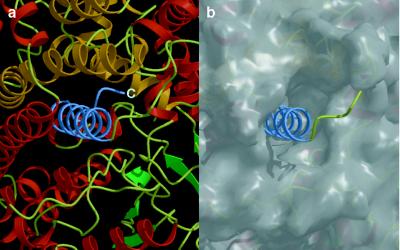
As described above, Asn-881 is hydrogen-bonded to the inhibitor aspartate. Fig. 7 shows the local structure around the C terminus, where a long helix (α40) is formed with 19 residues from Pro-861 to Met-879, followed by the nonhelical RNTG sequence at the very end. α-Helix 40 is embedded in a hydrophobic region of the subunit made by several α-helices on the C-terminal side of the β-barrel. Of the 19 residues, 14 are hydrophobic in E. coli PEPC, 13 in maize (Zea mays) C4 PEPC, and 14 in sorghum (Sorghum vulgare) C4 PEPCs. Thus, the C terminus of PEPC is highly hydrophobic.
Figure 7.
(a) The C-terminal helix (α40), shown in blue, is embedded in the PEPC monomer. The figure was produced with molscript (37) and raster3d (38). (b) The molecular surface, omitting the C-terminal helix coordinates, was calculated with grasp (25). The figure is shown in the same orientation as a.
Patil and Chollet (34) have reported preliminary data indicating that the highly conserved stretch of amino acids from residue 870 to the C terminus is essential for the recombinant C4 enzyme’s stability in vivo and that this C-terminal domain possibly plays a critical role in the formation of the fully active, homotetrameric enzyme.
Conclusions and Perspectives.
The three-dimensional structure of PEPC has been determined by x-ray diffraction methods at 2.8-Å resolution for the enzyme obtained from E. coli in the form of an inhibited l-aspartate complex. The overall tetrameric structure of PEPC can be described as a “dimer of dimers,” with the total molecular symmetry of D2. The PEPC monomer has an α-/β-barrel motif with eight β-strands surrounded by many helices. The active site is assigned to the C-terminal side of the β-barrel, because most of the catalytically essential residues identified by site-directed mutagenesis and chemical modification are located in this region. Furthermore, in all PEPCs, most of the strictly conserved region directly flanks the C terminus of the respective β-strands (compare Fig. 4 with figure 4 in ref. 10). A missing loop crossing over this side of the barrel was also implicated in the catalytic function of the enzyme. l-Aspartate, an inhibitory effector molecule, is bound close to the probable active site and salt-bridged to the catalytically essential Arg-587, which is in a conserved, glycine-rich GRGGXXGR587GG that is unique to PEPC. A logical implication of this finding is that allosteric inhibition by l-aspartate is exerted at least in part by immobilizing the flexible loop away from the catalytic site. The C terminus of PEPC forms a highly hydrophobic α-helix that is embedded in a hydrophobic pocket of the enzyme. The very end of the C-terminal chain is fixed by hydrogen bonding to the complexed l-aspartate.
Identifying the detailed molecular mechanism for the enzymatic function of PEPC depends on the determination of the three-dimensional structure of an active form of the enzyme, which may be achieved by complexing PEPC with a substrate analogue, Mg2+, and the allosteric activators (35).
Scheme 1.
Acknowledgments
We thank Prof. Noriyoshi Sakabe of Tsukuba University; Dr. Nobuhisa Watanabe and Dr. Mamoru Suzuki of the Photon Factory for the use of their facilities and helpful comments; Mr. Masato Yano and Dr. Tsutomu Nakamura for their kind help in the preparation of PEPC when they were in the laboratory of K.I.; and Dr. Nobutami Kasai, professor emeritus of Osaka University, and Dr. Hirohiko Katsuki, professor emeritus of Kyoto University, for their continuous encouragement of this project.
ABBREVIATIONS
- PEPC
phosphoenolpyruvate carboxylase
- WT
wild type
Footnotes
Data deposition: The atomic coordinates and structure factors of the aspartate complex of E. coli PEPC have been deposited in the Protein Data Bank, Biology Department, Brookhaven National Laboratory, Upton, NY 11973 (PDB ID code 1FIY).
References
- 1.Utter M F, Kolenbrander H M. In: The Enzymes. 3rd Ed. Boyer P D, editor. Vol. 6. New York: Academic; 1972. pp. 117–168. [Google Scholar]
- 2.O’Leary M H. Annu Rev Plant Physiol. 1982;33:297–315. [Google Scholar]
- 3.Chollet R, Vidal J, O’Leary M H. Annu Rev Plant Physiol Plant Mol Biol. 1996;47:273–298. doi: 10.1146/annurev.arplant.47.1.273. [DOI] [PubMed] [Google Scholar]
- 4.Latzko E, Kelly G J. Physiol Veg. 1983;21:805–815. [Google Scholar]
- 5.Hatch M D. Plant Cell Physiol. 1992;33:333–342. [Google Scholar]
- 6.Fujita N, Miwa T, Ishijima S, Izui K, Katsuki H. J Biochem (Tokyo) 1984;95:909–916. doi: 10.1093/oxfordjournals.jbchem.a134718. [DOI] [PubMed] [Google Scholar]
- 7.Izui K, Ishijima S, Yamaguchi Y, Katagiri F, Murata T, Shigesada K, Sugiyama T, Katsuki H. Nucleic Acids Res. 1986;14:1615–1628. doi: 10.1093/nar/14.4.1615. [DOI] [PMC free article] [PubMed] [Google Scholar]
- 8.Yanagisawa S, Izui K, Yamaguchi Y, Shigesada K, Katsuki H. FEBS Lett. 1988;229:107–110. doi: 10.1016/0014-5793(88)80807-x. [DOI] [PubMed] [Google Scholar]
- 9.Katagiri F, Kodaki T, Fujita N, Izui K, Katsuki H. Gene. 1985;38:265–269. doi: 10.1016/0378-1119(85)90227-6. [DOI] [PubMed] [Google Scholar]
- 10.Nakamura T, Yoshioka I, Takahashi M, Toh H, Izui K. J Biochem (Tokyo) 1995;118:319–324. doi: 10.1093/oxfordjournals.jbchem.a124909. [DOI] [PubMed] [Google Scholar]
- 11.Toh H, Kawamura T, Izui K. Plant Cell Environ. 1994;17:31–43. [Google Scholar]
- 12.Yano M, Izui K. Eur J Biochem. 1997;247:74–81. doi: 10.1111/j.1432-1033.1997.t01-1-00074.x. [DOI] [PubMed] [Google Scholar]
- 13.Izui K, Fujita N, Katsuki H. J Biochem (Tokyo) 1982;92:423–432. doi: 10.1093/oxfordjournals.jbchem.a133949. [DOI] [PubMed] [Google Scholar]
- 14.Terada K, Fujita N, Katsuki H, Izui K. Biosci Biotechnol Biochem. 1995;59:735–737. doi: 10.1271/bbb.59.735. [DOI] [PubMed] [Google Scholar]
- 15.Inoue M, Hayashi M, Sugimoto M, Harada S, Kai Y, Kasai N, Terada K, Izui K. J Mol Biol. 1989;208:509–510. doi: 10.1016/0022-2836(89)90515-9. [DOI] [PubMed] [Google Scholar]
- 16.Sakabe N. Rev Sci Instrum. 1991;66:1276–1281. [Google Scholar]
- 17.Otwinowski Z, Minor W. In: Proceedings of the CCP4 Study Weekend, Data Collection and Processing. Sawyer L, Isaacs N, Bailey S, editors. Warrington, U.K.: Science and Engineering Research Council (England) Daresbury Lab.; 1993. pp. 56–62. [Google Scholar]
- 18.Otwinowski Z, Minor W. In: Proceedings of the CCP4 Study Weekend, Isomorphous Replacement and Anomalous Scattering. Sawyer L, Isaacs N, Bailey S, editors. Warrington, U.K.: Science and Engineering Research Council (England) Daresbury Lab.; 1993. pp. 80–86. [Google Scholar]
- 19.Cawtan K. Joint CCP4 and ESF-EACBM Newsletter on Protein Crystallography. 1994;31:24–28. [Google Scholar]
- 20.Jones T A, Zou J Y, Cowan S W, Kjeldgaard M. Acta Crystallogr A. 1991;47:110–119. doi: 10.1107/s0108767390010224. [DOI] [PubMed] [Google Scholar]
- 21.Murshudov G N, Vagin A A, Dodson E J. Acta Crystallogr D. 1997;53:240–255. doi: 10.1107/S0907444996012255. [DOI] [PubMed] [Google Scholar]
- 22.Brünger A T. Nature (London) 1992;355:472–475. doi: 10.1038/355472a0. [DOI] [PubMed] [Google Scholar]
- 23.Laemmli U K. Nature (London) 1970;227:680–685. doi: 10.1038/227680a0. [DOI] [PubMed] [Google Scholar]
- 24.Weber K, Osborn M. J Biol Chem. 1969;244:4406–4412. [PubMed] [Google Scholar]
- 25.Nicholls A, Sharp K A, Honig B. Proteins. 1991;11:281–296. doi: 10.1002/prot.340110407. [DOI] [PubMed] [Google Scholar]
- 26.Yoshinaga T, Teraoka H, Izui K, Katsuki H. J Biochem (Tokyo) 1974;75:913–924. doi: 10.1093/oxfordjournals.jbchem.a130465. [DOI] [PubMed] [Google Scholar]
- 27.Yano M, Terada K, Umiji K, Izui K. J Biochem (Tokyo) 1995;117:1196–1200. doi: 10.1093/oxfordjournals.jbchem.a124844. [DOI] [PubMed] [Google Scholar]
- 28.Terada K, Kai T, Okuno S, Fujisawa H, Izui K. FEBS Lett. 1990;259:241–244. [Google Scholar]
- 29.Ueno Y, Hata S, Izui K. FEBS Lett. 1997;417:57–60. doi: 10.1016/s0014-5793(97)01254-4. [DOI] [PubMed] [Google Scholar]
- 30.Terada K, Izui K. Eur J Biochem. 1991;202:797–803. doi: 10.1111/j.1432-1033.1991.tb16435.x. [DOI] [PubMed] [Google Scholar]
- 31.Terada K, Murata T, Izui K. J Biochem (Tokyo) 1991;109:49–54. [PubMed] [Google Scholar]
- 32.Gao Y, Woo K C. FEBS Lett. 1996;392:285–288. doi: 10.1016/0014-5793(96)00832-0. [DOI] [PubMed] [Google Scholar]
- 33.Gao Y, Woo K C. FEBS Lett. 1995;375:95–98. doi: 10.1016/0014-5793(95)01189-l. [DOI] [PubMed] [Google Scholar]
- 34.Patil, S. & Chollet, R. (1997) Plant Biol. 76, Suppl., 33 (abstr.).
- 35.Izui K, Taguchi M, Morikawa M, Katsuki H. J Biochem (Tokyo) 1981;90:1321–1331. doi: 10.1093/oxfordjournals.jbchem.a133597. [DOI] [PubMed] [Google Scholar]
- 36.Kraulis P. J Appl Crystallogr. 1991;24:946–950. [Google Scholar]
- 37.Merrit E A, Murphy M E. Acta Crystallogr D. 1994;50:869–873. doi: 10.1107/S0907444994006396. [DOI] [PubMed] [Google Scholar]
- 38.Sayle R. rasmol, Molecular Graphics Visualization Tool. Greenford, Middlesex, U.K.: Glaxo Research & Development; 1994. , Version 2.5. [Google Scholar]
- 39.Barton G J. Protein Eng. 1993;6:37–40. doi: 10.1093/protein/6.1.37. [DOI] [PubMed] [Google Scholar]


