Abstract
This paper presents an exploratory trend analysis of the statistics published over the past twenty-four editions of the Annual Statistics of Medical School Libraries in the United States and Canada. The analysis focuses on the small subset of nineteen consistently collected data variables (out of 656 variables collected during the history of the survey) to provide a general picture of the growth and changing dimensions of services and resources provided by academic health sciences libraries over those two and one-half decades. The paper also analyzes survey response patterns for U.S. and Canadian medical school libraries, as well as osteopathic medical school libraries surveyed since 1987. The trends show steady, but not dramatic, increases in annual means for total volumes collected, expenditures for staff, collections and other operating costs, personnel numbers and salaries, interlibrary lending and borrowing, reference questions, and service hours. However, when controlled for inflation, most categories of expenditure have just managed to stay level. The exceptions have been expenditures for staff development and travel and for collections, which have both outpaced inflation. The fill rate for interlibrary lending requests has remained steady at about 75%, but the mean ratio of items lent to items borrowed has decreased by nearly 50%.
In a companion article, the authors provide an historical review of the origins and editorial policy decisions that shaped the Annual Statistics of Medical School Libraries in the United States and Canada, from the first survey conducted and published by the Houston Academy of Medicine-Texas Medical Center Library in 1978 to the twenty-fourth edition published in 2002 by the Association of Academic Health Sciences Libraries (AAHSL) [1]. This paper provides a first exploratory trend analysis of the actual statistics published over those twenty-four years. The analysis focuses on the small subset of consistently collected statistical data from the twenty-four published volumes to provide a general picture of the growth and changing dimensions of services and resources provided by academic health sciences libraries over the past two and one-half decades. The authors intend to follow this preliminary analysis with future articles using more sophisticated data analysis strategies and statistical tests. These future articles will describe more fully the relationships and correlations among various data variables over time and will further analyze the possible implications of these trends for future planning by U.S. and Canadian libraries serving the education, research, and patient care information needs of academic health care institutions.
BACKGROUND
Only one previous analysis of these statistical trends has been published outside of the introductory pages of the published editions of the Annual Statistics themselves. In 1992, Leatherbury and Lyders analyzed the statistics collected over the decade from 1980 to 1989 showing year-to-year trends for data about the clientele served by these libraries, the size of their collections, their expenditures, their staffing trends, and the use of their services and collections [2]. Using U.S. and Canadian consumer price index figures, they also adjusted the expenditure variables into constant dollars and used those newly calculated means for comparative expenditure trends.
This study presented a picture of the 1980s for academic health sciences libraries showing rising costs, both in absolute and constant dollars; stable serial collections and slowly declining monograph acquisitions; relatively unchanging staffing levels and patterns; increased in-house use of the collections as well as of interlibrary lending and borrowing (ILL); and clients asking more reference questions but making fewer requests for help to search MEDLINE and other databases. It is also interesting to note that, even with their host-institution's direct access to the machine-readable files for every year of the survey data, Leatherbury and Lyders were forced to show gaps because of missing data for several of the trends (clientele served, monographs added, and average cost per paid journal subscription) [3]. As will be clear from the data presented below, this problem of inconsistent and incomplete trend data has continued to the present.
Starting with the eighteenth edition reporting 1994/95 data, the published Annual Statistics have also included an introductory section showing a “composite library” with various mean and range statistics for the current year respondents [4]. In addition, over the past seven years, this section has also included bar charts and tables showing five-year trends for many data variables including: volumes in the collection, current serials, monograph titles, electronic titles, collection expenditures, ILL requests received, items lent and borrowed, gate count, circulation, and education and orientation programs.
One additional use of trend data from the Annual Statistics needs to be cited here. The recently published final report from the Integrated Advanced Information Management Systems (IAIMS): The Next Generation (TNG) study conducted by the Association of American Medical Colleges (AAMC) with contract funding from the National Library of Medicine includes a section on “IAIMS and the Health Sciences Library” with a table showing the pre-IAIMS characteristics of academic health sciences libraries in 1980/81 (the year before the publication of the first Matheson-Cooper report, which resulted in the IAIMS program) and 2000/01 (the year the IAIMS:TNG study was completed) [5]. This IAIMS report, written by Valerie Florance, a former editor of the Annual Statistics, noted the following changes over that twenty-year period: the electronic information resource expenditures in 2000 that did not exist in the early 1980s, the near doubling of reference questions, the tremendous growth in library educational programs, and the dramatic shift from relatively small numbers of library-mediated database searches (averaging around 2,000 per year in 1980/81) to the very large numbers of end-user searches now conducted each year (“about 120,000/year in library-managed databases” [6]).
DATA COLLECTION AND ANALYSIS
For the past nine years, the Annual Statistics have been published either with accompanying diskettes containing most of the data included in the print volumes, or, for the past three years, they have been searchable from a Website maintained for the association at the University of Virginia. However, no complete digital archive of the Annual Statistics has been established to facilitate a detailed trend analysis study. Thus, the authors have restricted the current analysis to data they personally transcribed into Microsoft Excel spreadsheets from each printed annual edition. Several standards and strategies were adopted in this process to deal with a number of inconsistencies in the way the data variables were reported and summarized over the twenty-four annual editions.
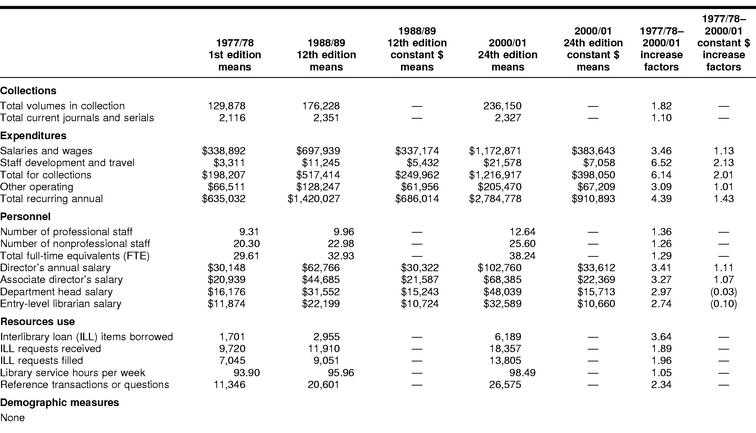
The most important inconsistency has been the way in which “missing,” “no response,” or “not applicable” responses have been included or not included in the means and other summary statistics calculated in the data tables presented in each edition of the Annual Statistics. The most common standard used by the editors has been to eliminate any “missing” values from the calculated summary statistics, including the totals calculated from several different variables. This practice has also been consistently adopted by the authors for this study, with the exception of three cases, where subtotals were used to replace the missing values. In Table 4 below, the mean figures shown for “Staff development and travel” as well as “Total recurring annual” expenditures for the twelfth edition of the Annual Statistics were recalculated in both cases to include the “budget” and “revenue” expenditures subtotals for one library that reported as missing only the “gift” expenditures portion of the total [7]. Similarly, in Figure 6 below the boxplot values for current serial titles from the tenth edition of the Annual Statistics were recalculated to include the “print” subtotals for fourteen libraries that reported as missing only the “microform” serials portion of the total [8].
Table 4 Annual Statistics with complete twenty-four-edition trends
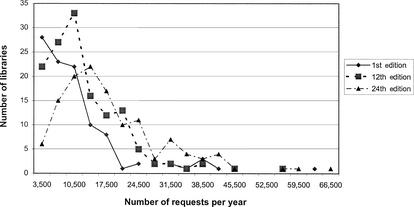
Figure 6.
Distribution of interlibrary loan requests for first, twelfth, and twenty-fourth editions, 1977/78, 1988/89, and 2000/01
The second inconsistency has been the way in which grant expenditures and grant-supported personnel have been included in the summary statistics in each edition of the Annual Statistics. The authors have adopted the standard of including grant expenditures and grant-funded personnel in the totals for all the categories of expenditure and personnel included in this analysis. For many variables over many years, that standard required recalculating the totals and means by also including the values from a separate column of grant expenditures or grant-funded personnel data, because in those years the grant data were not included in the total figures for the printed edition.
The third decision the authors reached after studying the published data in the data tables was to exclude all “zero” responses from these summary statistics. For almost all of the statistics reported in this paper, this standard was irrelevant, because all responding libraries reported collection, expenditure, personnel, and resource use figures that were greater than zero. However, the authors recalculated three of the mean values included in Table 4, treating “zero” responses the same as “missing.” For the “ILL requests received” statistic in the twelfth edition of the Annual Statistics, one library reported zero requests received, even though the same library reported 721 requests filled [9]. Because this was clearly illogical, the authors recalculated the mean shown in Table 4 to exclude this zero response (this raised the mean from 11,846 to 11,910). Similarly, for the average “Reference transactions or questions” statistics in the twelfth and twenty-fourth editions of the Annual Statistics, two libraries (12th edition) and one library (24th edition), respectively, reported zero reference questions answered. Because this also seemed highly unlikely in an academic medical center library, the authors also recalculated these means shown in Table 4 to exclude the zero responses (this raised the 12th edition mean from 20,306 to 20,601 and the 24th edition mean from 26,369 to 26,575) [10, 11]. The following section of this paper provides more details about the survey respondents and their response trends.
SURVEY RESPONDENTS AND RESPONSE TRENDS
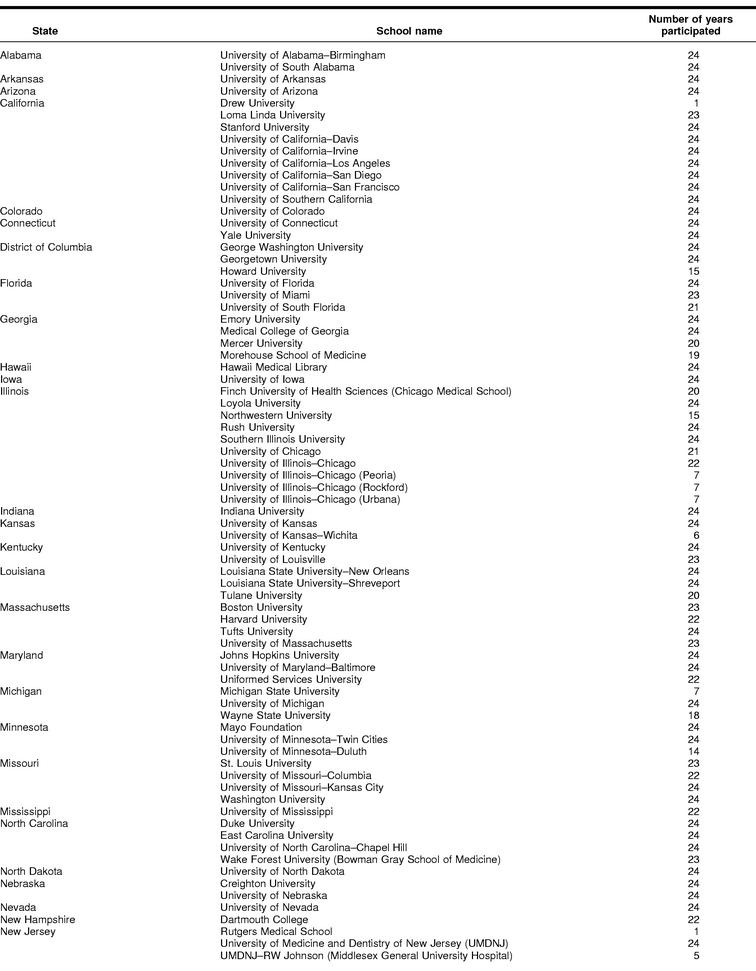
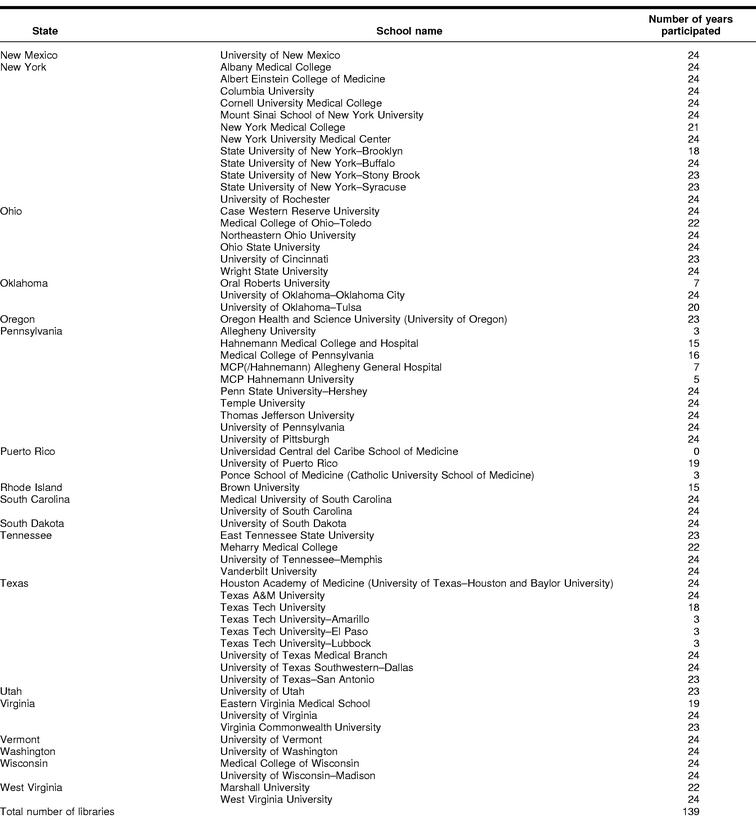
Over the twenty-four years of the survey, three groups of libraries have been eligible for inclusion: (1) those serving U.S. medical schools and holding “institutional” or “affiliate institutional” membership in the AAMC; (2) those serving Canadian medical schools (and holding “affiliate institutional” membership in the AAMC); and (3), since the tenth edition (1986/87 data), those serving U.S. osteopathic medical schools. Table 1 lists all U.S. medical schools by state with the number of years each library submitted responses to the survey. A few schools, such as the University of Illinois at Chicago, the University of Medicine and Dentistry of New Jersey, and Texas Tech University School of Medicine have had their branch libraries on separate campuses treated as completely separate libraries in some of the surveys. Overall, seventy-nine, or about 56% of the 139 U.S. medical school libraries, have responded to all twenty-four surveys, and about two-thirds have responded to at least twenty-three.
Table 1 US medical school libraries participating in the Annual Statistics surveys
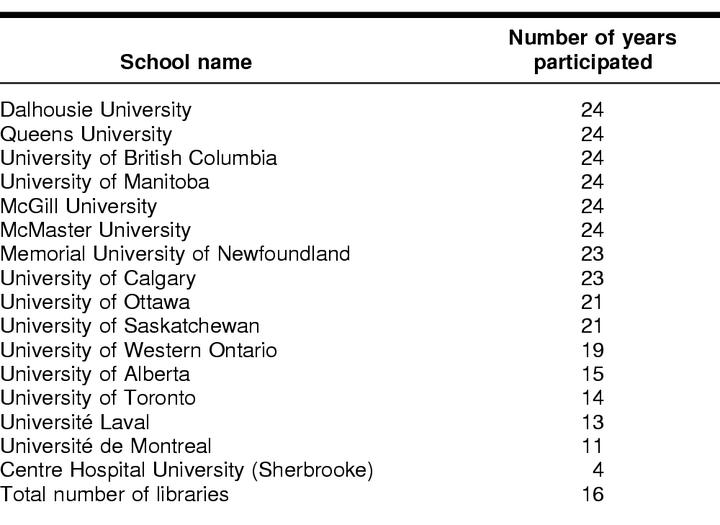
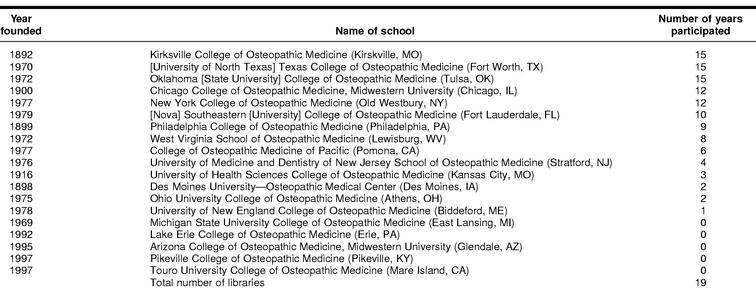
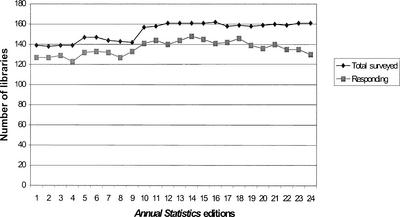
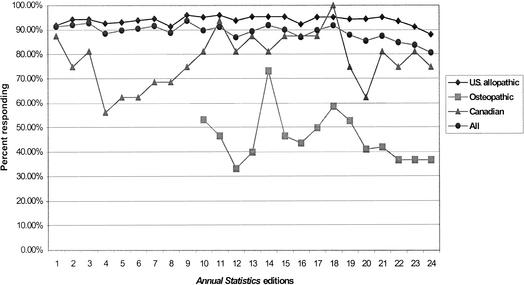
Table 2 lists all Canadian medical schools in rank order by the number of years each library responded to the survey. Six of these sixteen libraries have also participated in every survey, and another two only missed one. Table 3 provides the same rank order listing of U.S. osteopathic medical schools with their dates of founding and the number of years each library responded (up to 15 years, since the 10th edition). Only three of the fifteen libraries serving schools founded before 1987 (when the osteopathic school libraries were first surveyed) have responded to every survey, and none of the five libraries serving new osteopathic schools founded since 1978 have participated in the survey to date. Figure 1 summarizes the combined responses of all the surveyed libraries. Since the inclusion of the osteopathic school libraries, the number of surveys distributed has remained in the range of 160, about 20 more than the 139 libraries first surveyed in 1978. However, for about the last eight to ten years, the overall response rate has been very gradually, but steadily, declining. Figure 2 compares the response rates of each type of library with the total response rates.
Table 2 Canadian medical school libraries participating in the Annual Statistics surveys
Table 3 US osteopathic medical school libraries participating in the Annual Statistics surveys
Figure 1.
All libraries surveyed and responding, 1977/78 to 2000/01
Figure 2.
Survey response rate comparisons for U.S. medical and osteopathic, Canadian, and all libraries, 1977/78 to 2000/01
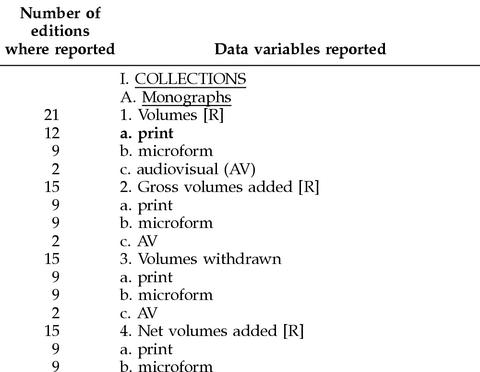
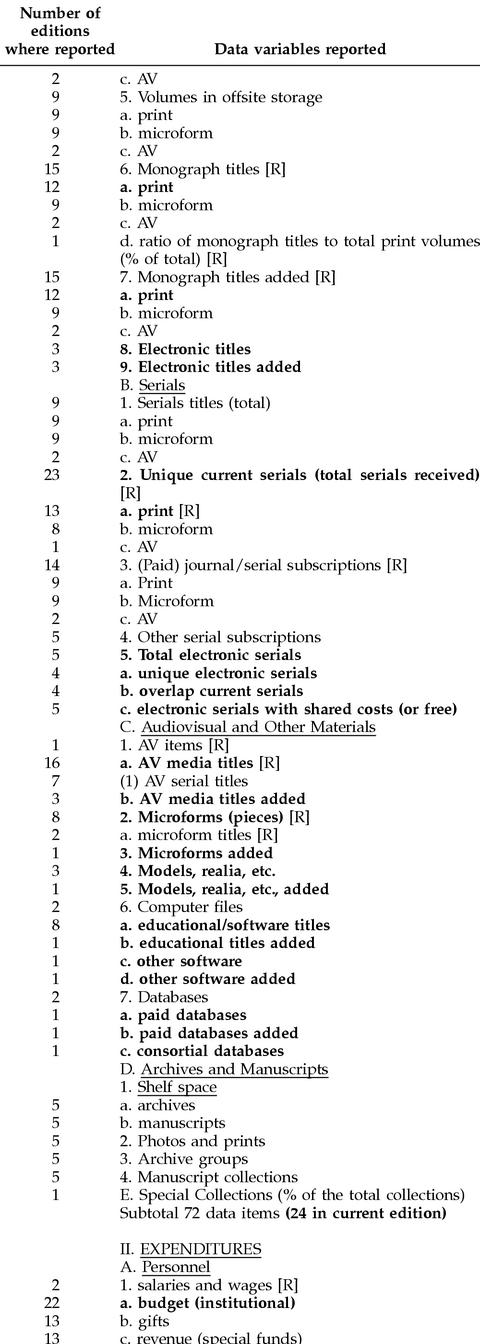
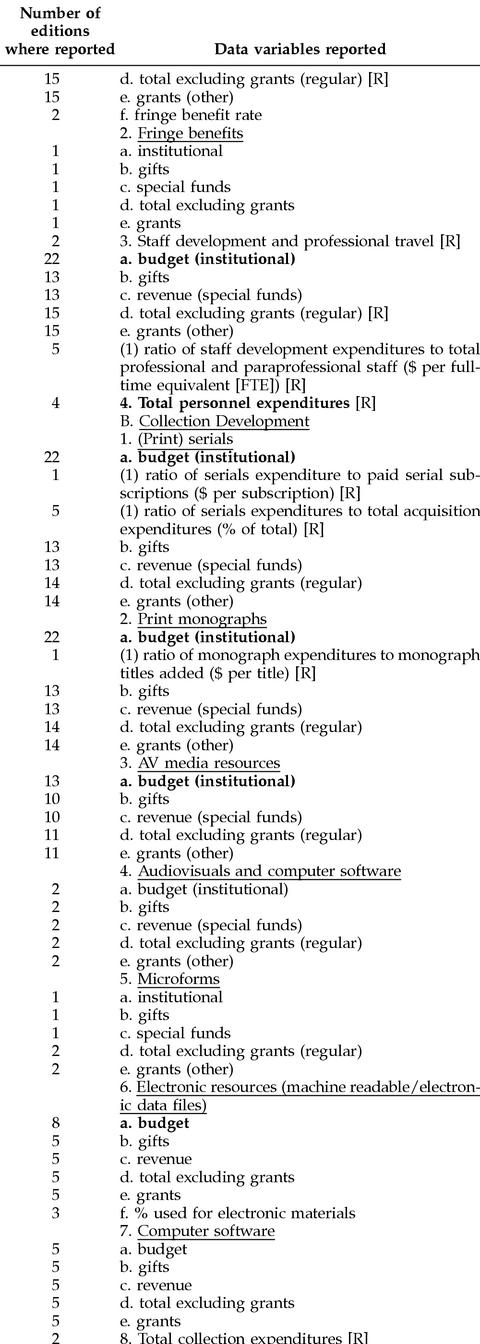
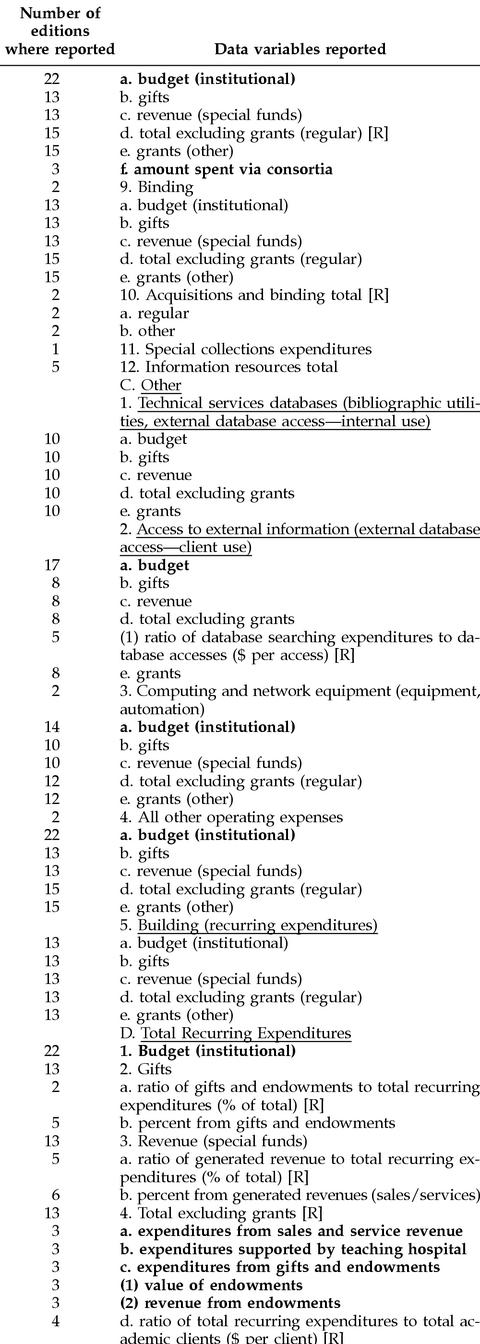
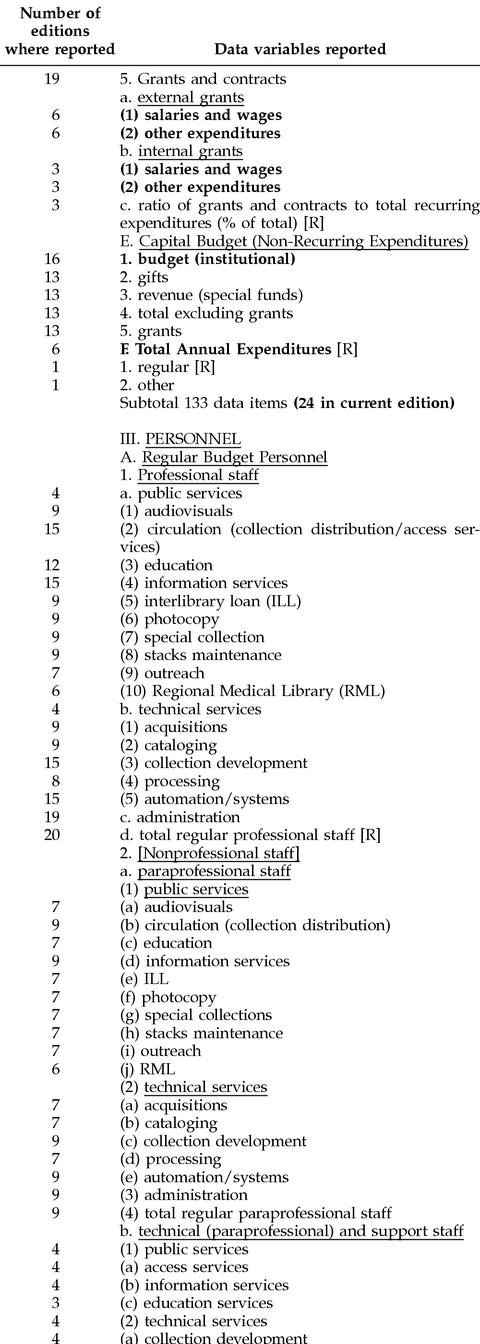
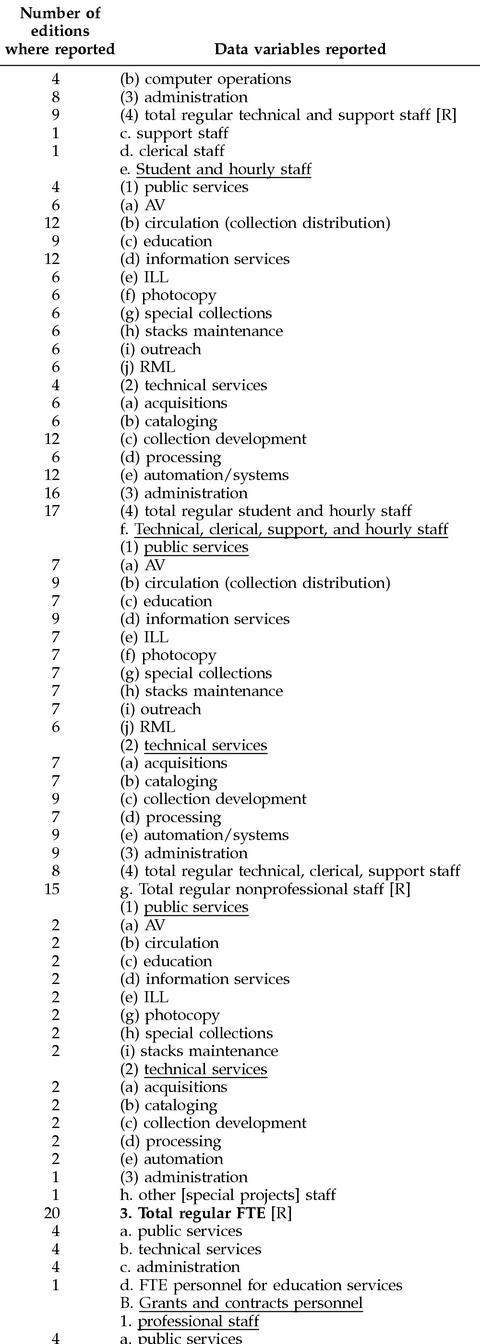
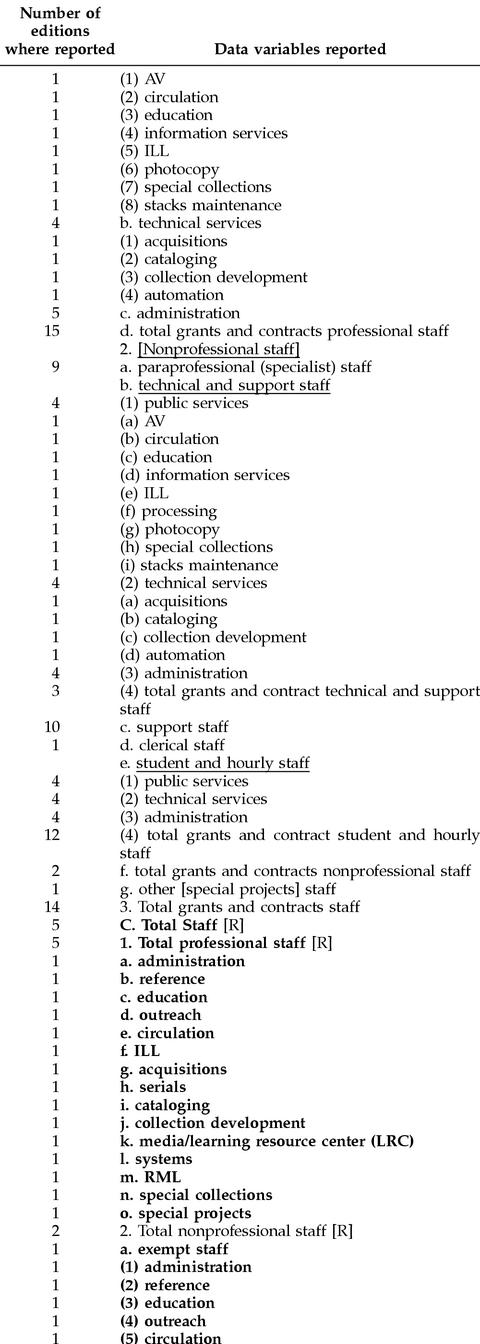
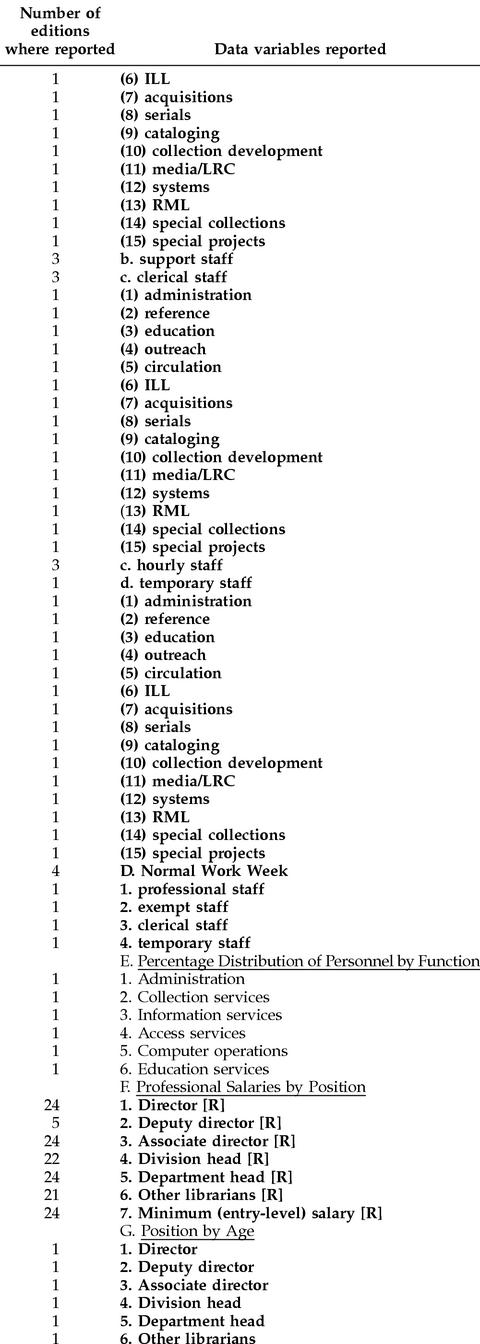
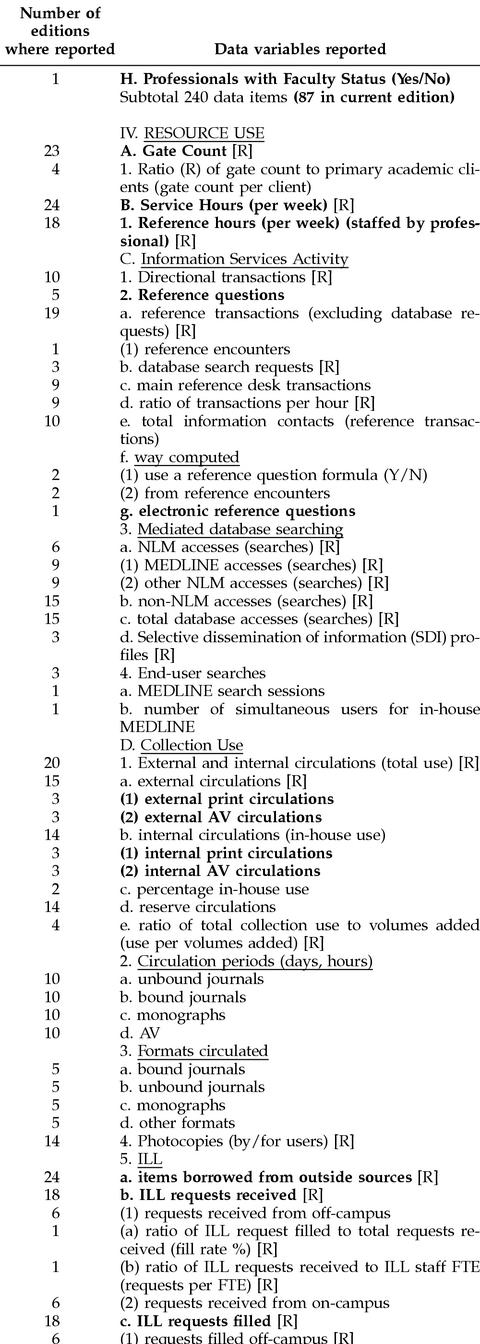
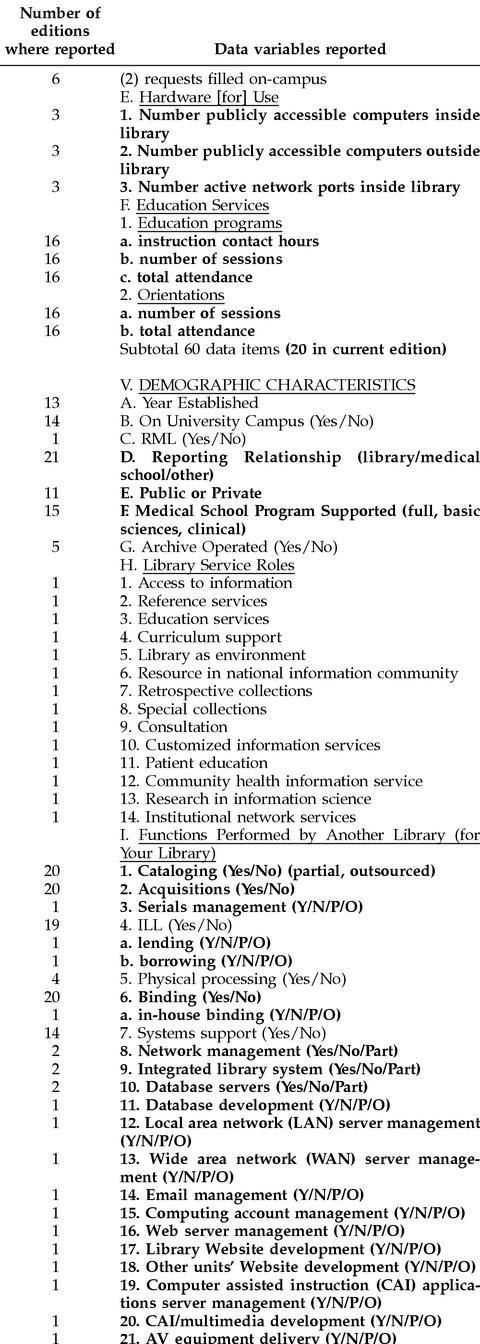
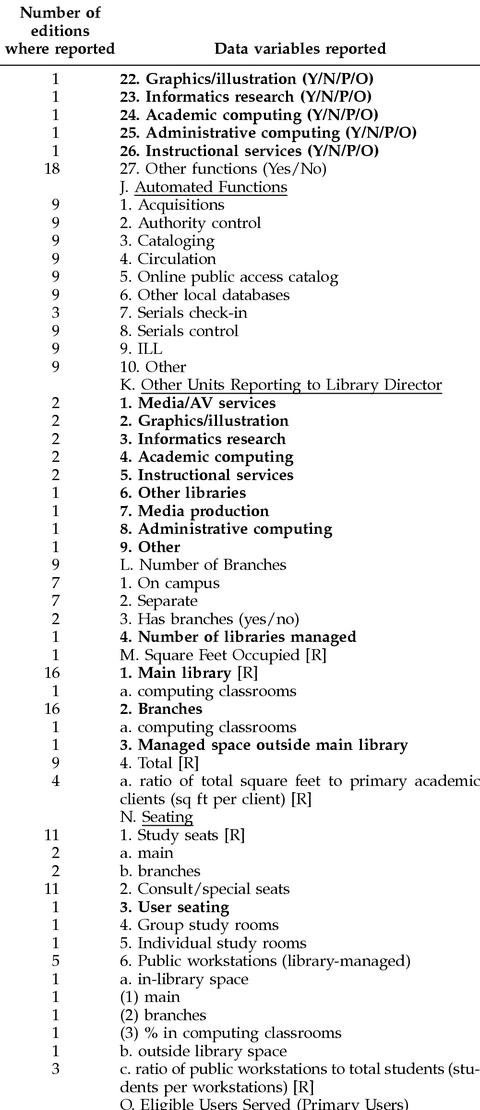
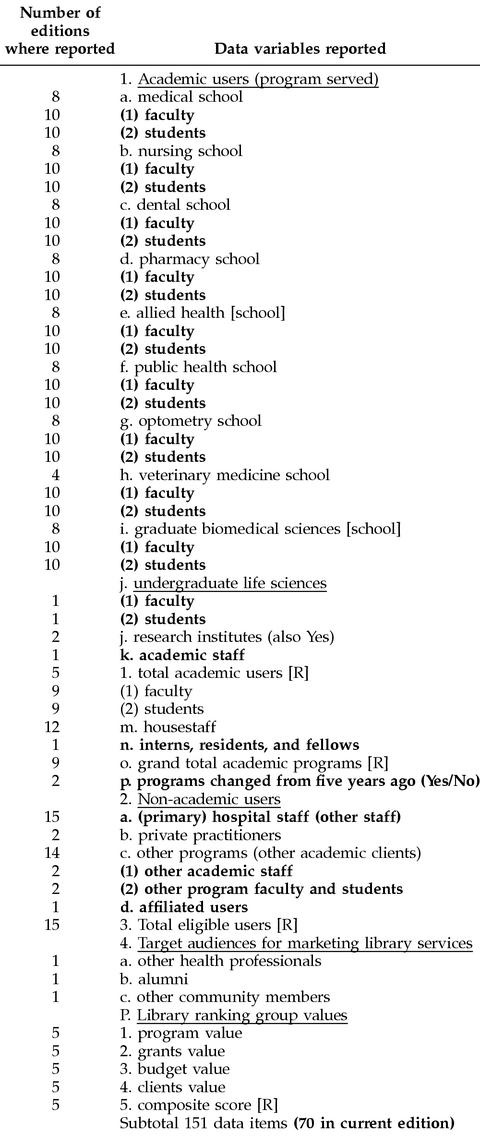
Another way of analyzing the survey response trends over the years is to look at the kinds of data collected from edition to edition. The appendix provides a complete outline of all 656 variables or data elements reported in the Annual Statistics surveys over the twenty-four editions from 1977 to 2001, along with the number of editions for which each item was requested and reported by the responding libraries. The items appearing in boldface italics in this appendix outline are the 225 variables reported in the 24th edition. The outline shows that the questions and resulting data over the twenty-four years of the survey have fallen into five general categories: (1) the collections maintained by these libraries (72 variables), (2) their expenditures (133 variables), (3) their personnel resources (240 variables), (4) the use of their resources by clients (60 variables), and (5) the various demographic characteristics of the library facilities and user populations served (151 variables).
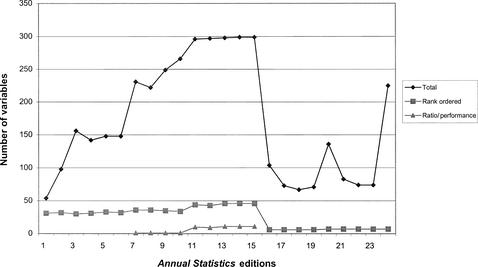
Finally, Figure 3 shows how the total number of data items collected varied from year to year over the past twenty-four editions as well as the number of these that were reported in rank-ordered tables or were calculated as ratio or performance measures in each edition. The total number of data items peaked with the fifteenth edition (reporting 1991/92 data) with 299 total items, of which forty-six were reported in rank-ordered tables and eleven were calculated ratio or performance measures.
Figure 3.
Variables reported in each survey edition, 1977/78 to 2000/01
ANALYSIS OF THE TWENTY-FOUR-YEAR TRENDS
What do the twenty-four editions of the Annual Statistics show about the changing patterns of collection building, library expenditures, staffing levels and professional salaries, and use of resources in academic medical center libraries since 1977? As Table 4 shows, only nineteen of the 656 variables collected over those years can be summarized in complete twenty-four-year trends. These include two variables for library collections, five for library expenditures, seven for library personnel, another five describing the use of library resources, and none for demographic measures of the facilities or the populations served by the libraries. However, it needs to be noted that for some of the multiyear trends included in this analysis, the definitions of the data variables used by the survey editors changed slightly or were refined over the years.
For example, current serial statistics have variously included journals, other serial publications, and differing formats such as print, microform, and audiovisuals over the years. Similarly, reference statistics have been defined variously as questions, transactions, or encounters answered at a main reference desk or anywhere in the library (Appendix). Thus, the exact shape of the trend lines or degree of variation from edition to edition might actually have been somewhat different, if the definitions and limits had remained entirely consistent. Also, because of the missing and zero responses as well as the changing number of responding libraries each year, the statistics did not represent a consistent number of responding libraries from year to year. However, the response rates for the nineteen variables included in this paper have been very high over the twenty-four years of the survey (generally in the 95% range), especially for those libraries serving U.S. medical schools.
Table 4 provides mean (average) figures for the first edition (1977/78 data), the twelfth edition (1988/89 data at about the midpoint of these 24 years), and the most recent twenty-fourth edition (reporting 2000/01 data), along with an increase factor figure showing by what order of magnitude each of these means increased over the past twenty-four years. For the expenditure and salary variables, additional columns for the twelfth and twenty-fourth editions show these values in constant dollars (that is, dollars adjusted for inflation using the U.S. consumer price index for urban consumers, with 1977 as the base year [12]).
Interestingly, the two most dramatic increases over this period (in absolute dollars) were in the average budget amounts spent for staff development and travel and for library collections. Each of these amounts have increased more than six times since 1977/78, and, even in constant dollars, they have doubled. The other areas of budget expenditure also increased steadily but much less dramatically, and expenditures for personnel and general operating expenses barely stayed ahead of inflation over this period. The total number of volumes in the collections increased by a factor of 1.8, but the average number of current journals or serials in these collections, while somewhat larger in the twenty-fourth edition than in the first, has remained remarkably steady, at least in this general view of the trends. More detail about this trend and the associated costs of these resources is presented later in this paper.
Steady, but very small, increases also occurred in the number of staff in academic health sciences libraries. And the salaries of manager-level personnel at least tripled over those two and one-half decades. However, in constant dollars, these average salaries barely outpaced inflation and actually decreased slightly for department heads and entry-level professional librarians. Interlibrary lending and borrowing activity also increased steadily, especially the average number of items each library borrowed. While this summary indicated that reference “transactions” or “questions” (the definitions for these varied over the years) have more than doubled since 1977/78, actually the complete trend line showed they peaked (at about 34,000 questions) with the twentieth edition (1996/97 data) and have been steadily declining for the past four years. Finally, the average number of library service hours per week also steadily increased over the twenty-four years, but only by 5% overall, or a total of about four hours a week.
Table 5 presents some of the possible ratio or performance measures that can be calculated from these twenty-four-year trend variables. It shows these calculated figures for the same three editions (1st, 12th, and 24th), with increase factors and constant dollar figures where appropriate. This table demonstrates that the average level of library support for individual professional staff development and travel increased nearly five times in absolute dollars (from $355 to $1,721) and even increased by about 60% in constant dollars. However, the average staff salary, while appearing to have increased by a factor of 2.6, was actually 12% lower in 2001 than it was in 1978, in constant dollars. The proportion of total library expenditures allocated to personnel salaries decreased over this period, while relatively more was allocated to collections and staff development and travel. The ratios of professionals to nonprofessionals and to the total staff as well as the ratios of directors' salaries to entry-level salaries and to total wages have all remained remarkably constant over the entire twenty-four years. Perhaps the most interesting of these performance measure trends were the ILL fill rates and the ratio of items lent to items borrowed by these libraries. Fill rates have remained quite steady at about 75%, but the number of items loaned in relation to each item borrowed has steadily and fairly dramatically decreased from over four-to-one to just 2.3-to-one.
Table 5 Ratio and performance measures calculated from the mean Annual Statistics with complete twenty-four-edition trends
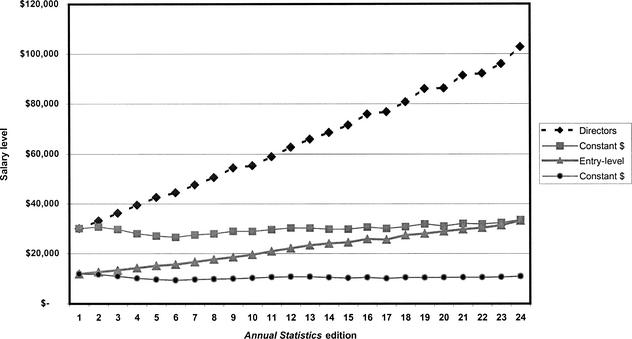
It is beyond the scope of this paper to present detailed trend lines for each of these statistics, but a few examples will show some of the characteristics of their general shape and the additional data available for future trend analyses. Figure 4 shows the absolute dollar and constant dollar mean trends for the salaries of library directors as well as entry-level librarians in all responding U.S. and Canadian medical school libraries over the twenty-four years. The absolute-dollar upward trend of these salaries looks quite dramatic, at least for the directors, until they are adjusted for inflation with constant dollars. These trends also demonstrate graphically the steadily growing discrepancy between director and entry-level salaries over this period. Another interesting characteristic of these trend lines is that the introduction of osteopathic medical school library directors to the data with the tenth edition had no perceptible influence on the slope of the lines.
Figure 4.
Library director and entry-level librarian average salary trends, 1977/78 to 2000/01
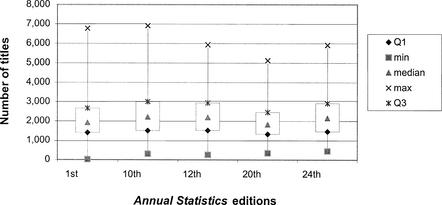
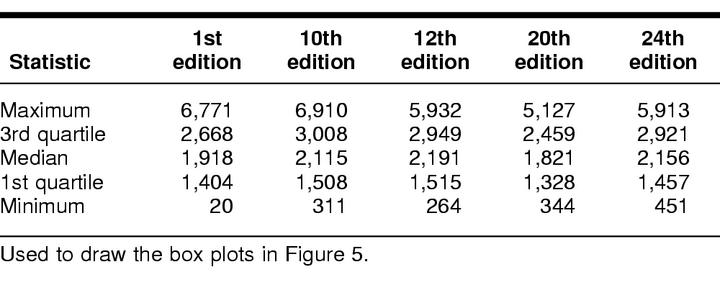
Figure 5 uses box plots to show the maximum-to-minimum ranges as well as the medians and first-to-third quartile ranges for current journals or serials in selected editions of the Annual Statistics over the same period. Table 6 also presents the number values for these statistics used to graph the box plots. The ninth and twentieth editions are also included because those are the years the responding libraries reported the highest and lowest median number of serial titles. These plots show not only that the median number of titles has hovered around 2,000 over the entire twenty-four years, but they also show a noticeable contraction in the minimum-to-maximum range of titles reported each year by these libraries during the period from the tenth to the twentieth editions.
Figure 5.
Current serial titles data boxplots with medians, ranges, and first-to-third quartile ranges for selected editions, 1977/78 to 2000/01
Table 6 Current serial title distribution statistics for selected editions, 1977/78 to 2000/01
Figure 6 shows the shape of the distributions of individual library responses for the question about the number of ILL requests received in the first, twelfth, and twenty-fourth editions. In 1977/78, the vast majority of AAHSL libraries received fewer than 15,000 requests for interlibrary loans, with the distribution completely skewed toward the lower end of the scale. By the twelfth edition, the distribution of libraries by number of requests processed was just starting to look like a more normal bell curve, with fewer libraries processing less than 15,000 requests and a considerable number in the 20,000-to-30,000 range. With the twenty-fourth edition, the distribution is still skewed toward the lower end of the scale, but the mean peak is nearing 20,000 requests and the righthand tail (excluding outliers) extends well above 40,000 requests per year.
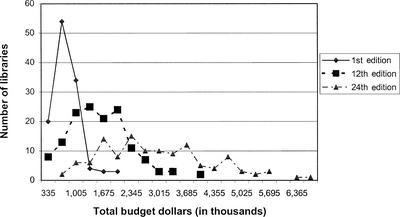
A very similar pattern of changing individual library response distributions for the total recurring annual budget expenditures variable is shown in Figure 7. The 1977/78 responses are largely clustered in the $300,000-to-$600,000 range, with a short high-end tail showing a very few libraries with total budgets greater that $1 million. By 1988/89, the distribution of budgets is quite normal with a symmetrical bell curve peaking in the $1-to-$2 million range. The 2000/01 response distribution has shifted even further toward the high end of the scale and is still relatively normal in shape, but it is much flatter, with a wide, low “peak” extending from about $1.5 million to $3.5 million, and a long tail showing many libraries with budgets ranging up to $6 million or more.
Figure 7.
Distribution of total recurring budgets for first, twelfth, and twenty-fourth editions, 1977/78, 1988/89, and 2000/01
DISCUSSION
The following is a brief attempt to suggest some of the possible factors that may account for the twenty-four-year trends represented by these nineteen variables and the ratio/performance measures calculated from them. The hypotheses drawn here are limited to those suggested by this small pool of variables. The authors are also assembling other data tables showing partial or incomplete trends for many more of the variables collected in the Annual Statistics over the years, and these will be used to enrich this analysis in future studies. However, this is beyond the scope of this first exploratory trend analysis.
The near doubling of the mean total number of volumes in these library collections is almost certainly the result of the simple cumulative effect of each library purchasing and binding about 2,000 print journals each year as well as ongoing monograph acquisitions. For example, if those 2,000 journal subscriptions result in 3,000 new bound volumes each year (just 1.5 volumes per title, probably a low estimate), this alone would account for about 70% of the total average increase of 106,000 volumes over this period. That would leave about 1,500 volumes per year to be accounted for from monograph acquisitions. If these estimates approximate the true averages, then it also follows that weeding has not been a significant factor in the collection development policies of these libraries over the past twenty-four years.
The economic factors that have constrained the ability of all research libraries to increase the size of their current journal collections have been well documented and analyzed at length elsewhere in the literature [13–15]. Annual price increases that often greatly exceeded general rates of inflation in the economy (and have exceeded inflation in the costs of health care and higher education) have prevented most academic health sciences libraries from building larger current journal collections and have challenged their ability to maintain even these relatively stable collections. As noted earlier, the box plots in Figure 5 show not only a gradual decrease in the median number of titles from 1986/87 to 1996/97 but also a noticeable narrowing of the range of current journals in these collections. During this ten-year period, price inflation took its greatest toll on health sciences library print serial budgets, and those libraries with the largest collections were hit hardest. But in the four years since that 1996/97 low point, the growing availability of electronic serials has clearly made it possible for most academic libraries to add hundreds of new titles to their collections. Not only is the median number of current serials in the Annual Statistics now back up above 2,000, but the overall minimum to maximum range is also again expanding.
The same economic factors that have inflated the costs of journals and other library acquisitions have also been largely responsible for the substantial increases in budgeted expenditures for collections and total recurring budgets. These increases have, no doubt, also helped to constrain the ability of these libraries to secure proportionate increases in funding for new staff, staff salaries, and other operating expenses. Even the 650% increase in budgeted resources for staff development and travel has had little impact on overall library budgets, because these expenditures have remained a tiny part of the total (less than 1%). When controlled for the number of professionals, travel expenditures recalculated in constant dollars have actually increased at an only slightly faster rate than the total budget (by 59% for each professional on average compared to 43% for the entire budget).
The few resource use trends available in this dataset, in aggregate, suggest that the transition to online, electronic access may be starting but has not yet really begun in earnest. The continuing steady growth up to the present in interlibrary lending and borrowing, and even library service hours, all strongly suggest that users still value the information contained in these print collections and that they continue to value the library as a place for study and finding information assistance. The more recent decline in reference questions answered may be an early indication that users are turning more often to online electronic information resources rather than coming to the library for personal help from a reference librarian. The very stable ILL lending fill rates may indicate that access to print collections has been constrained by some relatively constant, but unmeasured, factors that characterize all library collections of bound journals and books. These factors may include binding schedules, mis-shelving rates, vandalism, and even the limited ability of student workers and clerical staff to deal with the intricacies of bibliographic citations and shelving rules.
On the other hand, the steady decline in the ratio of items lent to items borrowed by these libraries over this period may also reflect the constraints on acquisitions budget these libraries have been working under for the past twenty-four years. In the mid-1970s, most of these resource libraries could have been expected to have almost all of the books and journals needed by their users, so ILL was largely limited to supporting the information needs of users in hospital settings with much smaller library collections. Today, no single library's collections can be expected to meet all the needs of its user community. The continuing growth rate of potentially useful print biomedical information has outpaced the growth capacity of library budgets and buildings. Thus, the need for these libraries to borrow materials from other libraries on behalf of their own users has grown faster than the requests they receive from other smaller hospital libraries. As the transition to electronic journals and monographs speeds up in the years ahead, interlibrary lending and borrowing statistics will likely change more dramatically and include a greater variety of document delivery sources and mechanisms.
CONCLUSION
This first exploratory trend analysis of all twenty-four editions of the Annual Statistics collected by the Association of Academic Health Sciences Libraries from 1977 through 2001 has provided an interesting, but necessarily limited, picture of the growth and changing dimensions of services and resources provided by academic health sciences libraries over the past two and one-half decades. With less than twenty variables available to show complete trends over those twenty-four years, this preliminary analysis can only provide a very broad and simplified picture. However, even given these limits, the Annual Statistics clearly have been, and can continue to be, an invaluable resource for documenting the changing characteristics of U.S. and Canadian academic health sciences libraries. A careful study of this trend data can also provide library managers and academic administrators with valuable insights to guide future planning.
Note on naming: In 1978, the Association of Academic Health Sciences Library Directors (AAHSLD) was incorporated. In 1996, in response to IRS requirements, AAHSLD formed a new organization to carry on its work, under the name Association of Academic Health Sciences Libraries (AAHSL). In this article, unless otherwise stated, the newer name is intended to refer to the organization throughout its history.
Table 1 Continued
APPENDIX
Outline of all data items reported in first twenty-four editions of the Association of Academic Health Sciences Libraries (AAHSL) statistics (N = 656)
Items in bold are included in the current twenty-fourth edition. Underlined items are labels used to complete the outline. [R] equals the eighty–one items that have been listed in rank order in one or more editions.
Contributor Information
Gary D. Byrd, Email: gdbyrd@acsu.buffalo.edu.
James Shedlock, Email: j-shedlock@nwu.edu.
REFERENCES
- Shedlock J, Byrd GD. The Association of Academic Health Sciences Libraries (AAHSL) Annual Statistics: a brief thematic history. J Med Libr Assoc. 2003 Apr; 91(2):177–84. [PMC free article] [PubMed] [Google Scholar]
- Leatherbury MC, Lyders RA. Trends in medical school library statistics in the 1980s. Bull Med Libr Assoc. 1992 Jan; 80(1):9–18. [PMC free article] [PubMed] [Google Scholar]
- Leatherbury MC, Lyders RA. Trends in medical school library statistics in the 1980s. Bull Med Libr Assoc. 1992 Jan; 80(1):11. 16–18. [PMC free article] [PubMed] [Google Scholar]
- Florance V. ed. 1994–95 annual statistics of medical school libraries in the United States & Canada. 18th ed. Seattle, WA: Association of Academic Health Sciences Library Directors, 1996:vi–xvi. [Google Scholar]
- Florance V, Masys D. Next-generation IAIMS: binding knowledge to effective action. Washington, DC: Association of American Medical Colleges, 2002. [Google Scholar]
- Florance V, Masys D. Next-generation IAIMS: binding knowledge to effective action. Washington, DC: Association of American Medical Colleges, 2002, 17–19. [Google Scholar]
- Lyders R. 1988–89 annual statistics of medical school libraries in the United States & Canada. 12th ed. Houston, TX: Association of Academic Health Sciences Library Directors, 1990:47–8,57–8. [Google Scholar]
- Lyders R. 1986–87 annual statistics of medical school libraries in the United States and Canada. 10th ed. Houston, TX: Association of Academic Health Sciences Library Directors [Houston Academy of Medicine—Texas Medical Center Library], 1988:29–30. [Google Scholar]
- Lyders R. 1986–87 annual statistics of medical school libraries in the United States and Canada. 10th ed. Houston, TX: Association of Academic Health Sciences Library Directors [Houston Academy of Medicine—Texas Medical Center Library], 1988:87–8. 1988–89 [Google Scholar]
- Lyders R. 1986–87 annual statistics of medical school libraries in the United States and Canada. 10th ed. Houston, TX: Association of Academic Health Sciences Library Directors [Houston Academy of Medicine—Texas Medical Center Library], 1988:89–90. [Google Scholar]
- Shedlock J. 2000–01 annual statistics of medical school libraries in the United States and Canada. 24th ed. Seattle, WA: Association of Academic Health Sciences Libraries, 2002:34–6. [Google Scholar]
- Bureau of Labor Statistics. Consumer price index, all urban consumers (CPI-U), U.S. city average, all items, annual percent changes from 1913 to present. [Web document]. Washington, DC: U.S. Department of Labor, 2002. [cited 2002 Aug 27]. <http://www.bls.gov/cpi/#tables>. [Google Scholar]
- Byrd GD. An economic “commons” tragedy for research libraries: scholarly journal publishing and pricing trends. Coll Res Libr. 1990 May; 51(3):184–95. [Google Scholar]
- Moline SR. The influence of subject, publisher type, and quantity published on journal prices. J Acad Libr. 1989 Mar; 15(1):12–8. [Google Scholar]
- Lewis DW. Economics of the scholarly journal. Coll Res Libr. 1989 Nov; 50(6):674–88. [Google Scholar]


