Abstract
A goal of oncology is the individualization of patient care to optimize therapeutic responses and minimize toxicities. Achieving this will require noninvasive, quantifiable, and early markers of tumor response. Preclinical data from xenografted tumors using a variety of antitumor therapies have shown that magnetic resonance imaging (MRI)-measured mobility of tissue water (apparent diffusion coefficient of water, or ADCw) is a biomarker presaging cell death in the tumor. This communication tests the hypothesis that changes in water mobility will quantitatively presage tumor responses in patients with metastatic liver lesions from breast cancer. A total of 13 patients with metastatic breast cancer and 60measurable liver lesionsweremonitored by diffusion MRI after initiation of new courses of chemotherapy. MR images were obtained prior to, and at 4, 11, and 39 days following the initiation of therapy for determination of volumes and ADCw values. The data indicate that diffusion MRI can predict response by 4 or 11 days after commencement of therapy, depending on the analytic method. The highest concordance was observed in tumor lesions that were less than 8 cm3 in volume at presentation. These results suggest that diffusion MRI can be useful to predict the response of liver metastases to effective chemotherapy.
Keywords: MRI, diffusion, chemotherapy, breast cancer, liver metastases
Introduction
Breast cancer is the most common life-threatening malignancy in women. Metastatic disease is rarely curative despite new therapies and improvements in diagnostics. The selection of systemic treatment is based on the aggressiveness of the cancer, the patient's comorbidities, and the response rates and toxicities associated with each therapy. Most patients with metastatic breast cancer will receive numerous antitumor therapies in an effort to palliate symptoms and prolong life. Thus, preservation of quality of life—and not solely response rates—has become an important determinant in choosing therapies. Response rates to various antitumor regimens range from 10% to 70%, depending of the number of prior therapies, interval from initial diagnosis, adjuvant therapy received, and unknown individual characteristics of the tumor. Thus, predicting a patient's response to a particular therapy is difficult. Typically, oncologists empirically initiate therapies based on known response rates from the literature and then follow the patients closely for evidence of response or disease progression based on signs, symptoms, and/or objective radiographic measures of tumor size. Because of the inherent insensitivity of standard radiographic tools to accurately measure changes in tumor volume, radiographic studies are usually repeated on 3- to 6-month intervals for monitoring responses. For patients with aggressive disease involving vital visceral organs, months of ineffective therapy can lead to permanent and irreversible losses in quality of life, performance status, and early mortality. Thus, an early, noninvasive, and reproducible method to determine a tumor's responsiveness to a particular antitumor therapy would greatly benefit these patients. Responders would be continued on successful therapy, and nonresponders would be discontinued from ineffective and toxic therapy prior to disease progression and loss of performance status.
Several MRI modalities have been explored in various cancer models for the early detection of therapy response. T2-weighted imaging has been explored to monitor response in pancreatic cancer [1]; T1 (ρ) imaging has been used to assess treatment in brain tumors [2]; dynamic contract-enhanced (DCE) imaging has been used to asses response to cytotoxic and cytostatic therapies (reviewed in Ref. [3]); and 1H magnetic resonance spectroscopy has been used to detect changes in tumor lactate levels as early indicators of response [4].
Conventional MRI is a sensitive and specific indicator of metastatic disease to the liver [18]. The validity of MRI for lesion volume (LV) measurements and quantitation of response to chemotherapy has been established [19–21]. Pathologic correlation studies have established the histologic basis of variable appearances of hepatic metastases on conventional MR images [22]. The use of both T1- and T2- weighted sequences can identify metastases, in spite of variable T1 and T2 of the metastases relative to normal liver tissue. The use of both moderately and heavily T2-weighted images provides high specificity for the identification of common benign lesions, such as cysts and hemangiomas [23,24,25]. These benign lesions can thus be identified and excluded from quantitative diffusion measurements because of their markedly higher pretreatment apparent diffusion coefficient of water (ADCw) [26].
In recent years, the ADCw, as measured by diffusionweighted magnetic resonance imaging (DWMRI), has emerged as a novel indicator of tumor response to therapy. DWMRI is a noninvasive imaging technique that measures the mobility of water in tissues. Generally, cells restrict water mobility and, hence, as cell volumes decrease in response to therapy, there is an increase in the ADCw. In preclinical models, there is abundant evidence that the ADCw in tumors increases early in response to successful therapies. This has been shown in sarcoma, glioma, and breast carcinoma xenografts treated with cytotoxic chemotherapies, cytostatic chemotherapies, radiation therapy, and gene therapies [5–11]. Previous work by our group has demonstrated this effect in breast [12] and prostate [13] cancer xenografts treated with taxanes. Treatments that caused cells to shrink led to early increases in ADCw that were predictive of the ultimate tumor response. It is tempting to extrapolate that the therapy-induced increases in ADCw are due to cell shrinkage, although the exact mechanisms have not been determined [14]. Notably, cell shrinkage occurs early during the apoptotic program [16]. Thus, it has been hypothesized that apoptosis-induced cell shrinkage leads to increased extracellular volume. Because water is not as diffusionally restricted in the extracellular space, a decrease in cell volume fraction (i.e., intracellular water) will result in an overall increase in the ADCw [12]. Because of the strength of these preclinical data, clinical trials have begun to examine the effectiveness of the ADCw as an early surrogate marker for therapy response, particularly in brain tumors [15,16].
This pilot trial examined the change in ADCw of liver metastases in patients after initiation of new chemotherapy regimens. Despite the motion problems inherent in visceral imaging, we have chosen to image liver metastases because: 1) the liver is more amenable to MRI compared to the lungs; (2) many other tumor types metastasize commonly to the liver (e.g., gastrointestinal carcinomas, lung cancers, and melanomas); and (3) patients with liver metastases typically have a poor prognosis compared to patients with nonvisceral metastases and thus would benefit most from early predictors of response.
This communication tests the hypotheses that: (A) patients with objective clinical responses will have early increases in the ADCw of their lesions, and (B) that the magnitude of change in ADCw will predict the magnitude of objective response. Our results are consistent with both hypotheses being true. Hence, changes in the ADCw may improve the treatment of patients by predicting antitumor responses early during the course of a new therapy.
Materials and Methods
Participant Selection
Patients were recruited from the clinics of the Arizona Cancer Center and provided voluntary informed consent. Patients eligible for this study met the following criteria: histologically confirmed metastatic breast cancer with a minimum of one liver metastases measuring greater than 1 cm in diameter, measurable in at least two dimensions; Karnofsky performance status (KPS) ≥ 70%; nonpregnant state; at least 18 years of age; and scheduled to initiate a new chemotherapy regimen for their metastatic disease.
MRI
Patients underwent their first MRI exam prior to receiving their first course of therapy (baseline) and then at 4, 11, and 39 days after the commencement of therapy. Conventional T1-weighted and T2 fast spin echo (FSE) MRI were used to identify and measure intrahepatic metastases and to objectively quantify lesion responses to chemotherapy. Diffusionweighted imaging was used to monitor changes in the ADCw of lesions. Imaging protocols were carried out on participants in accordance with protocols approved by the IRB at the University of Arizona. All MRIs were performed on a GE Signa echospeed scanner at 1.5 T equipped with a 22-mT/m, actively shielded, 120-mT/m per msec gradient system.
A single-shot fast spin echo (SSFSE) sequence was utilized to obtain contiguous T2-weighted images within a breath-hold encompassing the entire liver. Image parameters for the T2-weighted images were: TE = 93.9 and 187 msec, 256 x 160 image matrix, 0.5 signal averages (i.e., half- Fourier), FOV = 36 x 27 cm, 31.3 kHz receiver bandwidth, and 6 mm slice thickness. The use of the moderate and heavily T2-weighted SSFSE scans enabled the differential identification of cysts and hemangiomas by the radiologist (E.O.) as described previously [25], and these lesions were excluded from diffusion and LV measurements. T1- and T2-weighted images were acquired within a breath-hold utilizing a 3D fast gradient echo sequence. The 3D fast gradient echo sequence obtained a 3D image of the abdomen, which encompassed the whole liver. Image parameters for the 3D T1-weighted images were: TE = 1.5 msec, TR = 7.2 msec, 256 x 128 x 32 image matrix, 6 mm slice thickness with no interslice gap, FOV = 36 x 27 cm, and 62.5 kHz receiver bandwidth. Images were transferred offline to a workstation and viewed by a radiologist (E.O.), who manually circumscribed lesions in a blinded fashion.
Diffusion-Weighted Single-Shot Echo Planar Imaging (SSEPI)
Diffusion-weighted SSEPI images were obtained through the entire liver. Image parameters for the DW-SSEPI images were as follows: TE = 103 msec, 128 x 90 image matrix, FOV = 36 x 27 cm, TR = 6 seconds, 100 kHz receiver bandwidth, and 6 mm slice thickness. Diffusion-weighted images were acquired during a breath-hold on inhalation in 6-mm slices through the entire liver. Diffusion weighting was applied in the superior/inferior direction with b = 0, 150, 300, 450 sec/mm2. All measurements were repeated twice (i.e., two repetitions).
LV Measurements
Total tumor burden in the liver was determined by analyzing up to five of the largest tumor nodules in each patient. Tumor nodule volumes were measured on the 3D fast gradient echo images on contiguous slices. Manually circumscribed regions of interest (ROIs) were used to quantitate the lesion area on each slice and these were multiplied by the slice thickness and added-on contiguous slices to arrive at LVs (mm3). Determination of lesion response was made on a lesion-by-lesion basis by evaluating the ratio between LVs on day 39 and pretherapy (i.e., day -3) LV (%ΔLV = LVday 39/LVbaseline).
ADCw Calculations
The influence of motion during acquisitions raised concern regarding the accuracy of image registration from one b value to the next. To overcome this, histograms of pixel intensity were obtained for each lesion at each b value from manually circumscribed ROIs combined across slices. Multislice data and histograms were visualized using Amira image analysis software (TGS, San Diego, CA). Average values of signal intensity Ii were obtained from these histograms and compared to the intensities in the absence of diffusion weighting (Io), where b = 0. ADCw values were calculated for each measurement using a least squares method to fit a set of data points to ln(Ii/ Io) = -biADCw (Eq. (1)), with the y-intercept set equal to zero. Hence, an average ADCw value was obtained for each lesion. In addition to intensity values, pixel count values and intensity standard deviations were obtained for each ROI at each repetition.
The changes in the ADCw values following therapy were determined by calculating the percent change in the ADCw from baseline (day -3), with each patient serving as his/her own control. , and correspond to the percent change in the ADCw from baseline to days 4, 11, and 39, respectively:
| (1) |
Results
Sixteen patients with metastatic breast cancer were initially enrolled in this pilot trial. Three patients were unable to complete the imaging protocol due to morbidity or early mortality. Of the 13 evaluable patients, one patient was evaluated by diffusion MRI during the initiation of two different courses of chemotherapy (weekly paclitaxel and weekly vinorelbine). Thus, the ability of diffusion MRI to accurately predict chemotherapy responses was analyzed after the initiation of 14 separate chemotherapy regimens in 13 patients. Patient characteristics as well as chemotherapy regimens received during the study are detailed in Table 1. For the 13 evaluable patients, up to five hepatic metastases were identified by MRI for each patient, for a total of 60 lesions analyzed. All patients were scanned at baseline, and then at 4, 11, and 39 days after commencement of a new chemotherapy regimen. Diffusion imaging was not obtained on day 11 for three patients. In addition, three lesions were not identifiable on the day 39 diffusion-weighted images. Thus, 60 lesions were analyzed for day 4, 50 lesions were analyzed for day 11, and 57 lesions were analyzed for day 39 (Table 2).
Table 1.
Patient Characteristics and Therapies.
| Number of patients | 13 |
| Mean age (range) [years] | 55 (38–73) |
| Female:male | 12:1 |
| Chemotherapy regimens | |
| Taxane | 9 |
| Vinorelbine | 3 |
| Capecitabine | 1 |
| Paclitaxel and trastuzumab | 1 |
| Number of prior chemotherapy regimens | |
| None | 5 |
| One | 3 |
| Two | 3 |
| ≥ 3 | 2 |
Table 2.
Summary of Lesion Responses.
| Classification of Group (%ΔLV = LV39 / LVB) | Lesion Counts | Volumes at Presentation (cm3 ± SD) | |||
| Baseline | Day 4 | Day 11 | Day 39 | ||
| 1) Progressive disease (>125%) | 17 | 17 | 12 | 17 | 17.0 ± 43.4 |
| 2) Progressive disease (113–125%) | 4 | 4 | 2 | 4 | 94.5 ± 177.0 |
| 3) Stable (88–112%) | 9 | 9 | 9 | 9 | 8.5 ± 10.3 |
| 4) Minor response (75–87%) | 6 | 6 | 6 | 6 | 7.4 ± 5.3 |
| 5) Major response (< 74%) | 24 | 24 | 21 | 21 | 10.8 ± 15.1 |
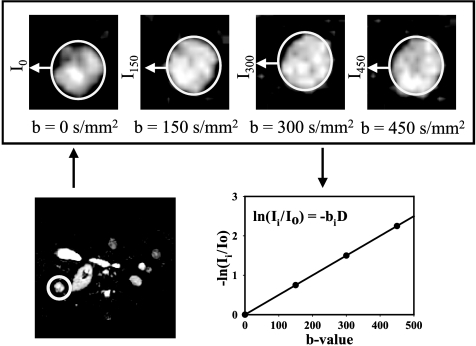
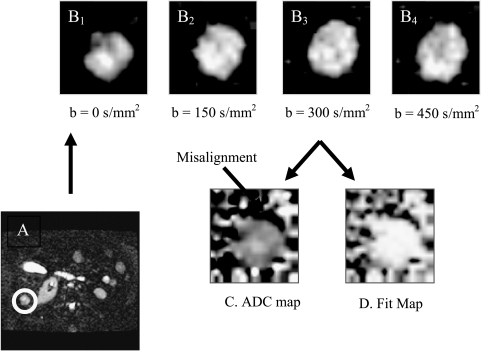
Examples of typical image quality are presented in Figure 1, which shows echoplanar diffusion-weighted images obtained at b values from 0 to 450 sec/mm2. At higher b values, lesions have higher conspicuity relative to normal liver, indicating motionally restricted water in the lesion. Note also the presence of substructures within each lesion, which may indicate microenvironmental heterogeneity. Because of visceral motion during the breath-hold period, images at different b values were not parsed on a pixel-by-pixel basis. This was determined early on in the study where ADCw maps were calculated on a pixel-wise basis using a single b value, according to ADCw(x,y) = In[I(x,y) / Io(x,y)] / b, where I is the intensity in the DW image at b = 450 sec/mm2 and Io is the intensity in an image obtained without diffusion gradients. Histograms of ADCw pixel values were generated from tumor ROIs combined across slices. From the ADCw histograms, a median value was reported for each lesion and measurement. ADCw values for the first and second measurements were labeled by ADCw1 and ADCw2. The reproducibility of the ADCw value was determined as the numeric difference between ADCw1 and ADCw2 for each lesion. These analyses showed a large variability in the ADCw for lesions located in the dome of the liver when analysis is done on a pixel-by-pixel basis, which was likely due to cardiac motion (data not shown, provided with review). The problem with pixel-by-pixel calculations was also demonstrated with multiple b values, as shown in Figure 2. In these analyses, lesions were identified in whole torso images (Figure 2A) and images were obtained at four b values (Figure 2, B1–B4). Pixel-by-pixel fits to determine the ADCw were obtained using Eq. (1), and the results are displayed in Figure 2C, which shows a crescent of low ADCw values near the ventral edge of the lesion. This region also had low correlation coefficients (r2 < 0.85), further indicating that this artifact was due to visceral motion (Figure 2D). Thus, to include all visible lesions with reliability, subsequent analyses were performed with manually circumscribed ROIs for each lesion at each b value.
Figure 1.
Representative images. Echoplanar diffusion-weighted images from patient with breast cancer metastases. A full torso image is shown in the lower left, wherein a metastatic lesion in the liver is delineated with circle. The upper figures show the lesion images from the same slice obtained at b values from 0 to 450 sec/mm2. In these images, the display gains have been increased so as to scale to the brightest spot in each image. The actual intensities decrease as shown in the plot. The natural log of the average signal intensity within the ROI relative to b = 0 was expressed as a function of b value to calculate the apparent diffusion coefficient ADCw (denoted as D in the figure).
Figure 2.
Pixel-by-pixel ADC calculations. Slice from torso image (A) was used to identify lesions, demarcated by circle. Lesion images were obtained at b values from 0 to 450 sec/mm2 (B1–B4). Individual pixels were fit to obtain ADC values using Eq. (1), assuming perfect interimage registration. As above, the display gains have been adjusted to the brightest spot in each image. This resulted in a dark crescent at the edge of the ADC map (C), suggesting misalignment of pixels between scans at different b values. This was confirmed using a map of the correlation coefficients (D) wherein the bright values had higher r2 values (white > 0.90). This map also showed that the dark crescent in (C) coregistered with the low r2 values in (D).
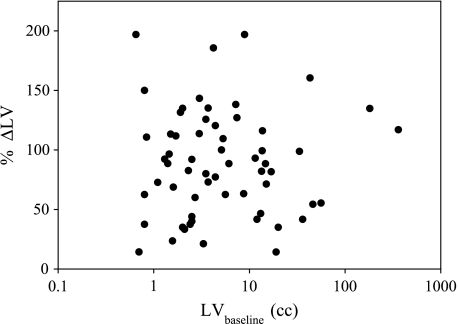
As expected, there was a strong correlation, r = 0.977 (P < .001), between the manually circumscribed ROI pixel counts (in DWMR images) and the LVs obtained from the radiology reports, indicating that the circumscribed ROI was an accurate representation of the LV (data not shown). The average signal intensities within the ROIs were fit to determine the ADCw using equation [1]. A summary of lesion responses among the 13 patients is shown in Table 2. Although there appears to be a trend to smaller lesions among the responding groups, this was not significant. This was further documented by examining the relationship between the LVs at presentation (LVbaseline) and therapy-induced change in LV (%ΔLV), shown in Figure 3. These data clearly show no relationship between these two measures.
Figure 3.
Relationship between pretherapy LV and clinical response. The LV at presentation (LVbaseline) was determined manually by circumscribing lesions on SSFSE images. The objective clinical response was determined by calculating the change in LVs between presentation and day 39 following commencement of therapy (%ΔLV). As shown, there is no correlation between LV and response (r = 0.13).
Mean intensity values were extracted from diffusionweighted images across all slices for each lesion at each b value and each exam to calculate the ADCw. For the mean ROI analysis, the numeric difference between ADCw1 and ADCw2 was examined to determine reliability. Ideally, if a measurement is reproducible, the difference should be zero. The mean and the standard deviation of the difference in the ADCw values obtained from the two replicated images for each lesion and exam are 19.6 and 376.4 mm2/sec, respectively. Patients were grouped from one to five according to tumor response (Table 2). Because analysis was completed on a lesion-by-lesion basis, there is a range of tumor responses for each patient.
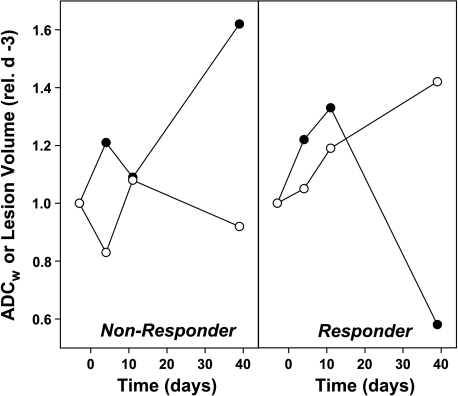
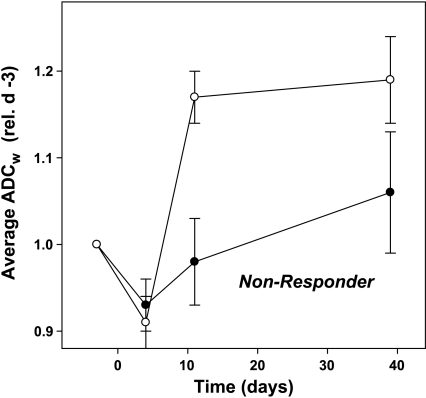
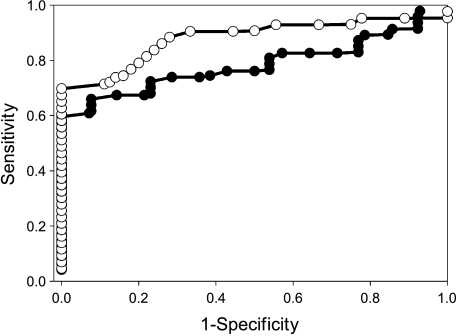
As stable or responding disease is similarly treated clinically, the response groups were pooled into two larger subsets. Lesions in groups 1 and 2 were considered nonresponders, and lesions in groups 3, 4, and 5 were pooled into a responder subset. Figure 4 shows typical chances in ADCw in a responding (right-hand panel) and a nonresponding (left-hand panel) patient. Data from all patients are shown in Figure 5. These data indicate that, as a group, responders can be distinguished from nonresponders by day 11 following commencement of therapy. Table 3 indicates that nonresponder ADCw values are never significantly different from baseline, whereas responders are significantly different on days 11 and 39. Hence, an increase in the ADCw value relative to baseline was a strong predictor of response. The predictive value of the ADCw changes was also examined by constructing a receiver-operator-characteristic (ROC) curve (Figure 6). As shown, there is significant potential to diagnose response even by day 4, with an area under the curve of 0.84, and this improves to 0.91 by day 11. Sensitivity and specificity are both approximately 80% on diagonal. Sensitivity can be over 70% at a specificity of 100% and, conversely, a sensitivity of over 90% is reached at a specificity of 70%. Sensitivity is TP / (TP + FN) and specificity is TN / (TN + FP).
Figure 4.
Representative responses. Changes in the ADCw (○) and volumes (●) for single lesions in a nonresponding patient and a responding patient. ADCw values were calculated from ROI analyses, as described in the Materials and Methods section. LVs were calculated from SSFSE images obtained in the same session. Data are expressed relative to the values at baseline.
Figure 5.
Distribution of ADCw values for nonresponders and responders and volumes. Patients with positive responses or stable disease (classes 3–5) were grouped as responders (○), and those in classes 1 and 2 were grouped as nonresponders (●). Data show ADCw values (± SD) normalized to the individual pretherapy baseline ADCw for each patient. Data points are shown for baseline, day 4 (P = .312), day 11 (P = .066), and day 39 (P = .074).
Table 3.
F and P Values from Paired ANOVA Test Comparing Patient ADC Values on Days 4, 11, and 39 Following Commencement of Therapy Versus Their Baseline Values.
| Nonresponders (Categories 1 and 2) | Responders/Stable (Categories 3–5) | |||
| F | P | F | P | |
| Day 4 vs day 0 | 1.682 | 0.20 | 0.292 | 0.590 |
| Day 11 vs day 0 | 1.013 | 0.32 | 5.610 | 0.021 |
| Day 39 vs day 0 | 0.279 | 0.60 | 7.379 | 0.008 |
Figure 6.
ROC curves. ROC for day 4 (●) and day 11 (○) posttherapy. Lesions were identified as responders or nonresponders, and the changes in ADCw were rank-ordered. At each value of percent change in ADCw, the numbers of responders at higher values were classified as true positives (TP) and the number of nonresponders were false positives (FP). At all lower values, the numbers of nonresponders at lower values were true negatives (TN) and the numbers of responders were false negatives (FN). The areas under the curve for each analysis were 0.84 on day 4 and 0.91 on day 11.
At a deeper level of evaluation, the strength of the association between the ADCw and the objective clinical response was evaluated using Pearson correlation coefficients. These compared the scalar clinical response (i.e., percent change in the LV between days -3 and +39) with the scalar percent change in ADCw. A significant correlation was observed between tumor response and percent change in ADCw at days 4 and 39, with the correlation on day 11 just failing significance at a P value of .077 (Table 4). Negative values of the Pearson coefficient indicated that the increases in the ADCw were correlated to decreases in LVs. Notably, the significance between tumor response and change in ADCw held only for the smaller lesions (i.e., < 8 cm3), even though there was no difference in the overall response rates between large and small lesions (Figure 3, Table 4). It is also notable that the correlation was strongest on day 4, which was the earliest time point examined. This is in contrast with the group analyses shown in Figure 5, wherein the binary response/nonresponse was best predicted by day 11.
Table 4.
Pearson Correlation Values for All Lesions on Days 4, 11, and 39 Postcommencement of Chemotherapy.
| Day | Test | Lesions | ||
| All | < 8 cm3 | > 8 cm3 | ||
| 4 | Pearson correlation | -0.305 | -0.413 | -0.140 |
| P (two-tailed) | 0.018 | 0.008 | 0.557 | |
| N | 60 | 40 | 20 | |
| 11 | Pearson correlation | -0.253 | -0.306 | -0.215 |
| P (two-tailed) | 0.077 | 0.069 | 0.416 | |
| N | 50 | 36 | 14 | |
| 39 | Pearson correlation | -0.285 | -0.345 | -0.212 |
| P (two-tailed) | 0.032 | 0.032 | 0.397 | |
| N | 57 | 39 | 18 | |
Discussion
A challenge to oncologists in the 21st century will be individualization of patient care. This will require minimally invasive measures of patient response, preferably early in the therapy regimen. The current pilot trial indicates that the MRmeasured ADCw may be appropriate as an early marker of response in breast cancer patients with hepatic metastases. This is in agreement with work from other groups who have used ADCw to monitor response in brain tumors [8,9,11,15,17]. The current work is different in that it is more generally applicable to a larger number of patients, compared to gliomas. Liver metastases are common for breast carcinoma, gastrointestinal carcinoma, and melanoma. The current results are apparently discrepant with a recent study in rectal tumors, which showed a decrease in ADCw in patients responding to chemoradiotherapy [27]. In that work, the drop in ADCw was associated with a sloughing of dying parts of the lesions into the lumen of the rectum. Hence, the domains of the lesion that remained were not responding and apparently healthy.
These results indicate that changes in the ADCw can predict clinical outcome, within limits. First, the pooled data suggest that statistical significance is highest by day 11, compared to day 4. This is in contrast to the correlation analyses, which showed a higher significance at day 4. This apparent discrepancy could be explained by the presence of two outliers in the responding group on day 4, thus reducing the average change by day 4. These outliers were both larger (> 8 cm3) lesions, and the correlation coefficients for this group of lesions were reduced. Pearson correlation coefficients are sensitive to outliers. All of these analyses suggest that smaller tumors respond more quickly and, consequently, the optimum time for evaluation may be dependent on the size of the lesions. Despite this, significant data were obtained from smaller lesions, even though they are more difficult to circumscribe and more prone to processing errors.
A shortcoming of the current work is in the inability to assess microdomain structure by parsing the data on a pixelby- pixel basis due to visceral motion between scans. Hence, data analyses required cumbersome, manual circumscribing of ROI. We are currently working on solutions for automated segmentation and registration of these lesions. Pixel-by-pixel analyses will also allow interrogation of the geographic microdomains of lesion ADCw values (e.g., Figure 1), which may yield higher dynamic range and higher density of relevant information. We hypothesize that such data will have greater sensitivity than the current ROI analysis.
Changes in the ADCw are presumably distal to the site of drug action. Hence, it is more appropriate as a biomarker for clinical response than, for example, detection of pharmacodynamics. This distinguishes it from more directed molecular imaging approaches to measure drug-target interactions. It is also distinguished from positron emission tomography imaging of fluorodeoxyglucose (FdG-PET) trapping. Changes in FdG uptake and retention can be observed with tumor response. Because FdG-PET requires delivery of substrate to cells, specific uptake rates are affected by the rate and flow of delivery (i.e., vascular changes), metabolism (i.e., changes in monosaccharide transport or phosphorylation), or cell number. Despite these ambiguities, changes in FdG trapping can be very sensitive and more proximal to the site of drug action. In contrast, diffusion MRI is more distal from the drug, but possibly more connected with ultimate response. Hence, in a clinical setting, it may be used to quantitatively detect and predict outcome in individual patients.
References
- 1.He Z, Evelhoch JL, Mohammad RM, Adsay NV, Pettit GR, Vaitkevicius VK, Sarkar FH. Magnetic resonance imaging to measure therapeutic response using an orthotopic model of human pancreatic cancer. Pancreas. 2000;21:69–76. doi: 10.1097/00006676-200007000-00054. [DOI] [PubMed] [Google Scholar]
- 2.Poptani H, Duvvuri U, Miller CG, Mancuso A, Charagundla S, Frase NW, Glickson JD, Leigh JS, Reddy R. T1rho imaging of murine brain tumors at 4 T. Acad Radiol. 2001;8:42–47. doi: 10.1016/S1076-6332(03)80742-0. [DOI] [PubMed] [Google Scholar]
- 3.Evelhoch JL, Gillies RJ, Karczmar GS, Koutcher JA, Maxwell RJ, Nalcioglu O, Raghunand N, Ronen SM, Ross BD, Swartz HM. Applications of magnetic resonance in model systems: cancer therapeutics. Neoplasia (New York) 2000;2:152–165. doi: 10.1038/sj.neo.7900078. [DOI] [PMC free article] [PubMed] [Google Scholar]
- 4.Aboagye EO, Bhujwalla ZM, He Q, Glickson JD. Evaluation of lactate as a 1H nuclear magnetic resonance spectroscopy index for noninvasive prediction and early detection of tumor response to radiation therapy in EMT6 tumors. Radiat Res. 1998;150:38–42. [PubMed] [Google Scholar]
- 5.Zhao M, Pipe JG, Bonnett J, Evelhoch JL. Early detection of treatment response by diffusion-weighted 1H-NMR spectroscopy in a murine tumor in vivo. Br J Cancer. 1996;73:61–64. doi: 10.1038/bjc.1996.11. [DOI] [PMC free article] [PubMed] [Google Scholar]
- 6.Chenevert TL, McKeever PE, Ross BD. Monitoring early response of experimental brain tumors to therapy using diffusion magnetic resonance imaging. Clin Cancer Reson. 1997;3:1457–1466. [PubMed] [Google Scholar]
- 7.Lamaire L, Howe FA, Rodrigues LM, Griggiths JR. Assessment of induced rat mammary tumour response to chemotherapy using the apparent diffusion coefficient of tissue water as determined by diffusion- weighted 1H-NMR spectroscopy in vivo. Magma. 1999;8(1):20–26. doi: 10.1007/BF02590631. [DOI] [PubMed] [Google Scholar]
- 8.Poptani H, Puumalainen AM, Grohn OH, Loimas S, Kainulainen R, Yla-Herttuala S, Kauppinen RA. Monitoring thymidine kinase and ganciclovir-induced changes in rat malignant glioma in vivo by nuclear magnetic resonance imaging. Cancer Gene Ther. 1998;5:101–109. [PubMed] [Google Scholar]
- 9.Hakumaki JM, Poptani H, Puumalainen AM, Loimas S, Paljarvi LA, Yla-Herttuala S, Kauppinen RA. Quantitative 1H nuclear magnetic resonance diffusion spectroscopy of BT4C rat glioma during thymidine kinase-mediated gene therapy in vivo: identification of apoptotic response. Cancer Res. 1998;58(17):3791–3799. [PubMed] [Google Scholar]
- 10.Geschwind JF, Artemov D, Abraham S, Omdal D, Huncharek MS, McGee C, Arepally A, Lambert D, Venbrux AC, Lund GB. Chemoembolization of liver tumor in a rabbit model: assessment of tumor cell death with diffusion-weighted MR imaging and histologic analysis. J Vasc Interv Radiol. 2000;11:1245–1255. doi: 10.1016/s1051-0443(07)61299-8. [DOI] [PubMed] [Google Scholar]
- 11.Stegman LD, Rehemtulla A, Hamstra DA, Rice DJ, Jonas SJ, Stout KL, Chenevert TL, Ross BD. Diffusion MRI detects events in the response of a glioma model to the yeast cytosine deaminase gene therapy strategy. Gene Ther. 2000;7:1005–1010. doi: 10.1038/sj.gt.3301199. [DOI] [PubMed] [Google Scholar]
- 12.Galons JP, Altbach MI, Paine-Murrieta GD, Taylor CW, Gillies RJ. Early increases in breast tumor xenograft water mobility in response to paclitaxel therapy detected by non-invasive diffusion magnetic resonance imaging. Neoplasia. 1999;1:133–137. doi: 10.1038/sj.neo.7900009. [DOI] [PMC free article] [PubMed] [Google Scholar]
- 13.Jennings D, Hatton N, Trouard T, Galons JP, Guo J, Baggett B, Gillies RJ. Changes in water mobility measured by diffusion MRI predicts the magnitude of response of prostate cancer xenografts to Taxotere chemotherapy. Neoplasia. 2002;4(3):255–260. doi: 10.1038/sj.neo.7900225. [DOI] [PMC free article] [PubMed] [Google Scholar]
- 14.Galons JP, Jennings D, Morse D, Gillies RJ. Mechanisms underlying the increase of ADCw in response to anti-cancer therapy. Isr J Biochem. 2003;43:91–101. [Google Scholar]
- 15.Mardor Y, Roth Y, Lidar Z, Jonas T, Pfeffer R, Maier SE, Faibel M, Nass D, Hadani M, Orenstein A, Cohen JS, Ram Z. Monitoring response to convection-enhanced Taxol delivery in brain tumor patients using diffusion-weighted magnetic resonance imaging. Cancer Res. 2001;61:4971–4973. [PubMed] [Google Scholar]
- 16.Bortner CD, Cidlowski JA. Apoptotic volume decrease and the incredible shrinking cell. Cell Death Differ. 2002;9:1307–1310. doi: 10.1038/sj.cdd.4401126. [DOI] [PubMed] [Google Scholar]
- 17.Chenevert TL, Stegman LD, Taylor JM, Robertson PL, Greenberg HS, Rehemtulla A, Ross BD. Diffusion magnetic resonance imaging: an early surrogate marker of therapeutic efficacy in brain tumors. J Natl Cancer Inst. 2000;92:2029–2036. doi: 10.1093/jnci/92.24.2029. [DOI] [PubMed] [Google Scholar]
- 18.Semelka RC, Worawattanakul S, Kelekis NL, John G, Woosley JT, Graham M, Cance WG. Liver lesion detection, characterization, and effect on patient management: comparison of singlephase spiral CT and current MR techniques. J Magn Reson Imaging. 1997;7:1040–1047. doi: 10.1002/jmri.1880070616. [DOI] [PubMed] [Google Scholar]
- 19.Mahmood U, Devitt ML, Kocheril PG, Sutanto-Ward E, Ballon D, Sigurdson ER, Koutcher JA. Quantitation of total metastatic tumor volume in the rat liver: correlation of MR and histologic measurements. J Magn Reson Imaging. 1992;2:335–340. doi: 10.1002/jmri.1880020314. [DOI] [PubMed] [Google Scholar]
- 20.Pauser S, Wagner S, Lippmann M, Pohlen U, Reszka R, Wolf KJ, Berger G. Evaluation of efficient chemoembolization mixtures by magnetic resonance imaging therapy monitoring: an experimental study on the VX2 tumor in the rabbit liver. Cancer Res. 1996;56:1863–1867. [PubMed] [Google Scholar]
- 21.Qin Y, Van Cauteren M, Osteaux M, Schally AV, Willems G. Inhibitory effect of somatostatin analogue RC-160 on the growth of hepatic metastases of colon cancer in rats: a study with magnetic resonance imaging. Cancer Res. 1992;52:6025–6030. [PubMed] [Google Scholar]
- 22.Outwater E, Tomaszewski JE, Daly JM, Kressel HY. Hepatic colorectal metastases: correlation of MR imaging and pathologic appearance. Radiology. 1991;180:327–332. doi: 10.1148/radiology.180.2.2068294. [DOI] [PubMed] [Google Scholar]
- 23.Noone TC, Semelka RC, Balci NC, Graham ML. Common occurrence of benign liver lesions in patients with newly diagnosed breast cancer investigated by MRI for suspected liver metastases. J Magn Reson Imaging. 1999;10:165–169. doi: 10.1002/(sici)1522-2586(199908)10:2<165::aid-jmri9>3.0.co;2-z. [DOI] [PubMed] [Google Scholar]
- 24.Lee MG, Baker ME, Sostman HD, Spritzer CE, Paine S, Paulson EK, Keogan MT. The diagnostic accuracy/efficacy of MRI in differentiating hepatic hemangiomas from metastatic colorectal/breast carcinoma: a multiple reader ROC analysis using a jackknife technique. J Comput Assist Tomogr. 1996;20:905–913. doi: 10.1097/00004728-199611000-00007. [DOI] [PubMed] [Google Scholar]
- 25.Ito K, Mitchell DG, Outwater EK, Szklaruk J, Sadek AG. Hepatic lesions: discrimination of nonsolid, benign lesions from solid, malignant lesions with heavily T2-weighted fast spin-echo MR imaging. Radiology. 1997;204:729–737. doi: 10.1148/radiology.204.3.9280251. [DOI] [PubMed] [Google Scholar]
- 26.Namimoto T, Yamashita Y, Sumi S, Tang Y, Takahashi M. Focal liver masses: characterization with diffusion-weighted echoplanar MR imaging. Radiology. 1997;204:739–744. doi: 10.1148/radiology.204.3.9280252. [DOI] [PubMed] [Google Scholar]
- 27.Dzik-Jurasz A, Domenig C, George M, Wolber J, Padhani A, Brown G, Doran S. Diffusion MRI for prediction of response of rectal cancer to chemoradiation. Lancet. 2002;360:307–308. doi: 10.1016/S0140-6736(02)09520-X. [DOI] [PubMed] [Google Scholar]


