Abstract
Cellular heterogeneity is a hallmark of human neuroblastoma tumors and cell lines. Within a single neuroblastoma are cells from distinct neural crest lineages whose relative abundance is significant for prognosis. We postulate that a self-renewing multipotent tumor stem cell, which gives rise to diverse cell lineages, is the malignant progenitor of this cancer. To test this hypothesis, we have established 22 cloned, phenotypically homogeneous populations of the three major cell types from 17 neuroblastoma cell lines. In vitro, malignant neuroblastoma stem cells, termed I-type (intermediate type), have distinct morphologic, biochemical, differentiative, and tumorigenic properties. I-type cells express features of both neuroblastic (N) cells (scant cytoplasm, neuritic processes, neurofilaments, pseudoganglia, and granin and neurotransmitter enzyme expression) and substrate-adherent (S) cells (extensive cytoplasm and vimentin and CD44 expression). Moreover, they show bidirectional differentiation to either N or S cells when induced by specific agents. I-type cells are significantly more malignant than N- or S-type cells, with four- to five-fold greater plating efficiencies in soft agar and six-fold higher tumorigenicity in athymic mice. Differences in malignant potential are unrelated to N-myc amplification/ overexpression or the ability to digest and migrate through the extracellular matrix. Immunocytochemical analyses of a small series of tumors reveal that frequency of cells coexpressing N and S cell markers correlates with poor prognosis. Thus, I-type stem cells may be instrumental in the genesis and growth of tumors in the patient. Their unique biology deserves attention and further investigation.
Keywords: Human neuroblastoma, I-type cell, stem cell, tumorigenicity, differentiation
Introduction
Human neuroblastoma, the most commonly diagnosed solid tumor in infants, is a cancer of the neural crest [1–3]. Within a single tumor, many of the cell phenotypes characteristic of this transient embryonic structure, particularly neuroblasts, non-neuronal (Schwann, perineurial, or satellite) cells, and even melanocytes, may be present. It has been shown that cellular heterogeneity and extent of maturation (e.g., stroma-rich and stroma-poor tumors or high-risk and low-risk tumors based on histologic grade) correlate with clinical behavior, and these properties have been used for the classification and prognosis of the disease [4].
This same cellular heterogeneity is manifest in cell lines derived from these tumors. We and others have identified three distinct cellular phenotypic variants frequently present in human neuroblastoma cell lines [5,6]. Most common are sympathoadrenal neuroblasts (N), which grow as poorly attached aggregates of small, rounded cells with short neuritic processes. A second cell type resembles non-neuronal precursor cells, as these large, flattened cells (termed S) attach strongly to the substrate and show contact inhibition of cell growth. A third cell type, termed I because its morphology is intermediate to those of N and S, is a small, flattened, moderately adherent cell, with or without neuritic processes, which forms aggregates in culture. This cell type appears to represent a more primitive stem cell, a progenitor of N- or S-type cells, capable both of selfrenewal and of bidirectional differentiation [7].
The three phenotypic variants present in most human neuroblastoma cell lines display different tumorigenic potentials [8,9]. S-type non-neuronal cells are nonmalignant: they show no or very little anchorage-independent growth in soft agar and do not form tumors in athymic mice. By contrast, N-type cells form slowly growing tumors in 31% to 100% of mice and have higher plating efficiencies in soft agar than S cells. Surprisingly, the two I-type cell lines previously examined, BE(2)-C and SH-IN, had the highest tumor-forming capacities and plating efficiencies of the three phenotypes. However, the small number of I-type sublines precluded any generalizations about the relationship between the stem cell phenotype and malignant potential.
Stem cells are defined as clonogenic cells capable of both self-renewal and multilineage differentiation. Emerging evidence from hematopoietic cancers has suggested that it is the rare cancer stem cell that drives tumor formation and growth [10]. Whereas some of the heterogeneity observed in cancers arises from continuing mutagenesis and epigenetic changes, some may also result from further differentiation of cancer stem cells, with consequent changes in cancer aggressiveness and malignancy. If neuroblastoma is a stem cell cancer, the neuroblasts and stromal cells present in human neuroblastoma tumors may represent divergent populations derived from these tumor stem cells, and the relative abundance of the three cell variants may influence their clinical behavior. Recent studies of neuroblastoma tumors, using cell sorting, short-term culture, and immunocytochemical techniques, are consistent with this hypothesis. Stromal cells were shown to contain identical genetic abnormalities as tumor neuroblasts [11,12] and I-like cells have been shown to be present in tumors [13]. It is clear that the role played by malignant stem cells in neuroblastoma tumor progression and relapse needs further investigation. Additional studies of homogeneous populations of I-like cell lines are essential to understanding the cellular and molecular biology of malignant neuroblastoma stem cells.
In the present study, we have extended our analysis of human neuroblastoma I-type cells to five newly isolated and two partially characterized cell lines [5,7]. We confirm that I-type cells are malignant stem cells, capable of selfrenewal and proliferation as well as further differentiation. More importantly, we show that these cells have the highest malignant potential of the three neuroblastoma cell variants. Finally, preliminary immunocytochemical studies to quantify numbers of presumptive stem cells in tumor sections have revealed a greater frequency of I-like cells in tumors of patients whose disease progressed compared to those with event-free survival. Further identification and characterization of this specific cell type may be pivotal in understanding the basic and clinical biology of this enigmatic cancer.
Materials and Methods
Patients and Samples
Tumor and marrow specimens were obtained from patients as part of their standard of care after informed consent. Research using tumor samples was approved by the Institutional Review Board of Memorial Sloan-Kettering Cancer Center (New York, NY).
Cell Culture and Differentiation
Nine N-type cell lines and clones [SK-N-BE(1)n, BE(2)-M17, LA1-55n, CHP-234, SMS-LHN, SMS-KAN, KCN-69n, SH-SY5Y, and LA-N-6], four I-type cell lines [BE(2)-C, LA-N-2, SH-IN, and CHP-212], and four S-type cell lines [LA1-5s, SMS-KCNs, SK-N-BE(2)s, and SH-EP1] have been described previously [5,8,14,15]. One N-type (SK-N-CH) and four clonal I-type cell lines (SK-N-ER, SK-N-JD, SK-N-HM, and SK-N-LP) were established from patients with recurrent neuroblastoma. CB-JMN is a non-N-myc-amplified I-type cell line isolated from a patient with a stage 3 tumor and was a gift from Dr. C. Patrick Reynolds (Children's Hospital, Los Angeles, CA). Cells are cultured in a 1:1 mixture of Eagle's minimum essential medium (with nonessential amino acids) and Ham's nutrient mixture F12 supplemented with 10% fetal bovine serum (HyClone, Logan, UT). In differentiation studies, I-type neuroblastoma cells were grown for 7 to 14 days in the presence of 1 µM of all-trans retinoic acid (RA) or 10 µM 5-bromo-2′-deoxyuridine (BUdR) or forskolin (FSK), in concentrations determined in earlier experiments to yield optimal differentiation [7,16].
Immunoblot Analysis
Cells in exponential growth phase were lysed by the method of Ikegaki et al. [17] and proteins were separated by standard techniques [18]. Blots were probed with antibodies to chromogranin A (CgA; MAB319), neurofilament protein 68 (NF68; MAB1615), heat shock protein 72/73 (MAB3516), vimentin (VIM; AB1620), and/or actin (MAB1501R), all purchased from Chemicon International (Temecula, CA). N-myc (sc-1452), which also recognizes α-actinin4 (ACTN) [19], and CD44 (sc-7051) were from Santa Cruz Biotechnology, Inc. (Santa Cruz, CA). Tissue plasminogen activator antibody was from ICN Pharmaceuticals (Aurora, OH) whereas Hu antisera were a gift from Dr. M. Rosenfeld (University of Pennsylvania, Philadelphia, PA). Bound antibody was detected by chemiluminescence using secondary antibodies conjugated to horseradish peroxidase. The amount of protein was quantified by densitometry of resulting Kodak XAR films and normalized to the amount of actin or heat shock protein 72/73.
Reverse Transcription Polymerase Chain Reaction (RT-PCR)
Total RNA was extracted from cells in exponential growth phase as previously described [18]. c-kit, CD133, and GAPD expression was detected by a two-step semiquantitative RT-PCR reaction using SuperScript II reverse transcriptase according to the instructions of the manufacturer (Invitrogen, Carlsbad, CA). Primers used for PCR were: c-kit (5′-CGAG-TTGGCCCTAGACTTAGAA-3′ and 5′-GGGGTGCCCAC-TATCCTGGAGTT-3′), CD133 (5′-CCTGTTATGACAAGCC-CATCACAA-3′ and 5′-CGCAGGTTTCTCTATGAT-3′), and GAPD (5′-GTGAAGGTCGGAGTCAACGGATTTGG-3′ and 5′-ATGCCAGTGAGCTTCCCGTTCAGCT-3′). The thermal cycler parameters were: 94°C for 5 minutes; 30 to 42 cycles at 94°C for 30 seconds, 55°C to 57°C for 30 seconds, and 72°C for 1 minutes; and a final extension at 72°C for 7 minutes. Ethidium bromide-stained PCR products were resolved on 1% agarose gels and the amount of mRNA, determined by scanning densitometry of resulting photographs, was normalized to that of GAPD.
Transformation and Tumorigenicity Assays
Procedures to determine anchorage-independent growth in 0.33% Difco Bacto agar have been published [8]. BE(2)-C was included in all experiments as a positive control. Mean colony-forming efficiency (CFE; the number of colonies with >10 cells per cell inoculum x 100) was determined in two to four independent experiments. To determine tumorigenicity, cells in the exponential growth phase were resuspended in 100 µl of medium with or without Matrigel (BD BioSciences, Bedford, MA) and inoculated subcutaneously into female BALB/c nu/nu athymic mice at 2 x 10⁶ or 1 x 10⁷ cells per mouse, respectively. Mice were examined at twice-weekly intervals and tumor volumes were estimated from measurements in two dimensions.
Motility Invasion Assays
In vitro cell invasivity was measured by the method of Albini et al. [20], using Matrigel Invasion Chambers (Becton Dickinson, Bedford, MA), as previously described [21]. Cell invasivity is expressed as the percentage of cells that migrated through the coated membrane compared to uncoated membrane.
Immunocytochemistry
Frozen sections from 15 archival tumors were fixed in 1:1 acetone/methanol at -20°C, permeabilized with 0.5% Triton X-100, and immunostained sequentially with two primary antibodies: S100A6 (calcyclin) and a mixture of neurofilament 68 and 150. Bound antibody was detected chromogenically with biotinylated secondary antibody and the Vectastain Elite ABC kit (Vector Laboratories, Burlingame, CA). Slides of frozen N, S, and/or I cell cultures were included as controls for staining specificity. Results are expressed as percentage of neurofilament-positive cells (N- and I-like cells) that also express S100A6 (I-like cells). Statistical significance was assessed using a one-tailed t-test.
Results
Morphologic Characterization of I-Type Cells
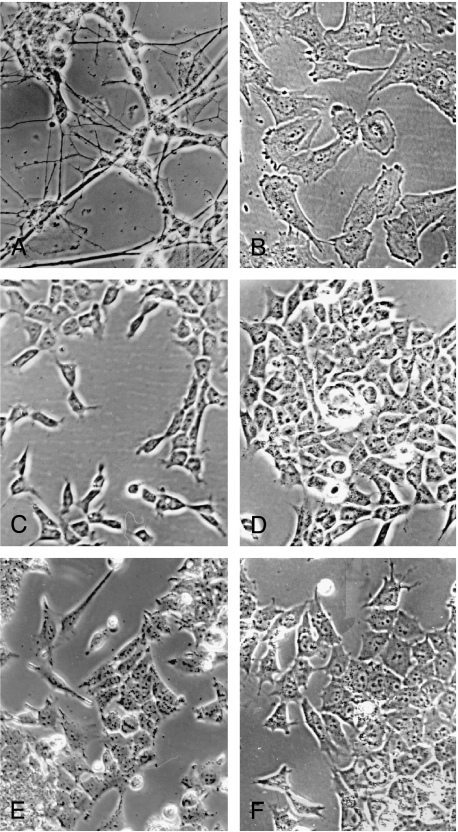
In the present study, we have compared six new human neuroblastoma cell lines or clones (CB-JMN, SK-N-LP, SKN-JD, SK-N-ER, SK-N-CH, and SK-N-HM) with four cell lines reported previously by us as I-type [BE(2)-C, LA-N-2, CHP-212, and SH-IN] as well as N and S cell lines. Five morphologic criteria were used to distinguish the three cell line variants from each other: 1) degree of substrate attachment; 2) nuclear/cytoplasmic ratio; 3) cell shape and polarity; 4) number and extent of neuritic processes; and 5) degree of cell aggregation. As illustrated in Figure 1, C–F, I-type cell lines typically display the following features that collectively can be used to distinguish them from either N or S cells: 1) they have small flattened cell bodies with prominent nuclei and moderate amounts of cytoplasm, compared to N-type cells with scant cytoplasm (Figure 1A) and flattened S cells with abundant cytoplasm (Figure 1B); 2) unlike S cells, which attach strongly to the underlying substrate and do not mound, or N cells, which attach weakly and form pseudoganglia, I cells adhere to both the substrate and each other, forming mounding, contiguous layers of cells; 3) I-type cells appear more radially symmetric, whereas N and S cells most often show cellular polarity (i.e., one axis is greater than the other); and 4) whereas N cells have numerous, small distinct neuritic processes and S cells often have large flat lamellipodia, I-type cells may or may not have neuritic processes that, when present, are short and few in number. Using these criteria, one line (SK-N-CH) is N-type and the remaining five lines are all I-like.
Figure 1.
Phase contrast photomicrographs of human neuroblastoma cell lines of the three different phenotypes, all at x135 magnification. (A) N-type SK-N-CH; (B) S-type SH-EP1; and I-types (C) SK-N-JD, (D) SK-N-LP, (E) SK-N-HM, and (F) SK-N-ER.
Biochemical Confirmation of I-Type Cells as Stem Cells
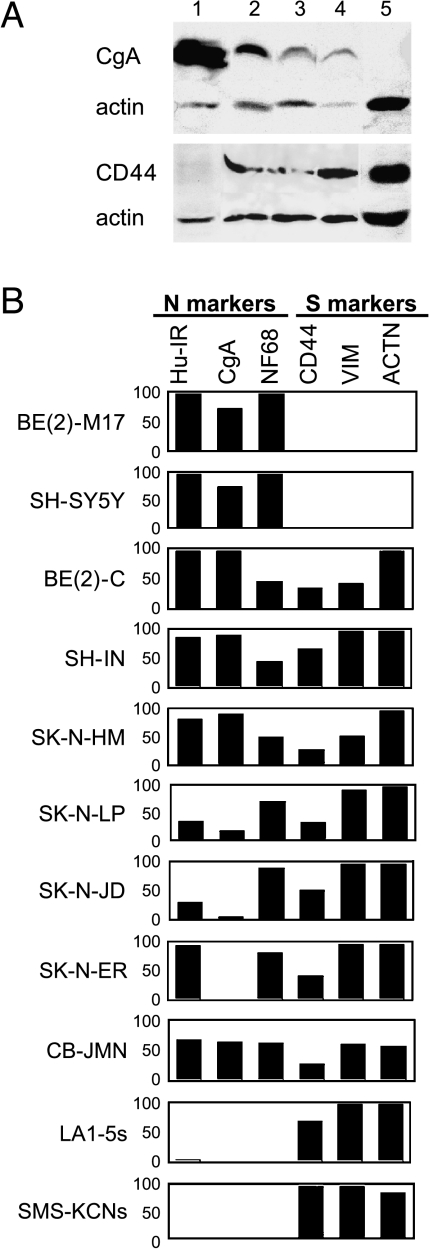
To assess the biochemical properties of the five I-like cell lines and confirm their I-type cell phenotype [7], the presence and amounts of six phenotype-specific marker proteins were examined by Western blot analysis. Numerous neuronal-specific proteins found in N-type BE(2)-M17 and SH-SY5Y cells, but not in S cells, include CgA, all three neurofilament proteins (NF68, NF150, and NF200), and the neuronal-specific RNA-binding protein Hu (Hu-IR) (Refs. [5,6,8]; data not shown). Marker proteins distinguishing S-type LA1-5s and SMS-KCNs cells from N cells include CD44, a cell surface receptor protein involved in cell/matrix interactions, the intermediate filament VIM, the actin-binding protein ACTN, and the nuclear S100A6 (calcyclin) protein (Refs. [5,6,19]; data not shown). We had previously shown that homogeneous clones or populations of I cells express both N and S marker proteins [7]. As illustrated in Figure 2A and summarized in Figure 2B, all of the I-type cell lines and clones express marker proteins of both N and S cell types. Thus, the biochemical profiles of the five new cell lines are consistent with their identification as I cells.
Figure 2.
(A) Western blot analysis of N, I, and S cell lines stained for CgA, CD44, and actin. Lane, line, phenotype: (1) BE(2)-M17, N; (2) SK-N-JD, I; (3) SK-N-LP, I; (4) BE(2)-C, I; and (5) SH-EP1, S. (B) Bar graph showing relative expression of three N marker proteins [neuronal-specific RNA-binding protein Hu (Hu-IR), CgA, and neurofilament 68 (NF68)] and three S marker proteins (CD44, VIM, and ACTN) in phenotypically homogeneous populations of two N-type [BE(2)-M17 and SH-SY5Y], seven I-type [BE(2)-C, SH-IN, SK-N-HM, SK-N-LP, SK-N-JD, SK-N-ER, and CB-JMN], and two S-type [LA1-5s and SMS-KCNs] cell lines. Bar height represents the amount of protein (relative to actin) as a percentage ofmaximumamount of protein present in any of the lines.
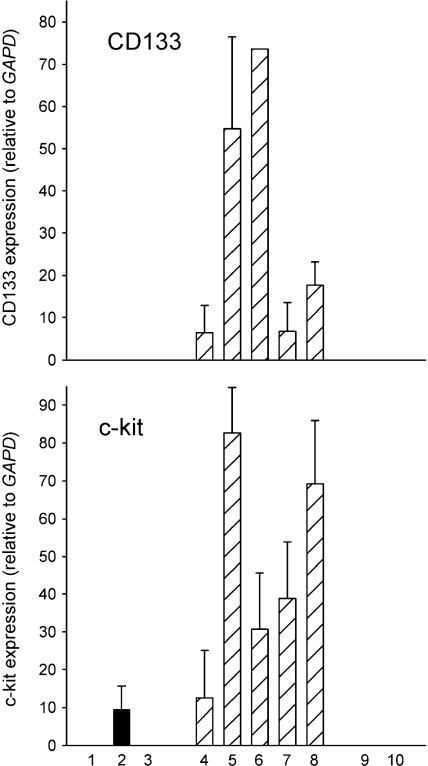
As further evidence that these I cells are stem cells, we measured steady-state RNA levels for two proteins expressed by stem cells, CD133 and c-kit (CD117), in our series of phenotypic variants. Both cell surface antigens are present in hematopoietic stem cells [22]. Moreover, CD133 is expressed on all fetal human neural stem cells [23,24], whereas c-kit expression appears to be restricted to a subpopulation of neural crest stem cells [25]. As shown in Figure 3, although N and S cell variants show little or no expression, I-type cells have abundant mRNA for both proteins.
Figure 3.
RT-PCR analysis of relative expression levels ± SEM of CD133 and c-kit in three N-type (■), five I-type ( ), and two S-type (□) human neuroblastoma cell lines. Each bar represents the average of one to five separate determinations. Lane, line: (1) KCN-69n; (2) LA1-55n; (3) BE(2)-M17; (4) BE(2)-C; (5) SK-N-LP; (6) LAN-2; (7) CB-JMN; (8) SK-N-ER; (9) SH-EP1, and (10) LA1-5s.
Differentiation Induction
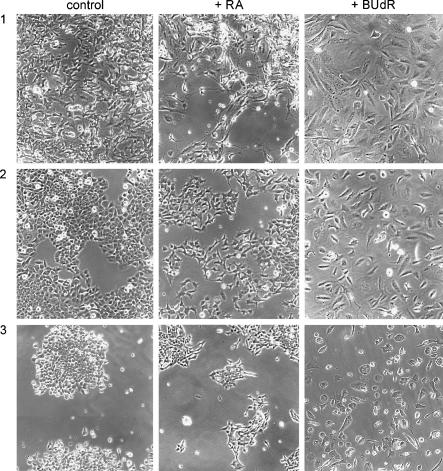
A distinctive feature of I-type neuroblastoma stem cells is their ability to differentiate bidirectionally into N and S cell types. Our previous studies of BE(2)-C and SH-IN showed that, in response to differentiation-inducing agents (e.g., FSK, RA, or BUdR), the majority of cells either converts to a neuroblastic phenotype or becomes S-like [7]. The new I-type cell lines were tested for their ability to show bidirectional differentiation. As illustrated in part in Figure 4, treatment with RA induced a neuroblastic phenotype (formation of pseudoganglia and neurites), whereas BUdR induced an S cell phenotype (cell flattening and contact inhibition) in the five new I-type cell lines and LA-N-2, as well as in BE(2)-C. In two other lines (SH-IN and CHP-212), RA and BUdR both cause S-type cell differentiation, whereas FSK induces a neuroblastic phenotype. Morphologic changes were confirmed immunochemically by analysis of the N cell marker proteins, Hu and CgA, and the S cell marker, VIM (data not shown). Thus, I cells represent a unique cell phenotype characterized by a distinct morphology, biochemistry, and differentiation potential.
Figure 4.
Effects of 1 µM RA and 10 µM BUdR on the cell phenotype of: (1) BE(2)-C; (2) SK-N-ER; and (3) SK-N-HM I-type cells. Note that whereas RA induces a neuroblastic (N) phenotype, BUdR induces an S cell phenotype.
N-myc Protein Expression
N-myc expression has previously been shown to correlate with the expression of a neuroblastic phenotype in human neuroblastoma cells [8,26,27]; S-type cells express little or no oncoprotein [8]. Therefore, we determined levels of N-myc protein in N and I cell variants from both N-myc-amplified and nonamplified cell lines (Table 1). Whereas mean N-myc protein levels are 64-fold higher in N-myc-amplified lines compared to nonamplified lines, they do not differ significantly between N- and I-type cells within either group.
Table 1.
Cell Phenotype, N-myc Amplification Status, and N-myc Protein Levels in 15 Human Neuroblastoma Cell Lines.
| Cell Line/Clone | Phenotype* | NMA† | Amount of N-myc | |
| Protein‡ | Mean ± SEM (n) | |||
| SK-N-BE(1)n | N | + | 128.7 ± 17.6 | |
| BE(2)-M17 | N | + | 149.6 ± 13.6 | |
| LA1-55n | N | + | 155.9 ± 6.2 | 134.9 ± 9.0(5) |
| CHP-234 | N | + | 108.4 ± 15.5 | |
| SMS-KAN | N | + | 132.1 ± 11.6 | |
| LA-N-2 | I | + | 111.7 ± 12.4 | |
| SK-N-LP | I | + | 121.9 ± 10.5 | |
| SK-N-JD | I | + | 78.4 ± 13.8 | 111.0 ± 9.8(5)ns |
| SK-N-HM | I | + | 106.0 ± 12.5 | |
| CHP-212 | I | + | 137.2 ± 13.5 | |
| SMS-LHN | N | - | 1.0 ± 0.5 | |
| SH-SY5Y | N | - | 2.1 ± 0.7 | 1.4 ± 0.4(3) |
| LA-N-6 | N | - | 0.9 ± 0.6 | |
| CB-JMN | I | - | 3.0 ± 1.1 | 2.4 ± 0.6(2)ns |
| SK-N-ER | I | - | 1.6 ± 0.8 | |
N, neuroblastic; I, stem cell.
NMA, N-myc amplification status: (+) amplified; (-) nonamplified.
Amount of N-myc protein, relative to actin, expressed as mean ± SEM of three to five separate cultures. ns, not significantly different from N-type group.
Anchorage-Independent Growth Potential and Tumorigenicity of I-Type Stem Cells
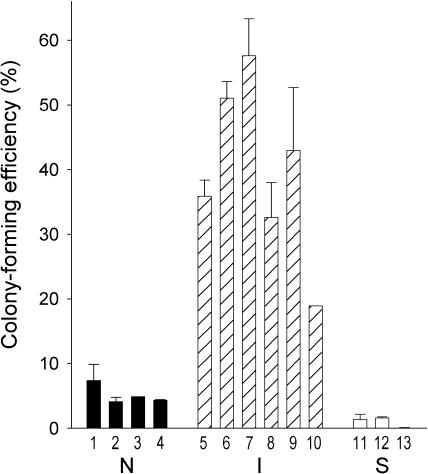
Our previous studies of 21 different human neuroblastoma cell lines or clonal variants showed that cell phenotype has a dramatic influence on malignant potential [8]. Although N-type cells are tumorigenic, forming colonies in soft agar and/or tumors in athymic mice, S-type cells, even at very high inocula, do not form colonies or tumors. Interestingly, two clonal stem cell lines, BE(2)-C and SH-IN, appeared more malignant than either their N or their S cell counterparts. Therefore, to determine whether the cancer stem cell is inherently more malignant than N- or S-type cells, we compared CFE in soft agar for six I-type, four N-type, and three S-type clones. As shown in Figure 5, CFEs of S-type lines range from 0.01% to 1.6%, whereas those of the N-type lines range from 2.9% to 7.4%. By contrast, I-type lines have CFEs that range from 18.9% to 57.6%, significantly (four- to five-fold) greater than N-type cells (P < .001). It is clear that phenotype, not level of N-myc protein, determines malignant potential. For example, I-type cell lines CB-JMN and SK-N-ER (Figure 5, lanes 6 and 7), which do not amplify the oncogene and express low levels of the oncoprotein, have five- to six-fold higher plating efficiencies than N-types BE(2)-M17 and SMS-KAN (lanes 1 and 2), which amplify the N-myc gene 130- to 150-fold, respectively [8,14] and contain high levels of the oncoprotein.
Figure 5.
Colony-forming efficiencies ± SEM in soft agar for four N-type (■), six I-type ( ), and three S-type (□) cell lines. Lane, line: (1) BE(2)-M17; (2) SMS-KAN; (3) KCN-69n; (4) SH-SY5Y; (5) BE(2)-C; (6) CB-JMN; (7) SK-NER; (8) SK-N-JD; (9) SK-N-LP; (10) SH-IN; (11) SK-N-BE(2)s; (12) LA1-5s; and (13) SH-EP1.
As a second method to determine the malignant potential of human neuroblastoma phenotypic variants, we injected cells from seven I-type cell lines [BE(2)-C, SK-N-HM, CBJMN, SH-IN, SK-N-ER, SK-N-JD, and SK-N-LP] and five Ntype cell line [BE(2)-M17, SK-N-BE(1)n, LA1-55n, SK-N-CH, and SH-SY5Y) into athymic mice and determined their relative tumorigenicity (i.e., the ability to form tumors attaining a volume of >300 mm3 in 1 month). Experiments done using inocula of 107 cells suspended in medium or 2 x 10⁶ cells in Matrigel yielded the same results. Compared to the N-type lines, which formed tumors in only 12% of the 26 mice injected, I-type cells grew rapidly and formed tumors in nearly 78% of 59 mice injected (Table 2). Moreover, as seen in Table 2, tumorigenicity is correlated with cell phenotype, not N-myc status. Thus, another distinctive feature of neuroblastoma stem cells is their enhanced malignant potential.
Table 2.
Tumorigenicity in Athymic Mice of N and I Cell Lines.
| Cell Line/Clone | NMA* | Tumor Frequency† | (%)‡ |
| N-type cells | |||
| BE(2)-M17 | + | 0/3 | |
| SK-N-BE(1)n | + | 1/5 | |
| LA1-55n | + | 1/5 | |
| SK-N-CH | 0/4 | ||
| SH-SY5Y | - | 2/9 | |
| Total | 4/26 | 12.4 ± 0.1 | |
| I-type cells | |||
| BE(2)-C | + | 13/16 | |
| SK-N-HM | + | 6/8 | |
| CB-JMN | - | 2/3 | |
| SH-IN | - | 5/5 | |
| SK-N-ER | - | 5/9 | |
| SK-N-JD | + | 8/9 | |
| SK-N-LP | + | 7/9 | |
| Total | 46/59 | 77.9 ± 0.1%§ | |
NMA, N-myc amplification status: (+) amplified; (-) nonamplified.
Number of mice with tumor volumes of >300 mm3 after 1 month/number of mice injected.
Percentage ± SEM of mice with tumors.
P < 0.001 compared to N-type cells.
Cellular Invasivity and ECM Digestion
Because neural crest stem cells are highly migratory, cell phenotype might influence metastasis. Thus, we assessed the ability of phenotypic variants to digest and migrate through the extracellular matrix (ECM) in Matrigel invasion assays [20]. There are no phenotype-specific differences in these properties; approximately 75% of cells with each phenotype digested and migrated through the ECM. Likewise, levels of tissue plasminogen activator, a metalloprotease involved in ECM digestion, do not differ among the three phenotypes (data not shown).
Double-Label Immunocytochemistry of Neuroblastoma Tumors
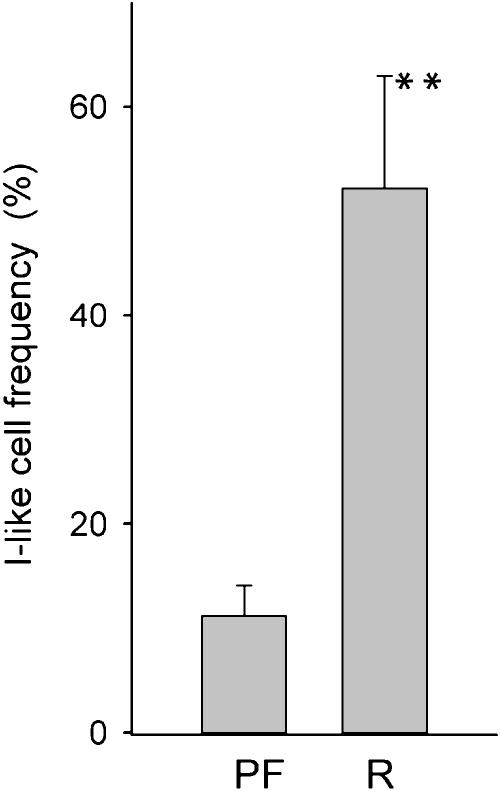
Because malignant stem cells are present in many neuroblastoma cell lines and are the most malignant cell type, we hypothesized that similar cells should be present in tumors, especially in those with the worst prognosis. Thus, as a preliminary study, we analyzed 15 tumors by immunocytochemistry to determine whether: 1) I-like cells can be detected in human neuroblastoma tumors, and 2) their frequency correlates with disease progression. Frozen sections from 10 tumors from patients who were progressionfree and five from patients in which the tumor relapsed were immunostained sequentially with antibodies specific to S- and N-type cell antigens localized to different cellular compartments. For example, in phenotypically homogeneous cell cultures, the S cell marker protein, S100A6 (calcyclin), localizes to nuclei of S and I cells, but not N cells, whereas the N cell marker (neurofilaments) is abundant in the cytoplasm only of neuronally differentiated N and I cells (data not shown). In tumors, neuroblasts stain for neurofilaments only, stromal (and endothelial) cells for S100A6 only, and I-like cells for both proteins. I-like cell frequency [the number of doubly labeled cells (I) expressed as a percentage of all tumor cells that express neurofilament proteins (N and I)] was determined microscopically. Putative cancer stem cells could be detected in all tumors and in all stages, with frequencies ranging from <1% (i.e., almost all tumor cells were neuroblastic) up to 90% (i.e., most tumor cells appear to have a stem cell phenotype). Most interesting—although this is a preliminary study, with only a small number of tumors—, there is a strong correlation between recurrence and I-like cell frequency. As shown in Figure 6, the frequency of I cells in tumors of patients who relapsed (52.2 ± 10.8%) was 4.7-fold higher than that in tumors of patients who were progression-free (11.2 ± 2.9%) (P > .001). These data suggest that in the patient, as well as in the cell culture model, cancer stem cells may play a significant role in the genesis and/or relapse of neuroblastoma.
Figure 6.
Frequency ± SEM of I-like cells in human neuroblastoma tumor sections of patients who were progression-free (PF) (n = 10) or who relapsed with disease (R) (n = 5). **P < .001.
Discussion
Our previous studies of human neuroblastoma have focused on the cellular heterogeneity present in cell lines in an attempt to better understand the nature of this cancer and to develop methods for its more effective treatment. Toward this goal, we have identified and characterized three different cell types commonly present in many primary human neuroblastoma cell lines: a neuroblastic (N-type) cell that resembles a sympathoadrenal precursor cell, a substrate-adherent (S-type) non-neuronal cell representing the glial/melanoblastic precursor cell, and an intermediate (I-type) stem cell from which the first two may arise [5–7]. More recently, these same three cell types have been demonstrated to occur in human neuroblastoma tumors as well: 1) Valent et al. [11] isolated both N- and S-type cells from bone marrow aspirates grown in short-term culture; 2) using laser capture microdissection, Mora et al. [12] showed that the stromal component of stage 4 tumors shares a common origin with the neuroblastic component; and 3) we have detected I-like cells in all human neuroblastoma tumors by immunocytochemistry. Thus, these human neuroblastoma cell line variants are not in vitro cultural artifacts, but are most likely representative of the heterogeneous in vivo cell types comprising this tumor.
Our studies of malignant potential in human neuroblastoma cell lines [8] had suggested that I-type cells might be the most tumorigenic of the three cell types commonly present in cell lines. The present study confirms and extends those findings to show that neuroblastoma stem cells as a group are the most transformed, with higher colony-forming capacities and greater growth potentials in athymic mice than either N-type or S-type cells. Moreover, we show that it is the malignant stem cell phenotype, not N-myc amplification status or level of expression, which defines the malignant potential of the neuroblastoma cell variants.
These cell culture results may have important implications for understanding the genesis and response of tumors in the patient. The intriguing, but preliminary, finding from our immunocytochemical studies of 15 tumors, that the relative abundance of putative stem cells correlates with poor prognosis, suggests that neuroblastoma is indeed a stem cell cancer. Analyses of additional tumors are currently underway. Further elucidation of the properties of malignant neuroblastoma stem cells both in vitro and in vivo may be crucial for development of effective therapies for neuroblastoma.
Abbreviations
- ACTN
α-actinin4
- BUdR
5-bromo-2′-deoxyuridine
- CFE
colony-forming efficiency
- CgA
chromogranin A
- ECM
extracellular matrix
- FSK
forskolin
- Hu-IR
Hu protein immunoreactivity
- NF
neurofilament protein
- RA
all-trans retinoic acid
- VIM
vimentin
Footnotes
This research was supported by the NCI, National Institutes of Health Grant CA 77593, and the GRATIS Fund (to R.A.R) and the Hope Street Kids (to N.K.V.C).
References
- 1.Castleberry RP. Biology and treatment of neuroblastoma. Pediatr Clin North Am. 1997;44:919–937. doi: 10.1016/s0031-3955(05)70537-x. [DOI] [PubMed] [Google Scholar]
- 2.Matthay KK. Neuroblastoma: biology and therapy. Oncology. 1997;11:1857–1866. [PubMed] [Google Scholar]
- 3.Brodeur GM. Neuroblastoma: biological insights into a clinical enigma. Nat Rev Cancer. 2003;3:203–216. doi: 10.1038/nrc1014. [DOI] [PubMed] [Google Scholar]
- 4.Shimada H, Umehara S, Monobe Y, Hachitanda Y, Nakagawa A, Goto S, Gerbing RB, Stram DO, Lukens JN, Matthay KK. International neuroblastoma pathology classification for prognostic evaluation of patients with peripheral neuroblastic tumors. Cancer. 2001;92:2451–2461. doi: 10.1002/1097-0142(20011101)92:9<2451::aid-cncr1595>3.0.co;2-s. [DOI] [PubMed] [Google Scholar]
- 5.Rettig WJ, Spengler BA, Garin Chesa P, Old LJ, Biedler JL. Coordinate changes in neuronal phenotype and surface antigen expression in human neuroblastoma cell variants. Cancer Res. 1987;47:1383–1389. [PubMed] [Google Scholar]
- 6.Ciccarone V, Spengler BA, Meyers MB, Biedler JL, Ross RA. Phenotypic diversification in human neuroblastoma cells: expression of distinct neural crest lineages. Cancer Res. 1989;49:219–225. [PubMed] [Google Scholar]
- 7.Ross RA, Spengler BA, Domènech C, Porubcin M, Rettig WJ, Biedler JL. Human neuroblastoma I-type cells are malignant neural crest stem cells. Cell Growth Differ. 1995;6:449–456. [PubMed] [Google Scholar]
- 8.Spengler BA, Lazarova DL, Ross RA, Biedler JL. Cell lineage and differentiation state are primary determinants of MYCN gene expression and malignant potential in human neuroblastoma cells. Oncol Res. 1997;9:467–476. [PubMed] [Google Scholar]
- 9.Ross RA, Biedler JL, Spengler BA. A role for distinct cell types in determining malignancy in human neuroblastoma cell lines and tumors. Cancer Lett. 2003;197:35–39. doi: 10.1016/s0304-3835(03)00079-x. [DOI] [PubMed] [Google Scholar]
- 10.Reya T, Morrison SJ, Clarke MF, Weissman IL. Stem cells, cancer, and cancer stem cells. Nature. 2001;414:105–111. doi: 10.1038/35102167. [DOI] [PubMed] [Google Scholar]
- 11.Valent A, Bénard J, Vénuat A-M, DaSilva J, Duverger A, Duarte N, Hartmann O, Spengler BA, Bernheim A. Phenotypic and genotypic diversity of human neuroblastoma studies in three IGR cell line models derived from bone marrow metastases. Cancer Genet Cytogenet. 1999;112:124–129. doi: 10.1016/s0165-4608(98)00264-7. [DOI] [PubMed] [Google Scholar]
- 12.Mora J, Cheung N-KV, Juan G, Illei P, Cheung I, Akram M, Chi S, Ladanyi M, Cordon-Cardo C, Gerald WL. Neuroblastic and Schwannian stroma cells of neuroblastoma are derived from a tumoral progenitor cell. Cancer Res. 2001;61:6892–6898. [PubMed] [Google Scholar]
- 13.Spengler BA, Walton JD, Biedler JL, Mora J, Gerald WL, Cheung N-KV, Ross RA. Highly malignant human neuroblastoma I-type stem cells are components of human neuroblastoma tumors as well as cell lines. Proc Am Assoc Cancer Res. 2002;43:1014. [Google Scholar]
- 14.Reynolds CP, Tomayko MM, Donner L, Helson L, Seeger RC, Triche TJ, Brodeur GM. Biological classification of cell lines derived from human extracranial neural tumors. In: Evans AE, D'Angio GJ, Knudson AG, Seeger RC, editors. Advances in Neuroblastoma Research. Vol. 2. New York, NY: Alan R. Liss, Inc.; 1988. pp. 291–306. [PubMed] [Google Scholar]
- 15.Wada RK, Seeger RC, Brodeur GM, Einhorn PA, Rayner SA, Tomayko MM, Reynolds CP. Human neuroblastoma cell lines that express N-myc without gene amplification. Cancer. 1993;72:3346–3354. doi: 10.1002/1097-0142(19931201)72:11<3346::aid-cncr2820721134>3.0.co;2-e. [DOI] [PubMed] [Google Scholar]
- 16.Spengler BA, Domènech C, Porubcin M, Biedler JL. Human neuroblastoma lines respond differently to diverse differentiation-inducing agents. In: Evans AE, Brodeur G, Biedler JL, Nakagawara A, editors. Advances in Neuroblastoma Research. Vol. 4. New York, NY: Wiley-Liss; 1994. pp. 261–268. [PubMed] [Google Scholar]
- 17.Ikegaki N, Bukovsky J, Kennett RH. Identification and characterization of the NMYC gene product in human neuroblastoma cells by monoclonal antibodies with defined specificities. Proc Natl Acad Sci USA. 1986;83:5929–5933. doi: 10.1073/pnas.83.16.5929. [DOI] [PMC free article] [PubMed] [Google Scholar]
- 18.Lazarova DL, Spengler BA, Biedler JL, Ross RA. HuD, a neuronal-specific RNA-binding protein, is a putative regulator of N-myc pre-mRNA processing/stability in malignant human neuroblasts. Oncogene. 1999;18:2703–2710. doi: 10.1038/sj.onc.1202621. [DOI] [PubMed] [Google Scholar]
- 19.Nikolopoulos SN, Spengler BA, Kisselbach K, Evans AE, Biedler JL, Ross RA. The human non-muscle α-actinin protein encoded by the ACTN4 gene suppresses tumorigenicity of human neuroblastoma cells. Oncogene. 2000;19:380–386. doi: 10.1038/sj.onc.1203310. [DOI] [PubMed] [Google Scholar]
- 20.Albini A, Iwamoto Y, Kleinman HK, Martin GR, Aaronson SA, Kozlowski JM, McEwan RN. A rapid in vitro assay for quantitating the invasive potential of tumor cells. Cancer Res. 1987;47:3239–3245. [PubMed] [Google Scholar]
- 21.Thomas SK, Messam CA, Spengler BA, Biedler JL, Ross RA. Nestin is a potential mediator of malignancy in human neuroblastoma cells. J Biol Chem. 2003;279:27994–27999. doi: 10.1074/jbc.M312663200. [DOI] [PubMed] [Google Scholar]
- 22.Wognum AW, Eaves AC, Thomas TE. Identification and isolation of hematopoietic stem cells. Arch Med Res. 2003;34:461–475. doi: 10.1016/j.arcmed.2003.09.008. [DOI] [PubMed] [Google Scholar]
- 23.Luo R, Gao J, Wehrle-Haller B, Henion PD. Molecular identification of distinct neurogenic and melanogenic neural crest sublineages. Development. 2003;130:321–330. doi: 10.1242/dev.00213. [DOI] [PubMed] [Google Scholar]
- 24.Uchida N, Buck DW, He D, Reitsma MJ, Masek M, Phan TV, Tsukamoto AS, Gage FH, Weissman IL. Direct isolation of human central nervous system stem cells. Proc Natl Acad Sci USA. 2000;97:14720–14725. doi: 10.1073/pnas.97.26.14720. [DOI] [PMC free article] [PubMed] [Google Scholar]
- 25.Hemmati HD, Nakano I, Lazareff JA, Masterman-Smith M, Geschwind DH, Bronner-Fraser M, Kornblum HI. Cancerous stem cells can arise from pediatric brain tumors. Proc Natl Acad Sci USA. 2003;100:15178–15183. doi: 10.1073/pnas.2036535100. [DOI] [PMC free article] [PubMed] [Google Scholar]
- 26.Whitesell L, Rosolen A, Neckers LM. Episome-generated N-myc antisense RNA restricts the differentiation potential of primitive neuroectodermal cell lines. Mol Cell Biol. 1991;11:1360–1371. doi: 10.1128/mcb.11.3.1360. [DOI] [PMC free article] [PubMed] [Google Scholar]
- 27.Lutz W, Stohr M, Schurmann J, Wenzel A, Lohr A, Schwab M. Conditional expression of N-myc in human neuroblastoma cells increases expression of alpha-prothymosin and ornithine decarboxylase and accelerates progression into S-phase early after mitogenic stimulation of quiescent cells. Oncogene. 1996;13:803–812. [PubMed] [Google Scholar]


