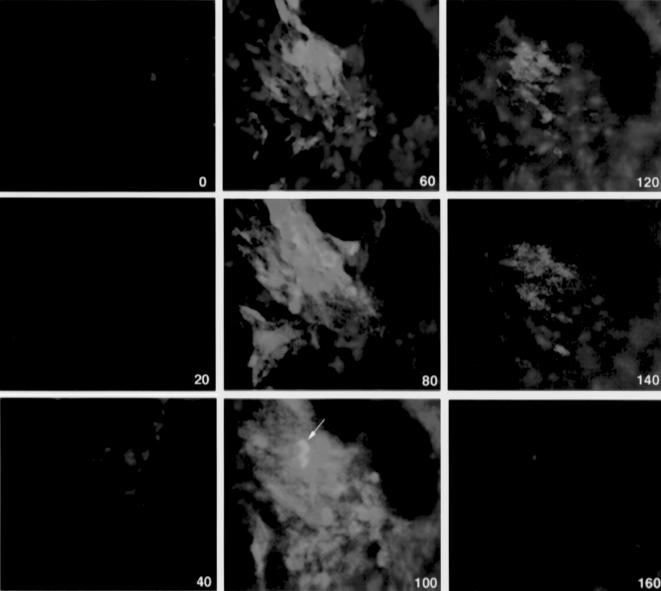
Figure 3.
Confocal in vivo microscopy of 9L-GFP tumor after PGC-Cy5.5 intravenous injection. The images are superimposed GFP fluorescence (green, two-photon mode excitation) and Cy5.5 NIRF (red, single-photon excitation). The images were acquired at the different depths (0–160 µm from the skin surface) shown in the lower right corner. The arrow points to GFP-positive cells showing a strong Cy5.5 NIRF signal (yellow on superimposed image, 100 µm).

