

Abstract
Dedicated high-resolution small animal imaging systems have recently emerged as important new tools for cancer research. These new imaging systems permit researchers to noninvasively screen animals for mutations or pathologies and to monitor disease progression and response to therapy. One imaging modality, X-ray microcomputed tomography (microCT) shows promise as a cost-effective means for detecting and characterizing soft-tissue structures, skeletal abnormalities, and tumors in live animals. MicroCT systems provide high-resolution images (typically 50 microns or less), rapid data acquisition (typically 5 to 30 minutes), excellent sensitivity to skeletal tissue and good sensitivity to soft tissue, particularly when contrast-enhancing media are employed. The development of microCT technology for small animal imaging is reviewed, and key considerations for designing small animal microCT imaging protocols are summarized. Recent studies on mouse prostate, lung and bone tumor models are overviewed.
Keywords: microCT, X-ray, microtomography, animal model
Introduction
Since the introduction of computer-based tomographic imaging nearly 30 years ago, advanced diagnostic imaging technologies have revolutionized the practice of medicine. X-ray computed tomography (CT) [1,2] and magnetic resonance imaging [3] studies are routinely performed to assay patient anatomy whereas single photon emission tomography [4] and positron emission tomography [5] provide functional maps of metabolic processes. These new technologies have become common tools of the clinical arsenal and have touched virtually every aspect of modern medicine.
In recent years, high-resolution tomographic imaging has become useful for small animal studies in the basic biomedical sciences. Magnetic resonance microscopy (MRM) has emerged as an important technology for in vivo anatomic studies of soft tissue structure [6,7] whereas micro-positron emission tomography [8–10] and high Resolution single photon emission tomography systems with pinhole [11] and parallel-hole [12] collimators have found use in functional brain imaging and gene expression studies.
High-resolution X-ray computed tomography (microCT) systems have also been used in small animal studies. MicroCT systems have been used primarily for bone imaging studies due to the high contrast between calcified and soft tissue, but they have also been shown to be effective for soft-tissue imaging, particularly when a contrast medium is employed. Because of the relatively low cost of X-ray imaging, microCT may emerge as a cost-effective alternative to MRM for a number of research applications. In this review, the state of the art in microCT imaging is summarized and recent studies of bone and soft-tissue tumor models are described.
Background
The typical configuration of early small animal CT systems is shown schematically in Figure 1. The subject is placed on a rotating stage between an X-ray (or in some cases γ-ray) source and a detector. The image spatial resolution is primarily determined by the X-ray source focal spot size, the detector element size and the system geometry whereas the contrast resolution is principally set by the X-ray flux and detector element size. In the early 1980s the available X-ray detector elements were too large to provide the resolution required to image rodents so some early investigators [13] replaced the detector block with a translating X-ray film cassette. The X-ray film was subsequently processed and digitized, providing data sets with sufficient resolution (∼150 microns) to reconstruct useful images of small animal organs. By 1984 high-resolution X-ray detector technology had improved, and Burstein et al. [14] reported a ∼50-µm resolution image of a mouse thorax obtained using a 90-kVp X-ray source and a 512-element linear array of X-ray detectors. During this period, conventional CT systems were also employed to simultaneously image multiple mice [15] with relatively low resolution (>800 µm) but very high throughput (eight mice at a time, 9.6 seconds per image).
Figure 1.

Schematic diagram of a typical microCT system with fixed source and detector and rotating stage.
In 1987 Flannery et al. brought X-ray microtomography into a new era with the introduction of a three-dimensional imaging system using a two-dimensional detector consisting of a phosphor plate optically coupled to a charge-coupled detector (CCD) array [16,17]. To acquire a large number of X-ray photons in each micro-pixel (∼2.5 µmx2.5 µm) these investigators employed a synchrotron X-ray source beam line in place of the conventional X-ray tube. During this time the Ford Motor Company Research Laboratories also developed a three-dimensional microtomography system for industrial applications using a laboratory X-ray tube for the source and an image intensifier screen coupled to a video readout. As a part of this effort the scanner was used to study the subchondral bone architecture in guinea pigs with osteoarthritis [18], human cancellous bone [19], and trabecular bone structure [20]. A fundamental contribution of the Ford group was the development of a new three-dimensional “cone-beam” image reconstruction algorithm, which remains one of the most widely used volumetric reconstruction algorithms [21].
In the 1990s a number of groups [22–35] have developed microtomography systems for high-resolution specimen analysis. Most of these systems employ CCD-based detector arrays, micro-focus X-ray tubes, and have reconstructed image resolutions between 20 and 100 microns. The majority of the studies performed using these instruments focused on high-density tissue such as bone or teeth for which magnetic resonance imaging is less successful.
For in vivo small animal studies, particularly large population studies, the scanner configuration shown in Figure 1 can be cumbersome because the subject must be confined in a rotating carrier designed to prevent soft-tissue organ motion. Recently, dedicated small animal microCT scanners have been developed in which the detector and X-ray source rotate about a fixed “patient bed” [36,37], much like clinical CT systems. Both scanners employ conventional X-ray generators but use different configurations. One of the systems [36] acquires relatively high-speed sequential single-slice images using an array of twelve semiconductor detectors, whereas the other [37] acquires volumetric images using a 1024x1024 element CCD detector array.
Image Acquisition Hardware Considerations
A number of issues must be considered when designing or specifying a microCT system, including the scanner geometry, the X-ray source and the detector. These topics are summarized below.
Scanner Geometry
A projection X-ray imaging system is shown schematically in Figure 2. To first order, the image resolution is determined by the X-ray source focal spot size, the detector array resolution and the subject position with respect to the source and detector. If the detector array resolution is limited by the pixel spacing, xd, the projection image blurring due to the finite pixel spacing may be modeled as a Gaussian function with standard deviation
Figure 2.

Schematic diagram of a typical early microCT source/detector configuration.
| 1 |
where dxs is the source-to-subject spacing and dsd is the subject-to-detector spacing. Note that the effective detector resolution is improved by placing the subject closer to the X-ray source to magnify the image cast on the detector face. Of course, for finite-area detector arrays the image magnification reduces the imaging system field-of-view. The choice of magnification factor is typically a trade-off between the desired resolution and the requirement that the object under test must lie entirely within the field of view.
Similarly, if the X-ray focal spot size is specified as a full-width-half-maximum dimension, xf,FWHM, the projection image blurring due to the nonzero X-ray focal spot size may also be modeled as a Gaussian function with standard deviation
| 2 |
Note that placing the subject closer to the detector reduces the blurring due to the X-ray focal spot size. Increasing the X-ray source-to-detector distance decreases the X-ray photon flux, however, resulting in longer data-acquisition times or poorer contrast resolution.
Because the blurring due to the pixel spacing and the X-ray source focal spot size are independent functions, the net system blur due to both of these functions may be obtained by adding the standard deviations of the individual blurring functions in quadrature:
| 3 |
Designing a microCT scanner geometry is therefore the process of selecting an appropriate source and detector for a particular application (and budget) and optimizing dxs and dsd to achieve the desired combination of image resolution, field of view, and data acquisition time.
A 3-D CT data set consists of a series of projection images acquired as either the subject or the detector/source assembly rotates over approximately 180 or 360 degrees. The reconstructed image is a spatial map of measured X-ray attenuation coefficients, µ, expressed as CT Numbers (defined below). The reconstructed image resolution can be no better than the resolution of the individual projection images and is also limited by the number of projections acquired, the image reconstruction grid size, and the filter employed during reconstruction. Image reconstruction algorithms are discussed in more detail below.
X-ray Source
The parameters of primary importance in selecting an X-ray source are the focal spot size, the bias voltage and the beam filtration.
Focal spot size As discussed above, the image resolution is limited by the focal spot size. For this reason, most microCT systems employ microfocus X-ray sources with stationary targets [26]; X-ray sources with focal spot sizes as small as 5 µm FWHM are commercially available. However, the maximum power that may be applied to a microfocus X-ray source is limited by the rate at which heat can be removed from the X-ray source target. Flynn et al. [26] note that for stationary targets with small focal spot sizes the heat dissipation is predominantly radial and approximately proportional to the focal spot diameter. These researchers have observed that the maximum power for a stationary-target microfocus X-ray source approximately follows the empirical relationship
| 4 |
where Pmax is the maximum X-ray tube power in watts and xf,FWHM is the focal spot size in microns. A survey of specifications from a number of X-ray source suppliers shows Flynn's relationship to hold for most commercially available X-ray tubes. Because the total X-ray flux emitted by an X-ray source is approximately proportional to IV2 [38], where I is the X-ray source anode current and V is the bias voltage, this power ceiling (Power=IV) imposes an upper limit on the available X-ray flux.
Optimal X-ray energy For a Poisson-statistics limited detection system, in which a finite number of X-rays are emitted by the X-source, an optimal X-ray energy exists for best contrast resolution [39]. MicroCT data sets are typically Poisson-statistics limited due to the limited X-ray flux emitted by microfocus X-ray sources and the small detector element sizes. Following the work of Grodzins [39], the contrast resolution limit may be expressed as
| 5 |
where the CT Number is the traditional CT metric for measured tissue attenuation coefficient, µtissue, normalized to the attenuation coefficient of water, µwater:
| 6 |
In Equation 5, σCT Number is the standard deviation of the measured CT Number, D is the diameter of the subject, µ is the energy dependent X-ray attenuation coefficient, N is the total number of X-rays entering the field of view during the study and Δx is the detector element spacing. At low energies, where µ is large, the contrast resolution is limited by the small number of X-rays penetrating the subject. At higher energies, where µ is small, the contrast resolution is limited by the small number of X-rays absorbed in the subject. Equation 5 reaches an optimal (minimum) value at the energy for which µ=2/D. Flannery et al. [16] and Flynn et al. [26] have reported similar conclusions.
The calculated energy-dependent contrast for several different sized water phantoms is plotted in Figure 3; for a 3-cm (mouse-sized) phantom the optimal energy is approximately 25 keV. It is interesting to note that the curve for a 30-cm (human-sized) phantom has a much broader minimum, indicating clinical scanners are less sensitive to X-ray energy than are small animal scanners.
Figure 3.

Calculated contrast resolution as a function of monoenergetic X-ray energy for water phantoms with a range of diameters.
Of course, standard X-ray sources emit X-rays with a range of energies. The foregoing discussion therefore applies to the effective energy of the beam, or the X-ray energy whose linear attenuation coefficient most closely matches the measured characteristics of a polychromatic beam [40]. The effective energy is generally near 30% to 40% of the peak energy (peak energy=bias voltage xelectron charge) [41].
Beam hardening The polychromatic X-ray spectrum leads to a second important consideration, beam hardening. As noted above, the X-ray attenuation coefficient is strongly energy dependent, especially at the low X-ray energies preferred for small animal studies. As the X-ray beam passes through the subject, the lower-energy X-rays are preferentially absorbed near the surface, causing the measured CT Numbers to be higher near the edges of the subject. This is the well-documented beam-hardening artifact [41–45]. Prefiltration of the X-ray beam can reduce the artifact by making the beam more monochromatic and a number of algorithms have been developed to partially correct for beam hardening [42,44,45]. Nonetheless the effect is difficult to eliminate completely.
Detector
Most recently reported microCT systems employ phosphor screen image intensifier screens optically coupled to CCD arrays [16,17,22,23,25–33,35] or photodiode arrays [32]. The key parameters to consider when designing or selecting a microCT detector are the image intensifier quantum efficiency and resolution at the selected X-ray energy; the CCD or photodiode dynamic range, noise and dark current characteristics, pixel size, uniformity, field of view and read-out rate; and the optical coupling medium efficiency, uniformity and distortion. A detailed review of digital X-ray detector technology may be found in Ref. [46].
Reconstruction and Data Analysis Software
Tomographic Image Reconstruction
A tomographic imaging system acquires a series of X- ray projections from a range of angles around the subject. Each projection represents the value (or collection of values in a multielement X-ray detector) of the X-ray attenuation line integral through the subject along the line from the X-ray source to the X-ray detector element. Imaging the subject at equiangular-spaced views over 180 degrees forms a complete set of projection data. Tomographic image reconstruction creates a 2-D image (or 3-D volume) from the measured projection data. The angular distance between successive projections and the X-ray detector pitch are two of the primary factors controlling the resolution of the reconstructed image.
The measured projection along the X-ray path I at angle, is given by the line integral equation
| 7 |
where µ (I) is the attenuation coefficient of the subject along I. One can see that the X-ray attenuation factor is dependent on both the attenuation coefficient and the thickness of the subject. The discrete version of Equation 7 used in practice is
| 8 |
where j is a pixel index, Ii, is the set of image pixels through which X-ray beam i passes, Iij is the intersection length of beam i with pixel j, and µj is the attenuation coefficient for pixel j. If we let f(x,y) represent the 2-D image to be reconstructed, the line integral projection through f(x,y) is called its Radon transform. The Radon transform of the target image is precisely what is measured when tomographic projection data is acquired. The collection of projections in the Radon transform domain is commonly referred to as a sinogram.
The process of image reconstruction may be defined as converting projection data in the Radon transform domain to an image in the spatial domain. There are three major classes of algorithms that use fundamentally different approaches to accomplish this conversion: (1) Fourier-transform-based backprojection algorithms [43,47–49], (2) statistical algorithms [50–53], and (3) Radon-inversion algorithms [43,47]. Fourier-transform-based reconstruction techniques are most commonly used in microCT and are discussed in somewhat more detail below.
Filtered Backprojection Reconstruction Algorithms
The traditional reconstruction algorithm used in most practical applications is filtered backprojection (FBP), a Fourier-based technique. FBP is derived from the Fourier slice theorem [43] which basically states that the Fourier transform of a parallel-ray projection of an image f(x,y) taken at angle is a slice of the 2-D Fourier transform of the reconstructed image, F(u,v), subtending an angle with the u-axis (Figure 4). The complete 2-D Fourier transform of the image, F(u,v) can be built by transforming all of the individual projections of f(x,y), and then taking the inverse-Fourier transform of F(u,v). Detailed developments of the FBP algorithm are found elsewhere [43,47].
Figure 4.

Schematic diagram of the Fourier Slice Theorem showing the relationship between projection data and Fourier domain image data.
The advantages of FBP are that its implementation is straightforward and the execution is relatively fast. FBP algorithms do not perform as well, however, in cases where poor statistics are encountered. Statistical reconstruction algorithms are frequently employed for these applications [50–52].
Early formulations of FBP assumed a parallel X-ray architecture, i.e., the line integrals through the subject are considered to be parallel. As X-ray CT systems evolved, diverging X-ray fan-beam architectures became more common because of their convenience and improved data acquisition speed. Also, fan-beam systems provide improved resolution over the comparable parallel-beam system (i.e. same number of detectors) because of improved sampling in the central region of the subject. A fan-beam sinogram can be resorted into a parallel-beam sinogram and then reconstructed using the traditional parallel-beam algorithm. Alternatively, the fan-beam sinogram can be reconstructed directly with a fan-beam reconstruction algorithm such as those detailed by others [43,54,55]. A simple way to derive the fan-beam reconstruction algorithm is to apply a coordinate transformation to the parallel-beam equations as described by Cho [54].
In conventional X-ray CT systems a 3-D volume is calculated by reconstructing and stacking individual 2-D slices. As noted above, however, most recently developed microCT systems employ two-dimensional detector arrays, allowing the acquisition of a truly three-dimensional data set. Since the initial work by Feldkamp et al. [21], 3-D cone-beam reconstruction algorithms have become an active area of research. For example, Dusaussoy [56] developed a Radon inversion, exact cone-beam reconstruction method that is effective independent of cone angle size. Schaller et al. have developed a fast, approximate cone-beam reconstruction algorithm suitable for small cone angles and an efficient Radon-inversion method for exact cone-beam reconstruction [57]. Wang et al. [58] and Vannier et al. [59] , among others, have also made significant contributions in this arena.
Despite these recent advances, the Feldkamp algorithm remains the most commonly employed cone-beam reconstruction method because of its straightforward implementation and its applicability to practical tomography systems. Feldkamp's algorithm is a 3-D backprojection method that can be derived directly from the fan-beam equations for FBP. It is an approximate solution, but has tremendous practical utility for most cone-beam tomography applications.
Imaging Protocol Considerations
One of the most important advantages of any small animal in vivo imaging technology is the ability to continue to study the animal after an imaging procedure. For this reason, it is critical that the imaging protocol have a negligible effect on the health of the animal. The anesthesia, radiation dose, and contrast media must be carefully selected to ensure the health of the animal after the scan.
Anesthesia
High resolution in vivo imaging requires that the subject be restrained during the scan; this is typically accomplished by anesthetizing the animal. Detailed reviews of various anesthesia protocols for small animals may be found elsewhere [60–67].
Radiation Dose
Radiation dose to the animal is an important concern when designing a microCT protocol. We have measured the dose to various organs using the Oak Ridge National Laboratory (ORNL) MicroCAT [37] using thermoluminescent detectors implanted in the bodies of euthanized mice. For these studies, the X-ray source was biased at 40 kVp with an anode current of 800 µA and 390 projections were acquired with 0.5-second exposures per projection. A 6-mm Lucite beam-filter was used to provide a modest reduction in low-energy dose. The radiation doses for 390-projection and 195-projection scans are summarized in Table 1, where the 195-projection doses were calculated based on the measured 390-projection data. The estimated acute organ dose delivered during a single 195-projection scan is on the order of 5% of published LD50/30 values for mature mice [68].
Table 1.
Radiation Dose to Organs during MicroCT Study.
| Organ | Dose Received during High-resolution (390 Projection) Scan* (Gy) | Dose Received during Screening (195 Projection) Scan† (Gy) |
| Brain | 0.76 | 0.38 |
| Trachea | 0.41 | 0.21 |
| Heart | 0.60 | 0.30 |
| Liver | 0.48 | 0.24 |
| Kidneys | 0.76 | 0.38 |
| Intestines | 0.63 | 0.32 |
| Stomach | 0.56 | 0.28 |
| Bladder | 0.45 | 0.23 |
| Uterus | 0.55 | 0.28 |
Measured using thermoluminescent dosemeters.
Estimate based on 390-projection study.
Contrast Media
In clinical studies, iodine or barium contrast media are typically administered orally, intravenously or rectally to enhance the measured CT Numbers of various organs or tissues [40,41]. Similar protocols may also be developed for small animal studies. To date, contrast enhanced imaging at the ORNL has been limited to i.p. injection of a nonionic water-soluble iodine contrast medium (e.g., Nycomed Omnipaque-300). The i.p. injection route was selected for its simplicity, an important factor when studying large populations. The contrast medium opacifies the peritoneal fluids, providing visible boundaries between organs, and is removed through the liver and kidneys to the bladder, increasing the measured CT Numbers for these organs. The increase in CT Number provided by contrast media is approximately
| 9 |
where C is the contrast medium concentration in the tissue (mg/ml) and µ′ is the density-normalized attenuation coefficient (µ′=µ/density cm2/g).
A typical contrast enhanced kidney scan is shown in Figure 5, where the mouse was injected i.p. with 250 µl of Nycomed Omnipaque-300 30 minutes before the scan. The mouse was anesthetized with a solution of tribromoethanol dissolved in tertiary amyl alcohol and distilled water for an i.p. injected dose of 300 mg/kg body weight. The mouse was scanned using the ORNL “high resolution protocol” in which the X-ray source was biased at 40 kVp and 400 µA, and data set consisting of 390 projections (1-second exposure per projection) was acquired. The image was reconstructed on a 500x500-pixel grid using a fan-beam resorting algorithm followed by a filtered-back projection algorithm with a standard ramp filter [40].
Figure 5.
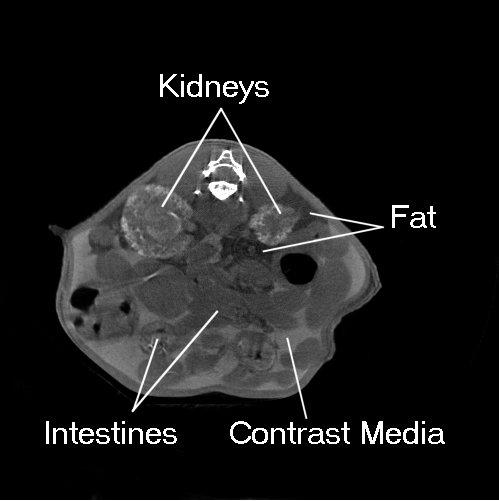
Kidney scan of an adult mouse acquired using 250 ml i.p. injected Nycomed Omnipaque 300 contrast media to enhance the CT Numbers of the kidneys and peritoneal fluids.
Representative Images
Tramp Model
To assess the usefulness of microCT for soft-tissue tumor studies, several mice from the autochthonous transgenic adenocarcinoma mouse prostate (TRAMP) model recently developed by Greenberg and coworkers [69–71] were imaged. The TRAMP model is a transgenic line of C57BL/6 mice carrying a DNA construct comprised of the minimal -426/+28 base pair rat probasin promoter driving prostate-specific epithelial expression of the SV40 large T antigen. TRAMP males display prostatic intraepithelial neoplasia by 10 to 12 weeks of age with distant metastases by 24 to 30 weeks of age [70,71].
The University of California Berkeley Cancer Research Laboratory (A. Hurwitz and J. Allison) provided the mice used in this study. Six mature male TRAMP mice (approximately 24 weeks old) were injected i.p. with 0.25 ml of Conray 400 iodinated contrast medium 15 minutes before sacrifice. The carcasses were then frozen and shipped to the ORNL. The frozen carcasses were scanned using the ORNL “screening protocol” in which the X-ray source was biased at 40 kVp and the anode current was set to 400 µA. A total of 195 projections (1.0 seconds per projection) were acquired in 1-degree steps. The images were reconstructed on a 250x250-pixel grid using a fan-beam resorting algorithm followed by a filtered-back projection algorithm using a standard ramp filter [40].
A typical reconstructed image of the TRAMP model pelvis is shown in Figure 6. Tumors are visible above and below the bladder, which appears as a bright white structure in the middle of the image. The tumors are 6 to 10 mm in diameter and clearly constrict the bladder. Fatty tissue is also present around the tumors and bladder. The CT image agrees well with necropsy data obtained from animals of similar age (Norman Greenberg, private communication).
Figure 6.

Pelvic microCT scan of a TRAMP model showing (A) prostate tumors, (B) bone, (C) muscle, (D) bladder (opacified by contrast media uptake), and (E) fat.
Lung Tumor
Kennel and coworkers at the ORNL have recently developed targeted radioimmunotherapy for lung carcinoma in which monoclonal antibodies labeled with alpha particle emitting radioisotopes are targeted to lung tumor vessels [72–75]. To evaluate the efficacy of microCT as a means of imaging lung tumors in vivo a series of BALB/c mice were seeded with EMT-6 lung tumors and serial CT images were collected over a 17-day period. Thin section histology samples were collected every 0.5 mm through fixed lung from each group and used to determine the accuracy of tumor detection by CT. CT proved most useful in detecting lung tumors located in the hilar area and least useful in detecting serosal surface and anterior lobe tumor foci.
For the CT studies of live mice, the animals were anesthetized through i.p. injection of the tribromoethanol solution described above. No contrast media was used. The CT scan and image reconstruction followed the ORNL “high resolution protocol” described above. An in vivo lung image is shown in (Figure 7a), where the image reconstruction grid was 500x500. At the end of the 17-day period of study the mice were sacrificed and the lungs were inflated with air for a final scan using the same scanner settings as before. A postmortem scan is shown in (Figure 7b), where the reconstruction grid was 250x250. It should be noted that some additional postreconstruction processing was applied to (Figure 7b) to match the image scale with that of (Figure 7a).
Figure 7.
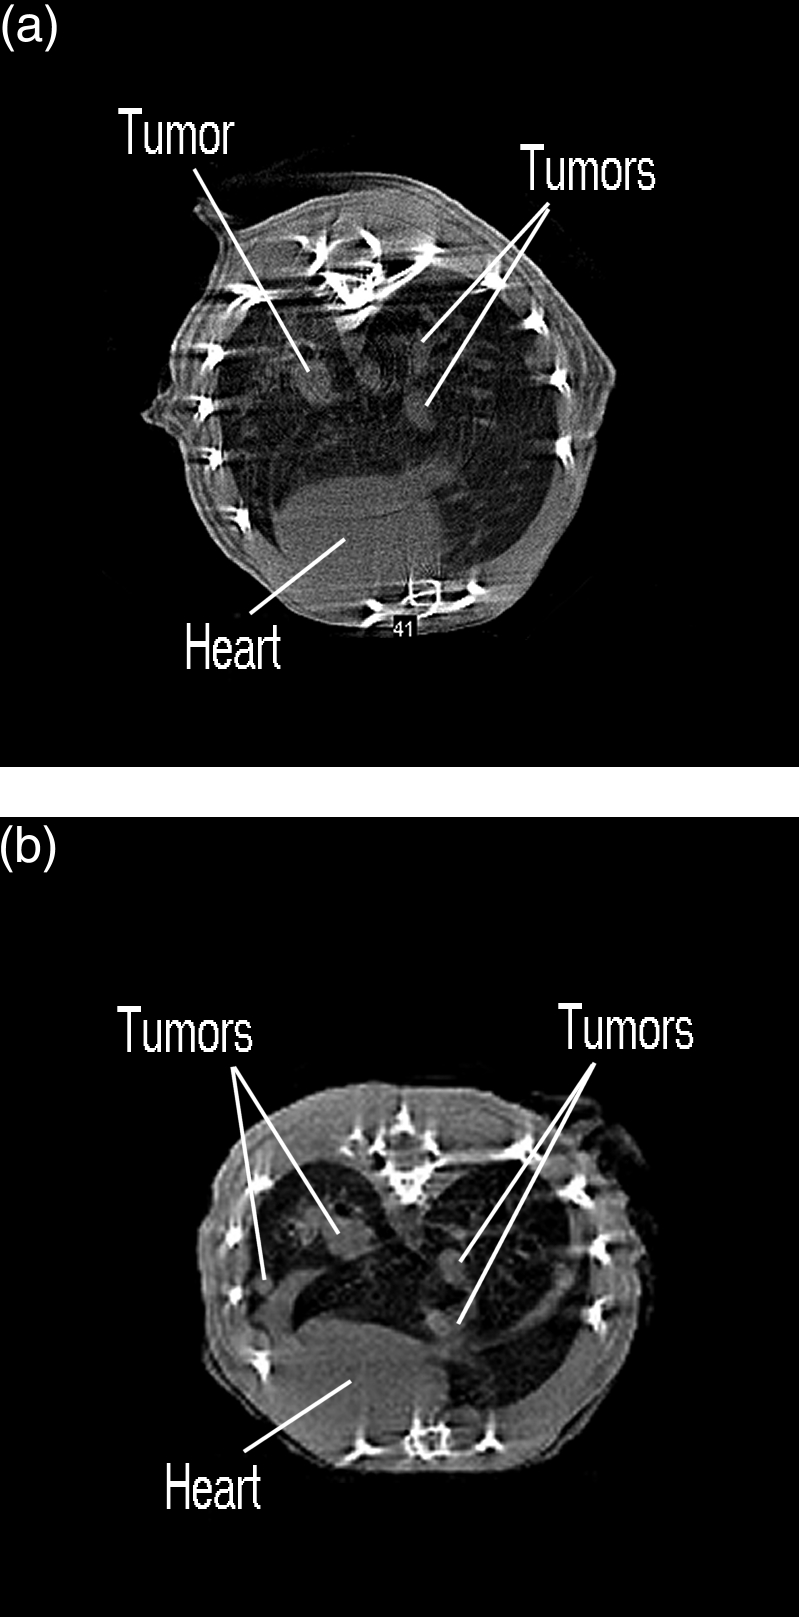
MicroCT lung scans of (a) living and (b) euthanized BALB/c mouse seeded with EMT-6 lung tumors.
Although streak artifacts and blurring due to pulmonary and cardiac motion appear in the in vivo image (Figure 7a), the larger tumors are evident. Observable tumors vary in size from approximately 0.5 mm to 2 mm in diameter. The tumors are visible in greater detail in the postmortem image shown in (Figure 7b). The gross structural characteristics of the lungs are also more clearly resolved. Tumor positions were verified by comparing serial CT reconstructions with H+E stained serial histology sections.
Bone Tumor Model
To assess the usefulness of microCT for bone tumor studies, a mutant mouse model developed at ORNL was imaged. This mutant, 2Acr(e), was recovered among the offspring of a male which had been exposed to acrylamide monomer. The mutant line has been propagated in a breeding stock at ORNL since 1986. The mutation is presumed to be in an allele at the Mo (mottled) locus, recently renamed Atp7aMo=ATPase, Cu++ transporting, alpha polypeptide, located on the X chromosome. The allele MoOR-2Acre (provisiona| name) is transmitted through females only because carrier males die prenatally. Heterozygous females are characterized by mottled fur and curly vibrissae. They may exhibit osteomas on the skull, scapulae, and feet, with a frequency and body location that depends on genetic background.
A mature female with a palpable tumor on the left side of its skull was anesthetized through i.p. injection of the tribromoethanol solution described above and CT data was acquired following the ORNL “high resolution protocol”. No contrast medium was used. Two transaxial image slices of the tumor are shown in Figure 8, a and b where the tumor has an in-plane area of approximately 3.5x5 mm2.
Figure 8.

MicroCT scans of the ORNL 2Acr(e) mutant mouse exhibiting a large bone tumor at the base of the skull.
Conclusions
Recent advances in X-ray microCT hardware and software make this new technology an important new tool for in vivo small-animal-based biologic studies. MicroCT systems provide high resolution, rapid data acquisition and sensitivity to both skeletal and soft tissue. Soft-tissue sensitivity can be enhanced using contrast media. Due to the relatively low cost of X-ray imaging hardware, microCT has the potential to be among the least expensive small animal imaging modalities. Important issues to consider when designing a small animal X-ray microCT protocol are choice of anesthetic, X-ray dose/image quality tradeoffs, and choice of contrast media. Recent images of mouse models for prostate cancer, lung cancer and bone tumors demonstrate the potential usefulness of X-ray microCT in cancer research.
Acknowledgements
The authors are grateful to Charmaine Foltz for valuable discussions and assistance in animal handling and protocol development, and to Kevin Behel, Lemuel Thompson, Derek Austin, Aaron Symko, Evangeline Easterly and John Branning for helping to acquire the data presented here. The authors also thank Norman Greenberg, Andy Hurwitz, and J. Allison for providing the TRAMP models and for valuable discussions.
Footnotes
Research sponsored by the Laboratory Directed Research and Development Program of Oak Ridge National Laboratory, managed by Lockheed Martin Energy Research Corporation for the U. S. Department of Energy under Contract No. DE-AC05960R22464.
References
- 1.Hounsfield GN. Computerized transverse axial scanning (tomography): 1. Description of system. Br J Radiol. 1973;46:1016–1022. doi: 10.1259/0007-1285-46-552-1016. [DOI] [PubMed] [Google Scholar]
- 2.Cromack AM. Reconstruction of densities from their projections with applications in radiological physics. Phys Med Biol. 1973;18:195–207. doi: 10.1088/0031-9155/18/2/003. [DOI] [PubMed] [Google Scholar]
- 3.Lauterbur PC. Image formation by induced local interactions — examples employing nuclear magnetic resonance. Nature. 1973;242:190–191. [PubMed] [Google Scholar]
- 4.Ter-Pogossian MM, Phelps ME, Mullani NA. A positron-emission transaxial tomography for nuclear imaging (PETT) Radiology. 1975;114:89–98. doi: 10.1148/114.1.89. [DOI] [PubMed] [Google Scholar]
- 5.Kuhl DE, Edwards RQ. Radiology. 1963;80:653–662. [Google Scholar]
- 6.Johnson GA, Thompson MB, Gewalt SL, Hayes CE. Nuclear magnetic resonance imaging at microscopic resolution. J Magn Reson. 1986;68:129–137. [Google Scholar]
- 7.Eccles CD, Callaghan PT. High-resolution imaging: the NMR microscope. J Magn Reson. 1986;68:393–398. [Google Scholar]
- 8.Cherry SR, Shao Y, Silverman RW, Chatziioannou A, Meadors K, Siegel S, Farquhar T, Young J, Jones WF, Newport D, Moyers C, Andreaco M, Paulus M, Binkley D, Nutt R, Phelps ME. MicroPET: a high resolution PET scanner for imaging small animals. IEEE Trans Nucl Sci. 1997;44:1161–1166. [Google Scholar]
- 9.Cherry SR, Chatziioannou A, Shao Y, Silverman RW, Meadors K, Phelps ME. Brain imaging in small animals using microPET. In: Carson R, Daube-Witherspoon M, Herscovitch P, editors. Quantitative Functional Brain Imaging with Positron Emission Tomography. Academic Press; 1998. pp. 3–9. [Google Scholar]
- 10.Gambhir SS, Barrio JR, Wu L, Iyer M, Namavari M, Satyamurthy N, Bauer E, Parrish C, MacLaren DC, Borghei AR, Green LA, Sharfstein S, Berk AJ, Cherry SR, Phelps ME, Herschman HR. Imaging of adenoviral-directed herpes simplex virus type 1 thymidine kinase reporter gene expression in mice with radiolabeled ganciclovir. J Nucl Med. 1998;39:2003–2011. [PubMed] [Google Scholar]
- 11.Weber DA, Ivanovic M, Franceschi D, Strand S-E, Erlandsson K, Frandcheschi M, Atkins HL, Coderre JA, Susskind H, Button T, Ljunggren K. Pinhole SPECT: a new approach to in vivo high resolution SPECT imaging in small laboratory animals. J Nucl Med. 1994;35:342–348. [PubMed] [Google Scholar]
- 12.Weisenberger AG, Bradley E, Majewski S, Saha M. Development of a novel radiation imaging detector system for in vivo gene imaging in small animal studies; Conference Record of the 1996 Medical Imaging Conference; 1996. pp. 1201–1205. [Google Scholar]
- 13.Kujoory MA, Hillman BJ, Barrett H. High-resolution computed tomography of the normal rat nephrogram. Invest Radiol. 1980;15:148–154. doi: 10.1097/00004424-198003000-00010. [DOI] [PubMed] [Google Scholar]
- 14.Burstein PJ, Bjorkholm RC, Chase RC, Seguin FH. The largest and smallest X-ray computed tomography systems. Nucl Instrum Methods Phys Res. 1984;221:207–212. [Google Scholar]
- 15.Miller GG, Dawson DT, Battista JJ. Compute tomographic assessment of radiation induced damage in the lung of normal and WR 2721 protected LAF1 mice. Int J Radiat Oncol Biol Phys. 12:1971–1975. doi: 10.1016/0360-3016(86)90134-3. [DOI] [PubMed] [Google Scholar]
- 16.Flannery BP, Deckman HW, Roberge WG, D'Amico KL. Three-dimensional X-ray microtomography. Science. 1987;237:1439–1444. doi: 10.1126/science.237.4821.1439. [DOI] [PubMed] [Google Scholar]
- 17.Flannery BP, Roberge WG. Observational strategies for three-dimensional synchrotron microtomography. J Appl Phys. 1987;62:4668–4674. [Google Scholar]
- 18.Leyton MW, Goldstein SA, Goulet RW, Feldkamp LA, Kubinski DJ, Bole GG. Examination of subchondral bone architecture in experimental osteoarthritis by microscopic computed axial tomography. Arthritis Rheum. 1988;31:1400–1405. doi: 10.1002/art.1780311109. [DOI] [PubMed] [Google Scholar]
- 19.Feldkamp LA, Goldstein SA, Parfitt M, Jesion G, Kleerekoper M. The direct examination of three-dimensional bone architecture in vitro by computed tomography. J Bone Miner Res. 1989;4:3–11. doi: 10.1002/jbmr.5650040103. [DOI] [PubMed] [Google Scholar]
- 20.Kuhn JL, Goldstein SA, Feldkamp LA, Goulet RW, Jession G. Evaluation of a microcomputed tomography system to study trabecular bone structure. J Orthop Res. 1990;8:833–842. doi: 10.1002/jor.1100080608. [DOI] [PubMed] [Google Scholar]
- 21.Feldkamp LA, Davis LC, Kress JW. Practical cone-beam algorithm. J Opt Soc Am. 1984;1:612–619. [Google Scholar]
- 22.Holdsworth DW, Drangova M, Schulenberg K, Fenster A. A table-top CT system for high-resolution volume imaging. SPIE. 1990;1231:239–245. [Google Scholar]
- 23.Holdsworth DW, Drangova M, Fenster A. A high-resolution XRII-based quantitative volume CT scanner. Med Phys. 1993;20:449–462. doi: 10.1118/1.597038. [DOI] [PubMed] [Google Scholar]
- 24.Reid BK, Cunningham IA. High resolution X-ray imaging at soft diagnostic energies using a silicon photodiode array. Med Phys. 1993;20:1497–1504. doi: 10.1118/1.597113. [DOI] [PubMed] [Google Scholar]
- 25.Hearshen DO, Reimann DA, Flynn MJ. Measurement of CT resolution in 3 dimensions. Radiology. 1995;197:291. [Google Scholar]
- 26.Flynn MJ, Hames SM, Reimann DA, Wilderman SJ. Microfocus X-ray sources for 3-D microtomography. Nucl Instrum Methods Phys Res Sect A. 1994;353:312–315. [Google Scholar]
- 27.Elliott JC, Anderson P, Davis GR, Wong FSL, Dover SD. Computed tomography: Part II. The practical use of a single source and detector. JOM-J Min Met Mat Soc. 1994;46:11–19. [Google Scholar]
- 28.Davis GR, Elliott JC, Anderson P. Quantitative microtomography using a 10 µm polychromatic X-ray beam from a laboratory source. In: Michette AG, Morrison GR, Buckley CJ, editors. X-ray Microscopy III. Vol. 67. Springer-Verlag: Springer Series in Optical Science; 1992. pp. 458–460. [28] [Google Scholar]
- 29.Davis GR, Elliott JC. X-ray microtomography scanner using time-delay integration for elimination of ring artifacts in the reconstructed image. Nucl Instrum Methods Phys Res Sect A. 1997;394:157–162. [Google Scholar]
- 30.Rüegsegger P, Koller B, Müller R. A microtomographic system for the nondestructive evaluation of bone architecture. Calcif Tissue Int. 1996;58:24–29. doi: 10.1007/BF02509542. [DOI] [PubMed] [Google Scholar]
- 31.Johnson RH, Hu H, Haworth ST, Cho PS, Dawson CA, Linehan JH. Feldkamp and circle-and-line cone-beam reconstruction for 3-D micro-CT of vascular networks. Phys Med Biol. 1998;43:929–940. doi: 10.1088/0031-9155/43/4/020. [DOI] [PubMed] [Google Scholar]
- 32.Stenström M, Olander B, Carlsson CA, Carlsson GA, Håkanson R. Methodologic aspects of computed microtomography to monitor the development of osteoporosis in gastrectomized rats. Acad Radiol. 1995;2:785–791. doi: 10.1016/s1076-6332(05)80487-8. [DOI] [PubMed] [Google Scholar]
- 33.Stenström M, Olander B, Carlsson CA, Carlsson GA, Lehto-Axtelius D, Håkanson R. The use of computed microtomography to monitor morphological changes in small animals. Appl Radiat Isot. 1998;49:565–570. doi: 10.1016/s0969-8043(97)00189-9. [DOI] [PubMed] [Google Scholar]
- 34.Boone JM, Alexander GM, Seibert JA. A fluoroscopy-based computed-tomography scanner for small specimen research. Invest Radiol. 1993;28:539–544. doi: 10.1097/00004424-199306000-00015. [DOI] [PubMed] [Google Scholar]
- 35.Corrigan NM, Chavez AE, Wisner ER, Boone JM. A multiple detector array helical X-ray microtomography system for specimen imaging. Med Phys. 1999;26:1708–1713. doi: 10.1118/1.598662. [DOI] [PubMed] [Google Scholar]
- 36.Stratec Medizintechnik XCT Research M, author. Stratec Medizintechnik Gmbh. Durlacher Str. 35, D-75172 Pforzheim, Germany. [Google Scholar]
- 37.Paulus MJ, Sari-Sarraf H, Gleason SS, Bobrek M, Hicks JS, Johnson DK, Behel JK, Thompson LH, Allen WC. A new X-ray computed tomography system for laboratory mouse imaging. IEEE Trans Nucl Sci. 1999;46:558–564. [Google Scholar]
- 38.Bushberg JT, Seibert JA, Leidholt EM, Boone JM. The Essential Physics of Medical Imaging. Baltimore, MD: Williams & Wilkins; 1995. [Google Scholar]
- 39.Grodzins L. Optimum energies for X-ray transmission tomography of small samples: applications of synchrotron radiation to computerized tomography. Nucl Inst and Meth. 1983;206:541–545. [Google Scholar]
- 40.Webb S, editor. The Physics of Medical Imaging. Bristol, England: IOP Publishing; 1988. [Google Scholar]
- 41.Sprawls P. Physical Principles of Medical Imaging. Gaithersburg, MD: Aspen; 1993. [Google Scholar]
- 42.Duerinckx AJ, Macovski A. Polychromatic streak artifacts in computed tomography images. J Comput Assist Tomogr. 1978;2:481–487. doi: 10.1097/00004728-197809000-00020. [DOI] [PubMed] [Google Scholar]
- 43.Kak AC, Slaney M. Principles of Computerized Tomographic Imaging. New York, NY: IEEE Press; 1988. [Google Scholar]
- 44.Stonestrom JP, Alvarez RE, Macovski A. A framework for spectral artifact corrections in X- ray CT. IEEE Trans Biomed Eng. 1981;28:128–141. doi: 10.1109/TBME.1981.324786. [DOI] [PubMed] [Google Scholar]
- 45.de Paiva RF, Lynch J, Rosenberg E, Bisiaux M. A beam hardening correction for X-ray microtomography. NDT&E Int. 1998;31:17–22. [Google Scholar]
- 46.Yaffe MJ, Rowlands JA. Phys Med Biol. 1997;42:1–39. doi: 10.1088/0031-9155/42/1/001. [DOI] [PubMed] [Google Scholar]
- 47.Herman GT. Image Reconstruction from Projections: The Fundamentals of Computerized Tomography. New York, NY: Academic Press; 1980. [Google Scholar]
- 48.Shepp LA, Logan BF. The Fourier reconstruction of a head section. IEEE Trans Nucl Sci. 1974;21:21–43. [Google Scholar]
- 49.Ramachandran G, Lakshminarayanan A. Three-dimensional reconstructions from radiographs and electron micrographs. Proc Natl Acad Sci USA. 1971;68:2236–2240. doi: 10.1073/pnas.68.9.2236. [DOI] [PMC free article] [PubMed] [Google Scholar]
- 50.Lange K, Carson RE. EM Reconstruction algorithms for emission and transmission tomography. J Comput Assist Tomogr. 1984;8:306–316. [PubMed] [Google Scholar]
- 51.Ollinger JM. Maximum-likelihood reconstruction of transmission images in emission computed tomography via the EM algorithm. IEEE Trans Med Imaging. 1994;13:89–101. doi: 10.1109/42.276147. [DOI] [PubMed] [Google Scholar]
- 52.Lange K, Fessler JA. Globally convergent algorithms for maximum a posteriori transmission tomography. IEEE Trans Image Process. 1995;4:1430–1438. doi: 10.1109/83.465107. [DOI] [PubMed] [Google Scholar]
- 53.Gleason SS, Sari-Sarraf H, Paulus MJ, Johnson DK, Norton SJ, Abidi MA. Reconstruction of multi-energy X-ray computed tomography images of laboratory mice. IEEE Trans Nucl Sci. 1999;46:1081–1086. [Google Scholar]
- 54.Cho Z-H. Foundations of Medical Imaging. New York, NY: Wiley; 1993. [Google Scholar]
- 55.Concepcion JA, Carpinelli JD, Kuopetravic G, Reisman S. CT fan-beam reconstruction with a nonstationary axis of rotation. IEEE Trans Med Imaging. 1992;11:111–116. doi: 10.1109/42.126917. [DOI] [PubMed] [Google Scholar]
- 56.Dusaussoy NJ. VOIR, a volumetric image reconstruction algorithm based on Fourier techniques for inversion of the 3-D radon transform. IEEE Trans Image Process. 1996;5:121–131. doi: 10.1109/83.481676. [DOI] [PubMed] [Google Scholar]
- 57.Schaller S, Flohr T, Steffen P. An efficient Fourier method for 3-D radon inversion in exact cone-beam CT reconstruction. IEEE Trans Med Imaging. 1998;17:244–250. doi: 10.1109/42.700736. [DOI] [PubMed] [Google Scholar]
- 58.Wang G, Vannier MW, Cheng PC. Iterative X-ray cone-beam tomography for metal artifact reduction and local region reconstruction. Microsc Microanal. 1999;5:58–65. doi: 10.1017/S1431927699000057. [DOI] [PubMed] [Google Scholar]
- 59.Wang G, Snyder DL, Vannier MW. Local computed tomography via iterative deblurring. Scanning. 1996;18:582–588. doi: 10.1002/sca.4950180808. [DOI] [PubMed] [Google Scholar]
- 60.Hogan B, Constantini F, Lacy E, editors. Manipulating the Mouse Embryo, a Laboratory Manual. NY: Cold Spring Harbor Laboratory; 1986. [Google Scholar]
- 61.Gardner DJ, Davis JA, Weina PJ, Theune B. Comparison of tribromoethanol, ketamine/acetylpromazine, telazol/xylazine, pentobarbital, and methoxyflurane anesthesia in HSD:ICR mice. Lab Anim Sci. 1995;45:199–204. [PubMed] [Google Scholar]
- 62.Messier C, Emond S, Ethier K. New techniques in stereotaxic surgery and anesthesia in the mouse. Pharmacol Biochem Behav. 1999;63:313–318. doi: 10.1016/s0091-3057(98)00247-0. [DOI] [PubMed] [Google Scholar]
- 63.Flecknell PA. Anaesthesia of animals for biochemical research. Br J Anaesth. 1993;71:885–894. doi: 10.1093/bja/71.6.885. [DOI] [PubMed] [Google Scholar]
- 64.Papaioannou VE, Fox JG. Efficacy of tribromoethanol anesthesia in mice. Lab Anim Sci. 1993;43:189–192. [PubMed] [Google Scholar]
- 65.Zeller W, Meier G, Biirki K, Panoussis B. Adverse effects of tribromoethanol as used in the production of transgenic mice. Lab Anim. 1997;43:407–413. doi: 10.1258/002367798780599811. [DOI] [PubMed] [Google Scholar]
- 66.Rice SA, Baden JM, Kundomal YR. Effects of subchronic intermittent exposure to isoflurane in Swiss Webster mice. J Environ Pathol Toxicol Oncol. 1986;6:285–293. [PubMed] [Google Scholar]
- 67.Qiu HH, Cofer GP, Hedlund LW, Johnson GA. Automated feedback control of body temperature for small animal studies with MR microscopy. IEEE Trans Biomed Eng. 1997;44:1107–1113. doi: 10.1109/10.641338. [DOI] [PubMed] [Google Scholar]
- 68.Patchen ML, Macvittie TJH, Souza LM. Postirradiation treatment with granulocyte colony-stimulating factor and preirradiation WR-2721 administration synergize to enhance hematopoietic reconstruction and increase survival. Int J Radiat Oncol Biol Phys. 1992;22:773–779. doi: 10.1016/0360-3016(92)90522-j. [DOI] [PubMed] [Google Scholar]
- 69.Greenberg NM, DeMayo FJ, Finegold M, Medina D, Tilley W, Aspinall JO, Cunha GR, Donjacour AA, Matusik RJ, Rosen JM. Prostate cancer in a transgenic mouse. Proc Natl Acad Sci USA. 1995;92:3439–3443. doi: 10.1073/pnas.92.8.3439. [DOI] [PMC free article] [PubMed] [Google Scholar]
- 70.Gingrich JR, Barrios RJ, Morton RA, Boyce BF, DeMayo FJ, Finegold MJ, Angelopoulou R, Rosen JM, Greenberg NM. Metastasic prostate cancer in a transgenic mouse. Cancer Res. 1996;56:4096–4002. [PubMed] [Google Scholar]
- 71.Gingrich JR, Barrios RJ, Kattan MW, Nahm HS, Finegold MJ, Greenberg NM. Androgen independent prostate cancer progression in the TRAMP model. Cancer Res. 1997;57:4687–4691. [PubMed] [Google Scholar]
- 72.Kennel SJ, Boll R, Stabin M, Schuller HM, Mirzadeh S. Radioimmunotherapy of micrometastases in lung with vascular targeted 213Bi. Br J Cancer. 1999;80:175–184. doi: 10.1038/sj.bjc.6690337. [DOI] [PMC free article] [PubMed] [Google Scholar]
- 73.Kennel SJ, Stabin M, Broeske JC, Foote LJ, Lankford PK, Terzaghi-Hower M, Patterson H, Barkenbus J, Popp DM, Boll R, Mirzadeh S. Radiotoxicity of bismuth-213 bound to membranes of monolayer and spheroid cultures of tumor cells. Radiat Res. 1999;151:244–256. [PubMed] [Google Scholar]
- 74.Kennel SJ, Stabin M, Yoriayaz H, Brechbiel M, Mirzadeh S. Treatment of lung tumor colonies with 90Y targeted to blood vessels: comparison with the alpha-particle emitter 213Bi. Nucl Med Biol. 1999;26:149–157. doi: 10.1016/s0969-8051(98)00069-9. [DOI] [PubMed] [Google Scholar]
- 75.Kennel SJ, Mirzadeh S. Vascular targeted radioimmunotherapy with 213Bi — an α-particle emitter. Nucl Med Biol. 1998;25:241–246. doi: 10.1016/s0969-8051(97)00200-x. [DOI] [PubMed] [Google Scholar]