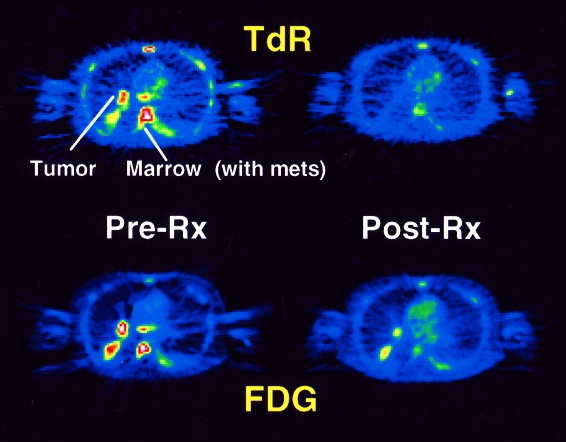
Figure 5.
Images from a patient imaged before and after one cycle of chemotherapy for small-cell lung cancer. Images on the left show pre-therapy summed FDG and thymidine images; images on the right are summed images after one week of therapy. Images show the lung tumor and vertebral bone marrow metastases. Although both tracers indicate a decline in tracer uptake in response to therapy, the decline is much greater in the thymidine images, even without metabolite subtraction. The patient went on to have a complete clinical response after several more cycles of chemotherapy.

