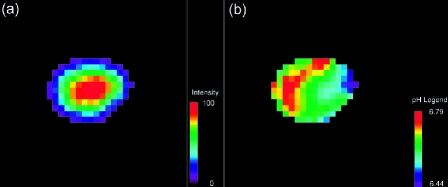
Figure 6.
(a) Intensity map of the H2 resonance of IEPA in a coronal slice through an MDAmb-435 human breast cancer tumor growing in an SCID mouse. (b) Corresponding extracellular pH map, calculated from the chemical shift of the IEPA resonance (Ref. [93]) (reprinted with permission from Wiley-Liss). These data are from work performed by R. van Sluis, with grateful acknowledgement to Prof. R.J. Gillies and Dr. N. Raghunand.

