Abstract
A 12-residue peptide AcDKDGDGYISAAENH2 analogous to the third calcium-binding loop of calmodulin strongly coordinates lanthanide ions (K = 105 M−1). When metal saturated, the peptide adopts a very rigid structure, the same as in the native protein, with three last residues AAE fixed in the α-helical conformation. Therefore, the peptide provides an ideal helix nucleation site for peptide segments attached to its C terminus. NMR and CD investigations of peptide AcDKDGDGYISAAEAAAQNH2 presented in this paper show that residues A13-Q16 form an α-helix of very high stability when the La3+ ion is bound to the D1-E12 loop. In fact, the lowest estimates of the helix content in this segment give values of at least 80% at 1°C and 70% at 25°C. This finding is not compatible with existing helix-coil transition theories and helix propagation parameters, s, reported in the literature. We conclude, therefore, that the initial steps of helix propagation are characterized by much larger s values, whereas helix nucleation is even more unfavorable than is believed. In light of our findings, thermodynamics of the nascent α-helices is discussed. The problem of CD spectra of very short α-helices is also addressed.
As follows from the Zimm–Bragg theory (1) of the helix-coil transition in polypeptides, the statistical weight of an α-helical segment formed by n amino acid residues with ϕ and ψ torsional angles close to −57° and −47°, respectively, can be described by the following simple expression (2, 3):
 |
1 |
where σ and s are the helix nucleation and propagation parameters, respectively, and n−2 is equal to the number of intrahelical hydrogen bonds between CO and NH groups of amino acid residues i, i + 4.
The propagation parameters s in water solutions have been determined for all 20 amino acid residues from studies of various model peptides (2). For helix makers, s > 1 at low (1°C) or even room (25°C) temperatures and long helical segments (n > 15) built of such residues are substantially populated. But short helices (n < 10) are always very unstable because of the small value of the nucleation parameter σ. Estimated at 0.0013, this value is believed to be the same for all amino acid residues (4).
A straightforward way to stabilize the α-helical conformation in short peptides is, therefore, to introduce an artificial helix nucleation site composed of a few residues fixed in the helical conformation (σ = 1), or at least with reduced conformational entropy (0.0013 ≪ σ < 1).
Several such systems have been devised and used successfully to nucleate the helix by covalent (5–12) or metal-induced (13, 14) side chain–side chain bridges. All of them reduce the entropy change related to the helix nucleation and, consequently, lead to a large increase of σ parameter, but none of them provides an ideal nucleation site composed of a few residues fixed in the rigid α-helical structure. Moreover, helix geometry at such nucleation sites is often distorted, which may have some destabilizing effect on the helical conformation (15).
The ideal helix-nucleation sites have been created by nature in calcium-binding loops of EF-hand proteins. A typical loop is composed of 12 residues providing six ligands that bind the metal ions directly or through a water molecule. The coordinated metal induces a very rigid structure of the loop in which the last three residues, 10, 11, and 12, are fixed in the α-helical conformation that initiates helix structure flanking the C terminus of the loop. Isolated loops preserve, to a degree, their metal-binding abilities and, therefore, can be used to nucleate α-helix formation in model peptide systems.
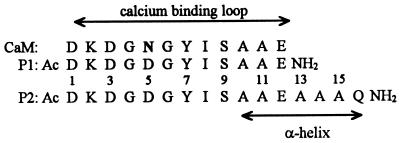
Peptide P1, whose sequence is analogous to the third calcium-binding loop of calmodulin (Fig. 1) weakly coordinates calcium with the binding constant of about 102 M−1. Consequently, the calcium-saturated loop still preserves some conformational flexibility (16). Nevertheless, lanthanide ions, known as excellent substitutes for calcium (17, 18), bind to the loop quite strongly, with binding constants of about 105 M−1 (19), and fix it in a very rigid conformation close to that known from the x-ray structure of calmodulin (16).
Figure 1.
Sequences of calcium binding loop III of native rat testis calmodulin (CaM) and its synthetic analogues, P1 and P2 peptides.
The main object of our studies was a 16-residue synthetic polypeptide P2 with the sequence shown in Fig. 1, composed of the calcium-binding loop (residues Asp-1—Glu-12) and the sequence of four residues, Ala-Ala-Ala-Gln-NH2, attached to its C terminus. Glutamine is used here to increase peptide solubility and prevent association of peptide helical segments. Peptides built of Ala4Gln blocks are well soluble in water and do not show any signs of aggregation up to a concentration of 120 μM (20). Such peptides were used to study helix-coil transitions in water (20, 21) as well as in water–trifluoroethanol mixtures (4). Because alanine is known to be the best helix maker, the Ala-13—Gln-16 segment of the peptide should readily assume the helical structure when it is nucleated by the La3+-saturated loop Asp-1—Glu-12.
MATERIALS AND METHODS
Peptide Synthesis and Purification.
Peptides P1 and P2, synthesized by using fluorenylmethoxycarbonyl chemistry, were generous gifts of P. S. Kim. The peptides were cleaved by using standard procedures, desalted on a G-10 Sephadex column in 5% acetic acid, and purified by reverse-phase HPLC chromatography on a Vydac C18 semipreparative column, by using a 10–30% acetonitrile gradient in 0.1% trifluoracetic acid. The purified peptides were checked for purity on an analytic Vydac C18 HPLC column to monitor possible transamidation products, as was described elsewhere (16).
NMR Measurements.
P2 peptide was dissolved in H2O/D2O (9:1) containing 100 mM NaCl and 20 mM LaCl3. pH was adjusted to 6.0 (direct pH meter reading) by microliter additions of 0.1 M HCl or NaOH. The final peptide concentration was 4 mM. It was shown (16) that peptide P1 saturated with lanthanide ions dimerizes, forming a native-like two-loop structure stabilized, most probably, by hydrogen bonds between CO and NH groups of isolucine residues of two peptide molecules. Peptide P2, containing the same calcium-binding loop, should dimerize in the same way. Nevertheless, the dimerization constant is low. According to the data given in ref. 16, its value at 275.2 K is 2.5 mol−1. At 4 mM concentration, the fraction of dimerized peptide molecules equals only 2% and cannot have any noticeable effect on NMR measurements.
1H NMR measurements were performed on a Bruker AMX-600 (Bruker Analytik, Rheinstetten, Germany) spectrometer at a frequency of 600.13 MHz and a temperature of 275.2 K. One-dimensional 1H NMR spectra were measured with the jump-and-return method (Δ = 116 μs) (22) to suppress the strong water signal without affecting exchangeable solute protons. Two-dimensional clean total correlation spectroscopy (23) and nuclear Overhauser enhancement spectroscopy (NOESY) (24) spectra, however, were measured with water presaturation during relaxation delay (1.8 s) and mixing time (NOESY). Mixing times in total correlation spectroscopy and NOESY spectra were equal to 80 ms and 200 ms, respectively. Correlation of 1H and 13C chemical shifts was measured on a Bruker AMX-400 spectrometer in 2H2O solution with heteronuclear multiple quantum coherence sequence (25) at natural 13C abundance.
1H and 13C chemical shifts were calibrated relative to the fictitious 2,2-dimethyl-2-silapentane sulfonate at 298 K. Such an approach is required to set a reference point identical to that used for the chemical shift index (26, 27).
Structure Calculations.
Nuclear Overhauser effect (NOE) crosspeaks were divided into three categories and assigned to distance ranges according to their intensity: strong, 0.18–0.27 nm; medium, 0.18–0.40 nm; weak, 0.18–0.55 nm (28). Peak intensities were estimated from the number of contours in the NOESY spectrum. Harmonic restraints for the La3+ ion were deduced from the position of the corresponding Ca2+ ion in the crystal structure of calmodulin (Protein Data Bank code 1cdm). A total of six harmonic distance restraints was included to fix the distance and the octahedral arrangement of the six ligands relative to the La3+ ion, assuming the same coordination as for the Ca2+ ion in the calmodulin crystal structure.
The structure calculations used the ab initio simulated annealing (sa.inp) and refinement (refine.inp) protocols from the x-plor program package (Yale University, New Haven, CT) (29). The calculations started from an extended template with randomized backbone torsion angles followed by 50 cycles of energy minimization to remove close nonbonded contacts. The high-temperature phase comprised 50 ps of dynamics at 1,000 K; the final 16 ps had an increased weight on covalent geometry restraints and the NOE derived distance restraints. In the next phase, the system was slowly cooled from 1,000 K to 100 K in 30 ps, followed by 200 steps of energy minimization. For the NOE effective energy term representing the interproton distances, a soft square-well potential was applied (30). The refinement protocol consisted of slow cooling from 1,000 K to 100 K within 45 ps. A force constant of 200 kcal mol−1rad−1 was used for the dihedral angle restraints, while the NOE derived distance restraints and harmonic restraints were represented by a square-well potential function with a force constant of 50 kcal mol−1 Å−2.
Of 200 resulting structures, these 30 structures that showed the lowest energy and the least violation of the experimental data were selected for further characterization. Geometry of the structures and elements of secondary structure were analyzed by using procheck (31) and dssp (32).
CD Measurements.
The spectra were recorded on an Aviv DS62 spectropolarimeter (Aviv Associates, Lakewood, NJ) equipped with an HP Model 89100A temperature controller. The wavelength was calibrated with epi-androsterone (trans-androsterone) and with 4% holmium oxide in 10% perchloric acid. All measurements were carried out in 0.1 M NaCl/5 mM cacodylic buffer, pH 6.9, at 1°C, 25°C, and 50°C, with peptide concentration of ca. 10 μM in a 10-mm path length cell. Samples were prepared by dilution of concentrated stock solutions of the peptides. Peptide concentration in the stock solutions was determined with 2% accuracy by fitting tyrosine absorption within the range 230–280 nm (33) to sample spectra measured on a Cary 3E spectrometer by using our own [trifluoroethanol (TFE)] least-squares fitting procedure.
Samples for trifluorethanol titration experiments were prepared by mixing 10-μM stock solutions of P2 peptide in a buffer containing 0.1 M NaCl/5 mM sodium cacodylate, pH 6.9/65% vol/vol mixture of TFE, and the buffer.
The scans were recorded with 0.2-nm step, 1 s averaging time, except for the measurements of P1(apo) and P2(apo) solutions, when the scans were recorded with 2-nm step, 10 s averaging time.
RESULTS
NMR Experiments.
One-dimensional 1H NMR spectra of P2 showed good dispersion for the amide proton resonances stretched from 6.9 to 9.8 ppm, so that the sequence-specific resonance assignments could be performed with a standard approach based on two-dimensional total correlation spectroscopy and NOESY spectra (34). The complete 1H resonance assignments are given in Table 1. These assignments allowed us to obtain almost all 13C chemical shifts for proton-bearing carbons from the two-dimensional 1H/13C heteronuclear multiple quantum coherence spectrum of P2 (Table 2). Only β-carbons of Ala-10, Ala-14, and Ala-15 showed ambiguity because of degeneracy of the corresponding 1H chemical shifts (Table 1).
Table 1.
1H chemical shifts in P2 peptide
| Residue | δ(HN)/3JHNα | δ(Hα) | δ(Hβ) | Others |
|---|---|---|---|---|
| Asp-1 | 8.71/6.0 | 4.48 | 2.63, 2.37 | N-term CH3 1.92 |
| Lys-2 | 8.39/7.5 | 4.41 | 1.98, 1.86 | Hγ 1.58; Hδ 1.68; Hɛ 3.01; Hζ 7.48 |
| Asp-3 | 8.07/9.1 | 4.75 | 3.13, 2.61 | |
| Gly-4 | 7.99 | 3.89, 3.79 | ||
| Asp-5 | 7.81/8.8 | 4.70 | 3.22, 2.67 | |
| Gly-6 | 9.04 | 4.00, 3.52 | ||
| Tyr-7 | 8.50/8.4 | 4.88 | 2.95, 2.70 | Hδ 7.03; Hɛ 6.80 |
| Ile-8 | 9.53/9.7 | 4.47 | 1.83 | γCH2 1.57; γCH3 0.86; Hδ 0.86 |
| Ser-9 | 9.78/6.9 | 4.51 | 4.44, 4.10 | |
| Ala-10 | 9.09/3.0 | 4.19 | 1.49 | |
| Ala-11 | 8.53/4.6 | 4.20 | 1.42 | |
| Glu-12 | 8.04/5.8 | 4.02 | 2.40, 2.13 | Hγ 2.57, 2.31 |
| Ala-13 | 8.79/4.4 | 4.11 | 1.45 | |
| Ala-14 | 7.89/5.1 | 4.20 | 1.49 | |
| Ala-15 | 7.58/5.8 | 4.28 | 1.49 | |
| Gln-16 | 7.75/7.1 | 4.21 | 2.19, 2.13 | Hγ 2.50, 2.42; Hɛ 7.36, 7.33 |
| NH2 | 7.66, 6.90 |
Table 2.
Chemical shifts of protonated carbons in P2 peptide
| Residue | δ(Cα) | δ(Cβ) | Others |
|---|---|---|---|
| Asp-1 | 53.95 | 40.67 | N-term CH3 23.93 |
| Lys-2 | 56.37 | 33.43 | γCH2 24.47; δCH2 28.40; ɛCH2 41.62 |
| Asp-3 | 52.12 | 39.57 | |
| Gly-4 | 47.33 | ||
| Asp-5 | 53.40 | 40.51 | |
| Gly-6 | 44.95 | ||
| Tyr-7 | 56.53 | 41.59 | δCH 133.65; ɛCH 117.69 |
| Ile-8 | 60.82 | 37.59 | γCH2 28.08; γCH3 17.75; δCH3 13.09 |
| Ser-9 | 57.04 | 65.30 | |
| Ala-10 | 54.77 | * | |
| Ala-11 | 55.54 | 18.05 | |
| Glu-12 | 58.37 | 28.76 | γCH2 38.15 |
| Ala-13 | 54.37 | 17.71 | |
| Ala-14 | 53.73 | * | |
| Ala-15 | 53.07 | * | |
| Gln-16 | 56.27 | 29.41 | γCH2 33.85 |
Ambiguity because of the degeneracy of 1H chemical shifts, δ(Cβ): 17.37, 17.91, 18.47.
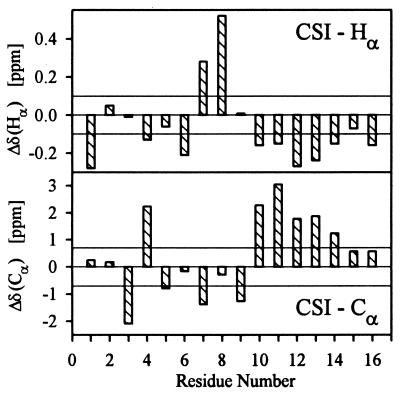
Hα and Cα chemical shift data available from our experiments were used to perform a secondary structure estimate according to the chemical shift index strategy (26, 27). Accuracy of this essentially statistical method increases with the number of types of involved nuclei. The chemical shift index method relies on calculation of chemical shift deviations for a given type of nuclei in all amino acid residues, if random coil chemical shifts are used as references. Consecutive deviations large enough to be meaningful indicate either helical structures or β-strands, depending on their sign. Negative deviations of Hα chemical shifts and positive deviations of Cα shifts correspond to local α-helical structures, whereas the opposite is true for local β-sheet structures. For P2 chemical shift indices of Hα, nuclei indicate an α-helical region extending from Ala-10 to Gln-16 (Fig. 2). Although chemical shift indices of Cα nuclei for two N-terminal residues are equal to zero, suggesting that the α-helical region stretches from Ala-10 to Ala-14, their chemical shift differences are equal to +0.57 ppm and, therefore, are close to the “quantization” limit of +0.7 ppm.
Figure 2.
Chemical shift index of Hα and Cα nuclei in P2 peptide. Chemical shift differences Δδ = δi−δi,ref and appropriate limits determining chemical shift indices are displayed rather than their discrete values −1, 0, 1. Stretches of negative Δδ(Hα) and positive Δδ(Cα) values are characteristic of the α-helical structure.
This finding is supported by the values of vicinal 3JHNα coupling constants. Regular secondary structures are characterized by the following values for 3JHNα: helices, J ≈ 4 Hz and β-sheets, J ≈ 9 Hz. For helices, the uniqueness of structure grows with the number of subsequent amino acid residues showing J < 6 Hz (87% for five subsequent residues) (34). Residues 10 to 15 are the only ones exhibiting coupling constants smaller than 6 Hz (Table 1). The value of 7.1 Hz observed for Gln-16 reflects some end effects, either partial unwinding of the helix or distortion of its geometry.
The calculation of the final structures was based on 83 NOE distance restraints (including 14 medium-range and 10 long-range NOEs), 14 ϕ angle restraints and 6 harmonic restraints for the ligands of the La3+ ion. The coordinates for the ten lowest energy structures have been deposited in the Protein Data Bank (PDB ID code 1NKF).
Analysis of the energies in Table 3 shows that both the NOE and harmonic energy term are close to zero, confirming that the assumption of an octahedral ligation of the La3+ ion (identical to that observed for the Ca2+ ion in calmodulin) is in total agreement with the experimental data.
Table 3.
Structural statistics for the family of 30 P2 structures
| Measurement | Value |
|---|---|
| rmsd from experimental distance and torsion angle restraints* | |
| NOE restraints (83), Å | 0.022 |
| La3+ ion restraints (6), Å | 0.022 |
| ϕ angles (14), ° | 0.014 |
| rmsd from idealized covalent geometry | |
| Bond lengths, Å | 0.001 |
| Angles, ° | 0.239 |
| Impropers, ° | 0.206 |
| x-plor potential energies (±SD), kcal·mol−1† | |
| Etotal | 11.6 (±0.7) |
| Erepel | 2.2 (±0.2) |
| ENOE | 1.5 (±0.4) |
| Ebond | 0.5 (±0.0) |
| Eangle | 3.3 (±0.4) |
| Eimproper | 0.7 (±0.1) |
| Edihedral | 0.0 (±0.0) |
| Eharm | 3.5 (±0.2) |
| rmsd of cartesian coordinates‡, Å | |
| Backbone N, Cα and C (residues 1–16) | 0.30 |
| All heavy atoms (residues 1–16) | 0.84 |
| Backbone N, Cα and C (residues 8–16) | 0.10 |
| All heavy atoms (residues 8–16) | 0.25 |
The total number of restraints is given in parentheses. None of the 30 structures showed distance violations of more than 0.20 Å or dihedral angle violations of more than 2.0°. No distance or dihedral angle restraints were consistently violated by more than 0.10 Å or 1.0°, respectively.
Etot, total energy, Erepel, repulsive energy term, ENOE, effective NOE energy term. The harmonic energy term (Eharm) was used to maintain the geometry of the six La3+ ion ligands.
rmsd values result from a superposition on the N, Ca, and C atoms of the protein backbone and were calculated by averaging the individual rmsds between the average structure and each member of the family.
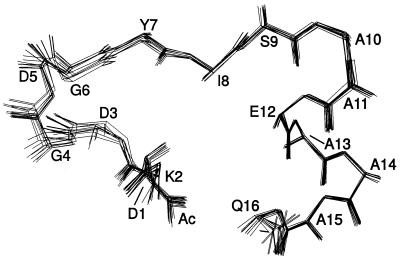
The structure is overall well defined, showing root-mean-square deviation (rmsd) values of less than 0.4 Å for most parts of the peptide chain and particularly low rmsd values for the C-terminal half (Fig. 3; Table 3). All backbone torsion angles of P2 are found in the energetically most favored (85%) or allowed (15%) regions of the Ramachandran plot.
Figure 3.
Overlay of a family of ten P2 peptide structures. The structures were accepted by the criterion of the best energy function after restrained molecular dynamics calculations.
The conformation of the N-terminal part of P2 closely resembles that of the third calcium binding loop of calmodulin, showing a pairwise backbone rmsd of 0.68 (±0.07) Å between residues 93–104 of calmodulin and residues 1–12 of P2.
As already expected from the presence of helix-typical {i}CαH−{i+3}NH, {i}CαH−{i+3}CβH, and {i}CαH−{i+4}NH NOEs and small 3JHNα coupling constants, the calculated structures show a helical secondary structure from Ser-9 to Gln-16 with a regular i, i + 4 hydrogen bonding pattern. A greater structural variability is observed only for the very C-terminal part of this helix, as evidenced by the presence of alternative i, i + 3 hydrogen bonds for the amide protons of residues Ala-15 and Glu-16 in approximately 30% of the calculated structures. This finding, which indicates a higher conformational flexibility, is in good agreement with the 7.1 Hz 3JHNα coupling constant observed for Gln-16.
CD Measurements.
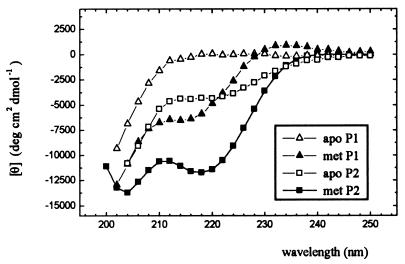
The CD spectrum of free P1 peptide is characteristic of the coil conformation (Fig. 4). That La3+-saturated peptide looks like a mixture of the coil component and the spectrum with a clearly visible minimum at 214 nm. Some small contribution from the α-helical conformation is visible in the spectrum of free P2 peptide. This contribution increases dramatically on La3+ ion binding.
Figure 4.
The CD spectra of P1 and P2 peptides at 1°C in 5 mM cacodylic buffer/0.1 M NaCl, pH 6.9. In the met state, the peptides were saturated by a 50-fold excess of lanthanum ions.
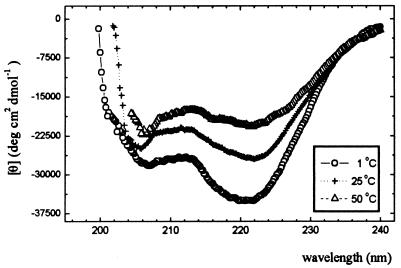
As we have already reported (16), the spectrum of La3+-saturated P1 peptide is temperature independent and, within error, remains the same with a temperature increase from 1°C to 80°C, indicating that the loop structure is very rigid. Therefore, the difference spectra of metal-saturated P2 and the loop alone (P1) can be expected (see Discussion) to provide direct specific information about the conformation of the P2 Ala-13—Gln-16 segment alone. Such difference spectra, measured at 1, 25, and 50°C, are shown in Fig. 5. Their general shape, with two minima at 206 and 222 nm, is characteristic for the pure α-helical structure.
Figure 5.
The temperature dependence of CD difference spectra of P2 minus P1 peptides in 5 mM cacodylic buffer, 0.1 M NaCl/pH 6.9.
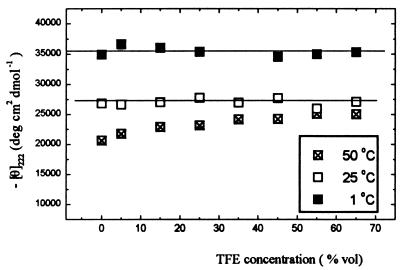
Within the temperature range for which the measurements have been performed (1–50°C), the CD spectrum of La3+-saturated P1 peptide does not change noticeably with TFE concentration. The P2–P1 difference values of mean residue ellipticity θ222 remain constant, within the error, at 1 and 25°C, and increase slightly with TFE concentration at 50°C (Fig. 6).
Figure 6.
CD difference signal P2 minus P1 peptides at 222 nm as the function of TFE concentration.
DISCUSSION
Calculation of the Helix Content.
The α-helical conformation of residues Ala-13—Gln-16 is not stabilized or by any specific interactions between the residue side chains or charge–helix dipole interactions. Only the C-cap effects (35) should be introduced into the original Zimm–Bragg equation (Eq. 1) to calculate the helix content. Because the helix is fully nucleated, σ = 1 and the statistical weight of an n-residue-long helix is given by the following expression:
 |
2 |
where n changes from 1 to 4, si denotes the propagation parameters of residues number i, and c13+n is the C-cap parameter of consecutive cap residues, including the terminal NH2 group.
Several sets of s parameters have been determined by using various model peptide systems (2). Because the amino acid composition of the peptide fragment studied by us is very close to that of the systems used by Baldwin and his collaborators (2), we will use the s and c values reported by them here (4, 35). The calculated helix contents in water and 40% TFE are shown in Table 4.
Table 4.
Helix fractions in A-13–Gln-16 segment of P2 peptide saturated with La3+ ions
| Temp., °C | Calculated*
|
From CD, k ≤ 4†
|
From CD, k = 4.5‡
|
|||
|---|---|---|---|---|---|---|
| H2O | 40% TFE | H2O | 40% TFE | H2O | 40% TFE | |
| 1 | 0.68 | 0.82 | 0.81 | 0.79 | 0.93 | 0.92 |
| 25 | 0.64 | 0.80 | 0.72 | 0.69 | 0.82 | 0.80 |
| 50 | 0.60 | 0.78 | 0.65 | 0.73 | 0.75 | 0.85 |
Estimation of the Helix Content from CD Measurements.
Determination of the helix content in very short peptides from CD measurements is not a trivial task. Long ago the chain-length dependence of CD spectra of the α-helical structure was predicted theoretically (36) and confirmed experimentally by analysis of protein CD spectra (37). The following empirical expression was proposed to describe the molar ellipticity, at any wavelength, of an α-helix built of r peptide units:
 |
3 |
where θ∞ is the molar peptide unit ellipticity of infinite α-helix and k a wavelength-dependent constant. Or, in terms of molar peptide unit ellipticities (θrh):
 |
4 |
Both types of values, Θ and θ, are given in the same units: deg⋅cm2⋅dmol−1. The only difference is that mol refers in one case to peptide concentration and in the other case to concentration of peptide units. Therefore, θrh = Θrh/r (compare Eqs. 3 and 4).
Numerous theoretical and experimental studies have been done to determine the precise values of θ∞ and k, particularly at 222 nm because the signal at this wavelength is used as a measure of helix fraction in peptides. The latest data obtained from studies of a large number of peptides in water and water–TFE mixtures have been published by Luo and Baldwin (38). According to them, k = 4 (their x parameter, equal to 3, refers to the number of residues in helical conformation and has to be increased by one, if the peptide groups are counted) and
 |
5 |
where t is the temperature in °C.
The CD signal at 222 nm of La3+-saturated peptide P1 (Θ2221) arises from the helical structure of the four C-terminal peptide groups beginning with that formed between Ser-9 and Ala-10 (Θ2224h) and from the rest of the loop (Θ222l):
 |
6 |
The contribution of the helical structure is small, if any, as evidenced by the spectrum shown in Fig. 4. At 230 nm, θ is close to zero, whereas in the CD spectrum of the α-helix it attains approximately half of the θ222 value. Therefore, the CD signal from short helices is indeed very small and k ≈ 4. In P2 peptide, the helix is longer and contains eight peptide groups.
 |
7 |
Therefore, the difference signal
 |
8 |
and the helix fraction fH in the Ala-13—Gln-16 segment should be calculated (38) from the equation:
 |
9 |
where θ222obs and θ222c are observed and coil mean peptide group ellipticities, respectively, and θ222h = θ222∞. Nevertheless, if k > 4, as reported by Gans et al. (39), Θ2221 = 0 and from Eq. 8 we obtain:
 |
10 |
In this case θ222h = θ222∞ (2−k/4).
Assuming that k ≤ 4, we can estimate the lowest limit of the helix fractions. They are shown in Table 4. In water, they are considerably higher than those calculated from Eq. 2, particularly at low temperature. The s parameters given by Rohl et al. (4) have to be multiplied by the factors of 2.1, 1.4, and 1.2 to obtain the helix contents determined at 1, 25, and 50°C, respectively. At 1°C, it corresponds to additional favorable contribution ΔΔGs of −400 cal/mol to ΔGs of each step of the helix propagation, and the total contribution to the Ala-13—Gln-16 helix stability can be evaluated at −1.6 kcal/mol.
The high helix content at 1 and 25°C is additionally confirmed by the fact that it does not increase with TFE concentration. The helix fractions determined in 40% TFE, assuming that k ≤ 4, are somewhat smaller than the calculated ones, which seems unreasonable. Even if ΔΔGs tends to zero in concentrated TFE solutions, it cannot be expected to exceed this value. In other words, there is no reason to believe that in our system TFE can really destabilize the helix. The helix fractions determined from the experiment are equal to, or greater than, the calculated ones for k = 4.5 (compare columns 3 and 7 in Table 4). In this case, though, the helix content at 1°C may exceed 90% and the helix would be additionally stabilized by ΔΔGs of as much as −1 kcal/mol. Further studies of peptides with the calcium-binding loop and helical segments of various length are needed to definitely elucidate the problem of CD spectra of very short helices and make it possible to determine more precisely the helix content in these peptides.
Unexpectedly High Stability of Prenucleated Helices.
Even with the lowest estimates of the helix content, it is evident that the helical conformation of the Ala-13—Gln-16 segment of P2 peptide is considerably more stable than predicted by the helix-coil transition theory and helix propagation parameters determined from studies of long polypeptide chains. This phenomenon cannot be accounted for by any specific interactions between the loop and the helix. The NMR structure of the peptide indicates that there are no contacts between the loop residues and the helix. Electrostatic interactions of La3+ ion and its ligands with the dipoles of C-terminal peptide groups beginning from Glu-12—Ala-13 are negligible. Calculations made by using the delphi program (40) have shown that their energy does not exceed −200 cal/mol (K. Pawłowski, unpublished results). Therefore, we have to conclude that what we observe is an intrinsic property of a nascent helix. Namely, that the s parameters describing the very first steps of helix propagation are greater than those characteristic for long helices. Apparently this effect is enthalpy driven, because −ΔΔGS drops with temperature increase.
What can the physical nature of this phenomenon be? We believe that it is related to hydration of the helix ends. The results of TFE titration experiments suggesting that −ΔΔGS drops to zero in concentrated TFE solutions point in this direction. The hypothesis explaining −ΔΔGS by helix end hydration effects has been presented by us in a previous paper (3). In short, the nonhydrogen bonded CO and NH groups at C- and N-termini of the α-helix, respectively, are perhaps better solvated when they are separated from each other in long helices than when they merge with each other in the helix nucleus. Therefore, the helix nucleation is related to an additional increase of hydration energy compensated during the first steps of the helix propagation that lead to separation of the helix ends. Unfortunately, we failed to verify this hypothesis by molecular dynamics calculations of helix end hydration energies. Even after long runs of simulations, the statistical errors of the calculated values were too large to allow for any conclusions. We hope that further studies will make it possible to confirm or dismiss this hypothesis.
Conclusions.
Calcium-binding loops from EF-hand proteins saturated with lanthanide ions nucleate extremely effectively the α-helical structure in peptide segments attached to their C termini. Short peptides containing such nucleation sites provide unique model systems to study the very first steps of helix propagation and to investigate in detail various specific interactions stabilizing or destabilizing the helical conformation, such as hydration of the helix ends or side chain–side chain interactions within the helix.
An important advantage of these systems lies in that they are built of natural amino acid residues. Therefore, they can be produced by using standard methods of molecular engineering. The material can be labeled with 15N and 13C nuclei to make it suitable for sophisticated NMR experiments. The calcium-binding loops attached to N-termini of protein fragments or proteins with N-terminal α-helices, e.g., globins, can be used to significantly increase their structural stability in the presence of lanthanide ions.
Acknowledgments
We thank Prof. P. S. Kim (Whitehead Institute, Massachusetts Institute of Technology) for synthesis of P2 peptide, Dr. J. Wojcik (Institute of Biochemistry and Biophysics, the Polish Academy of Sciences) for valuable discussions, and Prof. D. Roesch (Bayreuth University) for making NMR spectrometers available to us. M. Siedlecka acknowledges a scholarship of the Deutscher Akademischer Austauschdienst (DAAD).
ABBREVIATIONS
- NOE
nuclear Overhauser effect
- NOESY
NOE spectroscopy
- rmsd
root-mean-square deviation
- TFE
trifluoroethanol
Footnotes
This paper was submitted directly (Track II) to the Proceedings Office.
Data deposition: The atomic coordinates have been deposited in the Protein Data Bank, Biology Department, Brookhaven National Laboratory, Upton, NY 11973 (PDB ID code 1NKF).
References
- 1.Zimm B H, Bragg J K. J Chem Phys. 1959;31:526–535. [Google Scholar]
- 2.Chakrabartty A, Baldwin R L. Adv Protein Chem. 1995;46:141–176. [PubMed] [Google Scholar]
- 3.Bierzynski A, Pawłowski K. Acta Biochim Pol. 1997;44:423–432. [PubMed] [Google Scholar]
- 4.Rohl C A, Chakrabartty A, Baldwin R L. Protein Sci. 1996;5:2623–2637. doi: 10.1002/pro.5560051225. [DOI] [PMC free article] [PubMed] [Google Scholar]
- 5.Felix A M, Heimer E P, Wang C T, Lambros T J, Fournier A, Mowles T F, Maines S, Campbell R M, Wegrzynski B B, Toome V, et al. Int J Pept Protein Res. 1988;32:441–454. doi: 10.1111/j.1399-3011.1988.tb01375.x. [DOI] [PubMed] [Google Scholar]
- 6.Jackson D Y, King D S, Chmielewski J, Singh S, Schultz P G. J Am Chem Soc. 1991;113:9391–9392. [Google Scholar]
- 7.Chorev M, Roubini E, McKee R L, Gibbons S W, Goldman M E, Caulfield M P, Rosenblatt M. Biochemistry. 1991;30:5968–5974. doi: 10.1021/bi00238a022. [DOI] [PubMed] [Google Scholar]
- 8.Kemp D S, Boyd J G, Muendel C C. Nature (London) 1991;352:451–454. doi: 10.1038/352451a0. [DOI] [PubMed] [Google Scholar]
- 9.Osapay G, Taylor J W. J Am Chem Soc. 1992;114:6966–6973. [Google Scholar]
- 10.Zhou H X, Hull L A, Kallenbach N R. J Am Chem Soc. 1994;116:6482–6483. [Google Scholar]
- 11.Luo P, Braddock D T, Subramanian R M, Meredith S C, Lynn D G. Biochemistry. 1994;33:12367–12377. doi: 10.1021/bi00207a003. [DOI] [PubMed] [Google Scholar]
- 12.Groebke K, Renold P, Tsang K Y, Allen T J, McClure K F, Kemp D S. Proc Natl Acad Sci USA. 1996;93:4025–4029. doi: 10.1073/pnas.93.9.4025. [DOI] [PMC free article] [PubMed] [Google Scholar]
- 13.Ruan F, Chen Y, Hopkins P B. J Am Chem Soc. 1990;112:9403–9404. [Google Scholar]
- 14.Ghadiri M R, Fernholtz A K. J Am Chem Soc. 1990;112:9633–9635. [Google Scholar]
- 15.Precheur B, Bossus M, Gras-Masse H, Quiniou E, Tartar A, Craescu C T. Eur J Biochem. 1994;220:415–425. doi: 10.1111/j.1432-1033.1994.tb18639.x. [DOI] [PubMed] [Google Scholar]
- 16.Wojcik J, Goral J, Pawłowski K, Bierzynski A. Biochemistry. 1997;36:680–687. doi: 10.1021/bi961821c. [DOI] [PubMed] [Google Scholar]
- 17.Snyder E E, Buoscio B W, Falke J J. Biochemistry. 1990;29:3937–3943. doi: 10.1021/bi00468a021. [DOI] [PMC free article] [PubMed] [Google Scholar]
- 18.Marsden B J, Hodges R S, Sykes B D. Biochemistry. 1989;28:8839–8847. doi: 10.1021/bi00448a024. [DOI] [PubMed] [Google Scholar]
- 19.Dadlez M, Goral J, Bierzynski A. FEBS Lett. 1991;282:143–146. doi: 10.1016/0014-5793(91)80464-e. [DOI] [PubMed] [Google Scholar]
- 20.Scholtz J M, York E J, Stewart J M, Baldwin R L. J Am Chem Soc. 1991;113:5102–5104. [Google Scholar]
- 21.Chakrabartty A, Kortemme T, Baldwin R L. Protein Sci. 1994;3:843–852. doi: 10.1002/pro.5560030514. [DOI] [PMC free article] [PubMed] [Google Scholar]
- 22.Plateau P, Gueron M. J Am Chem Soc. 1982;104:7310–7311. [Google Scholar]
- 23.Griesinger C, Otting G, Wuthrich K, Ernst R R. J Am Chem Soc. 1988;110:7870–7872. [Google Scholar]
- 24.Jeener J, Meier B H, Bachmann P, Ernst R R. J Chem Phys. 1979;71:4546–4553. [Google Scholar]
- 25.Bax A, Griffey R H, Hawkins B L. J Magn Reson. 1983;55:301–315. [Google Scholar]
- 26.Wishart D S, Sykes B D, Richards F M. Biochemistry. 1992;31:1647–1651. doi: 10.1021/bi00121a010. [DOI] [PubMed] [Google Scholar]
- 27.Wishart D S, Sykes B D. J Biomol NMR. 1994;4:171–180. doi: 10.1007/BF00175245. [DOI] [PubMed] [Google Scholar]
- 28.Clore G M, Gronenborn M A, Nilges M, Ryan C A. Biochemistry. 1987;26:8012–8023. doi: 10.1021/bi00398a069. [DOI] [PubMed] [Google Scholar]
- 29.Brunger A T. x-plor Version 3.1. New Haven, CT: Howard Hughes Medical Institute and Yale University; 1993. [Google Scholar]
- 30.Nilges M, Gronenborn A M, Brunger A T, Clore G M. Protein Eng. 1988;2:27–38. doi: 10.1093/protein/2.1.27. [DOI] [PubMed] [Google Scholar]
- 31.Laskowski R A, MacArthur M W, Moss D S, Thornton J M. J Appl Crystallogr. 1993;26:283–291. [Google Scholar]
- 32.Kabsch W, Sander C. Biopolymers. 1983;22:2577–2637. doi: 10.1002/bip.360221211. [DOI] [PubMed] [Google Scholar]
- 33.Fasman G D. Handbook of Biochemistry and Molecular Biology. 3rd Ed. Vol. 1. Boca Raton, FL: CRC; 1976. [Google Scholar]
- 34.Wuthrich K. NMR of Proteins and Nucleic Acids. New York: Wiley; 1986. [Google Scholar]
- 35.Doig A J, Baldwin R L. Protein Sci. 1995;4:1325–1336. doi: 10.1002/pro.5560040708. [DOI] [PMC free article] [PubMed] [Google Scholar]
- 36.Woody R W, Tinoco I., Jr J Chem Phys. 1967;46:4927–4945. [Google Scholar]
- 37.Chen Y-H, Yang J T, Chau K H. Biochemistry. 1974;13:3350–3359. doi: 10.1021/bi00713a027. [DOI] [PubMed] [Google Scholar]
- 38.Luo P, Baldwin R L. Biochemistry. 1997;36:8413–8421. doi: 10.1021/bi9707133. [DOI] [PubMed] [Google Scholar]
- 39.Gans P J, Lyu P C, Manning M C, Woody R W, Kallenbach N R. Biopolymers. 1991;31:1605–1614. doi: 10.1002/bip.360311315. [DOI] [PubMed] [Google Scholar]
- 40.Sharp K A, Nicholls A. delphi Version 3.0. Columbia University, New York: Department of Biochemistry and Molecular Biology; 1989. [Google Scholar]
- 41.Scholtz J M, Marqusee S, Baldwin R L, York E J, Stewart J M, Santoro M, Bolen D W. Proc Natl Acad Sci USA. 1991;88:2854–2858. doi: 10.1073/pnas.88.7.2854. [DOI] [PMC free article] [PubMed] [Google Scholar]


