Abstract
Daptomycin exhibits in vitro bactericidal activity against clinically significant gram-positive bacteria. We employed pharmacodynamic modeling to determine a once-daily dosing regimen of daptomycin that correlates to pharmacodynamic endpoints for different resistant gram-positive clinical strains. An in vitro pharmacodynamic model with an initial inoculum of 6 log10 CFU/ml was used to simulate daptomycin regimens ranging in dose from 0 to 9 mg/kg of body weight/day, with corresponding exposures reflecting free-daptomycin concentrations in serum. Bacterial density was profiled over 48 h for two methicillin-resistant Staphylococcus aureus (MRSA-67 and -R515), two glycopeptide intermediate-resistant S. aureus (GISA-992 and -147398), and two vancomycin-resistant Enterococcus faecium (VREF-12366 and -SF12047) strains. A sigmoid dose-response model was used to estimate the effective dose required to achieve 50% (ED50) and 80% (ED80) bacterial density reduction at 48 h. Daptomycin MICs for study isolates ranged from 0.125 to 4 μg/ml. Model fitting resulted in an r2 of >0.80 for all tested isolates. Control growths at 48 h ranged from 7.3 to 8.5 log10 CFU/ml. Sigmoid relationships were not superimposable between categorical resistant species: ED50 and ED80 values were 1.9 and 3.1, 4.2 and 5.6, and 5.4 and 6.8 mg/kg for MRSA, GISA, and VREF isolates, respectively. Doses required to achieve ED50 and ED80 values correlated with MIC differences between tested organisms. Corresponding area under the concentration-time curve from 0 to 24 h/MIC exposure ratios demonstrated a wide range of ED80 values among the tested isolates. Doses ranging between 3 and 7 mg/kg produced significant bactericidal activity (ED80) against these multidrug-resistant S. aureus and E. faecium isolates.
The increasing prevalence of multidrug-resistant staphylococcal and enterococcal infections causes much concern. Infections due to methicillin-resistant Staphylococcus aureus (MRSA) have led to a significant increase in the use of vancomycin with the subsequent development of vancomycin-resistant Enterococcus faecium (VREF) and glycopeptide intermediate-susceptible S. aureus (GISA) (5, 7, 17, 20). The Centers for Disease Control and Prevention reported that, from 1989 to 1998, VREF nosocomial infections increased from 0.3 to 21.2% and from 0.4 to 22.6% in nonintensive and intensive care units, respectively (3). Left with limited therapeutic options, the medical establishment's search for optimal agents that provide extensive coverage against drug-resistant organisms, bactericidal activity, and favorable pharmacokinetics continues.
One potential option for the treatment of resistant gram-positive infections is daptomycin, a novel cyclic lipopeptide antibiotic currently being evaluated in clinical studies. Similar to vancomycin, it has broad activity against clinically significant gram-positive organisms but possesses some distinct advantages (16). Daptomycin's distinctiveness is a result of its activity against resistant organisms (including gram-positive organisms with reduced susceptibility to vancomycin), its unique mechanism of action (disruption of multiple aspects of plasma membrane function without penetration into the cytoplasm), the rare occurrence of spontaneous resistance, and its rapid concentration-dependent antimicrobial activity (2, 9, 13, 19; N. Safdar, D. R. Andes, and W. A. Craig, Abstr. 39th Intersci. Conf. Antimicrob. Agents Chemother., abstr. 1769, 1999). Daptomycin appears to be a promising therapeutic option for a wide variety of gram-positive infections. A once-daily regimen exploits daptomycin's concentration-dependent activity and significantly ameliorates the probability of accumulation-related adverse effects compared to multiple-dose regimens (15, 19). Further pharmacodynamic evaluation of potentially applicable once-daily doses for problematic drug-resistant organisms is needed.
MATERIALS AND METHODS
Bacterial strains.
A total of six strains were evaluated: two strains of methicillin-resistant S. aureus (MRSA-67 was obtained from the John D. Dingell VA Medical Center, Detroit, Mich., and MRSA-R515 was obtained from Detroit Medical Center University Laboratories, Detroit, Mich.), two strains of glycopeptide intermediate-resistant S. aureus (GISA-992 was obtained from the Centers for Disease Control and Prevention, Atlanta, Ga., and GISA-147398 was obtained from William Beaumont Hospital, Royal Oak, Mich.), and two strains of vancomycin-resistant Enterococcus faecium (VREF-SF12047 and VREF-12366 were obtained from William Beaumont Hospital).
Antimicrobial agents and media.
Daptomycin analytical powder was provided by Cubist Pharmaceuticals, Inc., Lexington, Mass. Mueller-Hinton broth supplemented with 75 mg of calcium/liter and 12.5 mg of magnesium/liter (SMHB) was used for all susceptibility experiments and in vitro pharmacodynamic simulations (6). Colony counts from samples were determined by using tryptic soy agar (TSA; Difco, Detroit, Mich.) plates. For microbioassay, Mueller-Hinton agar plates that were supplemented with 75 mg of calcium/liter, 0.1 M citric acid, and NaOH were used.
Susceptibility testing.
MICs of study antimicrobial agents were determined by broth microdilution according to the guidelines of the National Committee for Clinical Laboratory Standards, with the incorporation of SMHB as the broth medium due to the effects of calcium on daptomycin activity (14).
In vitro pharmacodynamic infection model.
A previously described in vitro pharmacodynamic infection model consisting of a 250-ml, one-compartment glass chamber with multiple ports for the removal of broth, delivery of antibiotics, and collection of bacterial and antimicrobial samples was utilized (8). All experiments were conducted in duplicate to ensure reproducibility. Prior to each experiment, bacterial colonies from an overnight growth on TSA were added to 0.9% sodium chloride solution to obtain a ∼108-CFU/ml suspension (0.5 McFarland standard, verified with a calorimeter). Then, 2.5 ml of diluted organism suspension (∼107) was added to each of the pharmacodynamic models to produce a starting inoculum of ∼106 CFU/ml. A peristaltic pump (Masterflex; Cole-Parmer Instrument Company, Chicago, Ill.) was used to continuously replace antibiotic-containing medium with fresh SMHB at a rate to simulate the 8-h half-life of daptomycin. The model was then placed in a 37°C water bath for the duration of the experiment, with magnetic stir bars in the medium to allow for continuous mixing. Temperature and pH of the pharmacodynamic system were monitored throughout the 48-h experiment periods (11).
Daptomycin was dosed across a range from 0 to 9 mg/kg of body weight/day (doses given every 24 h) with corresponding exposures reflecting approximate free-daptomycin concentrations based on its high affinity for protein (93% protein bound) (12; G. L. Brier, J. D. Wolny, and H. R. Black, Program Abstr. 29th Intersci. Conf. Antimicrob. Agents Chemother., abstr. 1347, 1989). Daptomycin's linear pharmacokinetics allowed the derivation of target peak concentrations as a proportion of dose based on an achievable total peak of 80 μg/ml from a 6.0-mg/kg dose (22). Adaptive feedback from the sigmoid model determined the sequential testing of regimens within the specified dosing range. Pharmacodynamic simulations in the absence of antibiotics (growth control) were performed over 48 h to ensure adequate growth of the organisms in the model.
Pharmacodynamic analysis.
Samples were drawn from each model at 0, 0.5, 1, 2, 4, 6, 8, 24, 28, 32, and 48 h and then diluted (10- to 10,000-fold) in cold 0.9% sodium chloride solution to minimize antibiotic carryover. Samples with low bacterial densities and high antibiotic concentrations underwent vacuum filtration, followed by bacterial quantification after plating and incubation of the filter on TSA. Bacterial densities of pharmacodynamic samples were determined by plating 50-μl samples of each diluted sample on TSA by using an automated spiral dispenser (WASP; Don Whitley Scientific Limited, West Yorkshire, England). Plated samples were incubated at 37°C for 24 h, and colony counts (log10 CFU/ml) were determined by using a laser bacteria colony counter (ProtoCOL, version 2.05.02; Synbiosis, Cambridge, England). The limit of detection for this method of colony count determination is 2.5 log10 CFU/ml. Time-kill curves were constructed by plotting mean colony counts (log10 CFU/ml) from each model versus time. Bactericidal activity (99.9% killing) was defined as a ≥3-log10 CFU/ml reduction in the colony count from that of the starting inoculum. The time to achieve a 99.9% bacterial load reduction was determined by linear regression (r2 ≥ 0.95) and confirmed by the observed bacterial log10 CFU/ml reductions of quantified samples.
Pharmacokinetic analysis.
Samples were obtained through the injection port at 0.5, 1, 2, 4, 8, 24, 32, and 48 h and stored at −70°C until ready for analysis for the determination of antibiotic concentrations. Daptomycin concentrations were determined by a modified microbioassay utilizing Micrococcus luteus ATCC 9341 (2). By using a vacuum with a modified agar cutter, a 4-mm-diameter well was cut into Mueller-Hinton agar that was supplemented with calcium and titrated with citric acid and/or NaOH to optimize inhibition zones. Each sample and standard was tested in triplicate by allowing complete diffusion into the agar prior to swabbing with a 0.5 McFarland suspension of the test organism. Plates were incubated for 18 to 24 h at 37°C prior to the determination of inhibition zone sizes by contrast camera imaging (Synoptics, Cambridge, United Kingdom). Concentrations of 10.0, 5.0, 1.25, and 0.3125 μg/ml were used as standards. This assay has a lower limit of detection of 0.3125 μg/ml and demonstrates an interday and intraday coefficient of variation of ≤10%. For troughs that fell below the detection limits, concentrations were determined by extrapolation with the modeled elimination rates from detectable concentrations. A one-compartment model with bolus-intravenous input and first-order elimination was applied by using PK Analyst (Micromath Research, St. Louis, Mo.) to determine elimination rates, free peak and trough concentrations, and free area under the concentration-time curves for the first 24-h dosing intervals (AUC24-free). AUC24-free was determined by trapezoidal area estimation.
Resistance.
One-hundred-microliter samples from the end of the experiments (48-h quantified samples) were plated on TSA plates containing four and eight times the MIC of the respective antibiotic to assess the development of resistance. Plates were then examined for the growth of potentially resistant colonies after 48 h of incubation at 35°C.
Dose-effect response.
Relationships between bacterial densities at 48 h and the dose and relationships between AUC24-free and MIC were examined by multivariate and nonlinear regression with a sigmoid Emax model based on the four-parameter Hill equation: Effect (log10 CFU/ml at 48 h) = E0 − (Emax × EDs)/(ED50s + EDs), where E0 represents the baseline effect (growth control), Emax represents the maximal antimicrobial effect, ED represents the exposure parameter of interest, ED50 is the value of the exposure parameter of interest that produced 50% of Emax, and s is the sigmoidicity exponent (10). A value representing 80% of the Emax, ED80, was calculated by determining the dose that correlated with 80% killing between the E0 and Emax levels from the regression output. This dose was extracted by the simulation of the nonlinear regression line. Each organism was modeled separately and together with its same categorical pair (MRSA, GISA, VREF). The criterion for model fitting was an r2 of >0.80. Dose-effect analyses were performed with SigmaPlot (version 6.1; SPSS, Inc., Chicago, Ill.) software.
RESULTS
Susceptibility and resistance testing.
Daptomycin MICs for study isolates MRSA-67, MRSA-R515, GISA-992, GISA-143798, VREF- SF12047, and VREF-12366 were 0.125, 0.25, 0.5, 0.5, 4, and 2, respectively. Plating of detectable samples from 48-h, end-of-study simulations revealed no resistant colonies on agar plates containing four or eight times the MIC of respective study isolates.
Pharmacodynamics.
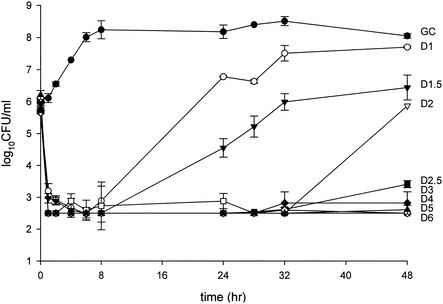
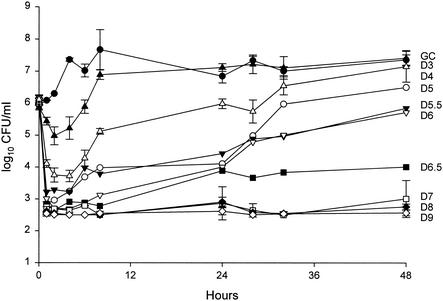
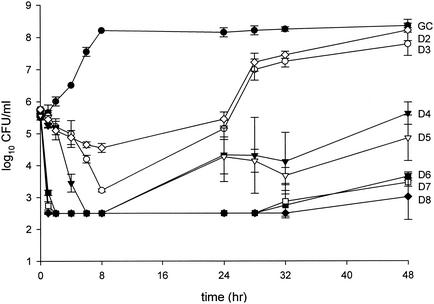
For the purposes of clarity, time-kill analyses for one representative isolate each of MRSA, GISA, and VREF are shown in Fig. 1 through 3. A total of 100 in vitro pharmacodynamic simulations were performed against the six study isolates: 34 against MRSA, 32 against GISA, and 34 against VREF. Growth control curves for each of the isolates ensured the adequate growth of organisms in the pharmacodynamic systems over the entire study duration of 48 h, evident by no growth diminution and adequate early logarithmic growth. Initial inoculums of all model simulations were within 0.5 log10 CFU/ml of the target 6 log10 CFU/ml, and standard deviations at sample time points were less than 1 log10 CFU/ml. Rapid and pronounced bactericidal activity (99.9% killing) to near-undetectable levels was noted for each model simulation for the majority of doses against all study strains. Bactericidal activity was often achieved by 1 h by all regimens of 5 mg/kg or greater against all tested isolates, while all daptomycin regimens achieved bactericidal activity by 1 h against MRSA. This was followed by observed regrowth at 24 h by some of the lower regimens, with the subsequent differentiation of all regimens at 48 h. Simulated dose regimens of 3 mg/kg and greater against MRSA, 6 mg/kg and greater against GISA, and 7 mg/kg and greater against VREF maintained bactericidal activity throughout the 48-h study duration.
FIG. 1.
Pharmacodynamic time-kill analysis of MRSA-67. GC, growth control; D1 through D6, daptomycin at dose regimens ranging from 1 to 6 mg/kg every 24 h.
FIG. 3.
Pharmacodynamic time-kill analysis of VREF-12366. GC, growth control; D3 through D9, daptomycin at dose regimens simulating 3 to 9 mg/kg every 24 h.
Pharmacokinetics.
Exposure and pharmacokinetic parameters are reported in Table 1. All achieved half-lives were within 10% of the targeted value of 8 h.
TABLE 1.
Results of pharmacokinetic analyses
| Dosing regimen (mg/kg) | No. of simulations | Parametera |
||
|---|---|---|---|---|
| Cp-free (μg/ml) | Ct-free (μg/ml) | AUC24-free (μg · h/ml) | ||
| 1.00 | 4 | 0.91 ± 0.04 | 0.12 ± 0.02 | 11 ± 2.1 |
| 1.50 | 4 | 1.56 ± 0.02 | 0.17 ± 0.01 | 13 ± 1.4 |
| 2.00 | 12 | 1.82 ± 0.05 | 0.22 ± 0.03 | 18 ± 2.8 |
| 2.50 | 4 | 2.41 ± 0.11 | 0.29 ± 0.03 | 22 ± 4.5 |
| 3.00 | 12 | 2.94 ± 0.21 | 0.37 ± 0.07 | 26 ± 2.8 |
| 3.50 | 4 | 3.22 ± 0.19 | 0.41 ± 0.05 | 31 ± 3.7 |
| 4.00 | 12 | 3.61 ± 0.07 | 0.45 ± 0.02 | 35 ± 5.0 |
| 5.00 | 12 | 4.58 ± 0.22 | 0.60 ± 0.07 | 41 ± 7.3 |
| 5.50 | 2 | 5.20 ± 0.15 | 0.65 ± 0.05 | 44 ± 8.9 |
| 6.00 | 12 | 5.95 ± 0.19 | 0.73 ± 0.09 | 47 ± 12.5 |
| 6.50 | 2 | 6.22 ± 0.11 | 0.76 ± 0.11 | 50 ± 8.1 |
| 7.00 | 8 | 6.60 ± 0.14 | 0.85 ± 0.07 | 56 ± 9.2 |
| 8.00 | 8 | 7.42 ± 0.29 | 0.90 ± 0.10 | 62 ± 16.2 |
| 9.00 | 4 | 8.51 ± 0.13 | 1.05 ± 0.11 | 81 ± 11.0 |
Cp-free, free peak concentration; Ct-free, free trough concentration. Values are presented as means ± standard deviations for all simulations.
Dose-effect response.
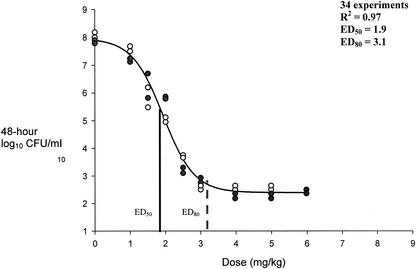
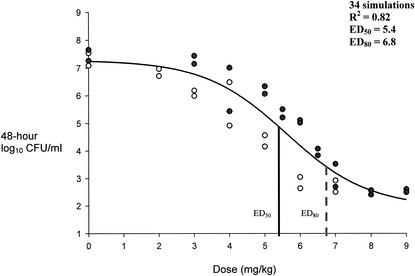
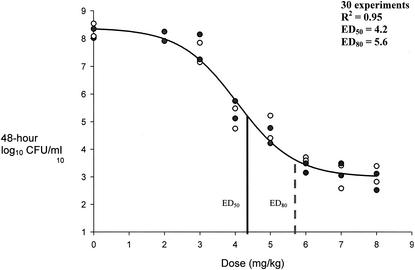
Sigmoid modeling results are presented in Fig. 4 through 6. Modeling of dose in milligrams per kilogram per 24-h versus 48-h bacterial densities resulted in correlation coefficients of 0.97, 0.95, and 0.82 for MRSA, GISA, and VREF, respectively. We chose to not weigh the observed estimates, since all but two residual values (1.15 and 1.29) from the regression output resulted in values of less than 1 between the observed and predicted estimates for low and high y values. Sigmoid curves for the two MRSA strains were superimposable with resultant equal-effect parameters. Effect parameters were similarly equal for GISA isolates. As shown in Fig. 6, the resultant sigmoid curves for the two VREF isolates were not superimposable. Subsequent differences between the effect parameters of the two isolates were 0.5 and 0.9 for ED50 (5.1 for VREF-12366 and 5.6 for VREF-SF12047) and ED80 (6.1 for VREF-12366 and 7.0 for VREF-SF12047) values, respectively. Due to the small differences between sigmoid curves (shown in Fig. 6), both VREF isolates were modeled together. Reported Emax modeling in Fig. 4 through 6 represents the combination of each of the categorical isolates since they were adequately (<1-mg/kg dose differential in effect parameters) superimposable. Baseline values that represent the growth control levels for MRSA, GISA, and VREF were 7.9, 8.2, and 7.3, respectively. Respective ED50 and ED80 values for MRSA, GISA, and VREF were 1.9 and 3.1, 4.2 and 5.6, and 5.4 and 6.8 mg/kg, respectively. Sigmoid modeling of 48-h bacterial densities versus AUC24-free/MIC ratios resulted in ED50 and ED80 values of 79 and 95, 157 and 189, 76 and 106, 76 and 106, 33 and 42, and 16.5 and 21 for strains MRSA-67, MRSA-R515, GISA-992, GISA-147398, VREF-12366, and VREF-SF12047, respectively. Correlation coefficients ranged from 0.94 to 0.98 for dose-effect modeling of 48-h bacterial densities versus AUC24-free/MIC ratios.
FIG. 4.
Pharmacokinetic-pharmacodynamic dose modeling to effect for MRSA isolates. ED50, dose correlating to 50% bacterial density reduction from growth control; ED80, dose correlating to 80% bacterial density reduction from growth control. •, MRSA-67 bacterial densities at 48 h; ○, MRSA-R515 bacterial densities at 48 h.
FIG. 6.
Pharmacokinetic-pharmacodynamic dose modeling to effect for VREF isolates. ED50, dose correlating to 50% bacterial density reduction from growth control; ED80, dose correlating to 80% bacterial density reduction from growth control. •, VREF-12366 bacterial densities at 48 h; ○, VREF-SF12047 bacterial densities at 48 h.
DISCUSSION
Optimal modeling of the Emax model requires characterization of the entire sigmoidal, nonlinear curve, including both the minimal and maximal effects based on an array of data points that represent the initial baseline and lower part of the curve (where low drug exposure correlates with a bacteriostatic effect over 48 h), the linear portion of the curve (where the largest effect is observed relative to a given drug exposure and contains the ED50 that produces 50% of the maximal effect), and the plateau (where the maximal effect is observed independent of increasing drug exposure and where the law of diminishing returns applies, resembling a saturable process in Michaelis-Menten enzyme kinetics) (10). In this study, sigmoid Emax modeling provided a clear definition of the dose-response relationship for daptomycin, based on favorable correlation coefficients (>0.80). Regrowth of study isolates for low-dose simulations was noted at 24 h and continued to greater densities by 48 h, allowing further delineation of the effects and improved characterization of the entire effect spectrum in comparison to 24-h densities. Sigmoid curves were superimposable for each pair of MRSA and GISA isolates, with insignificant intraspecies differences between effect parameters (i.e., both MRSA isolates shared the same ED50 and ED80), suggesting that potential exposure requirements are similar for similar species with similar vancomycin susceptibilities. A slight but insignificant difference was noted between the two VREF isolates based on a <1-mg/kg dose differential between the effect parameters. Furthermore, the similarity of the sigmoid curves for pairs of isolates when the dose was modeled suggests that dose does not scale with MIC. Subsequent sigmoid modeling with AUC24-free/MIC ratios resulted in distinct effect parameters between all study isolates that were primarily due to MIC differences. As expected, an increased incremental dose requirement paralleling MICs was noted for MRSA, GISA, and VREF. Although less likely, more laborious pharmacodynamic evaluations against a wide distribution of susceptibilities may be needed to confirm interspecies differences in exposure requirements.
The rapid in vitro bactericidal activity of daptomycin has been well described (2, 16; A. Louie, P. Kaw, W. Liu, N. L. Jumbe, G. Vasudevan, M. H. Miller, and G. L. Drusano, Abstr. 39th Intersci. Conf. Antimicrob. Agents Chemother., abstr. 1770, 1999). In this study, we observed a very rapid and pronounced kill, often to undetectable limits, with simulations against drug-resistant, gram-positive isolates even at lower dosing regimens. This bactericidal activity was usually maintained for the experiment duration by the upper half of the study dosing range (4 to 8 mg/kg every 24 h). Emax modeling was applied to 48-h densities to account for both regrowth and continued bactericidal activity. The Emax model further elucidates the ability of daptomycin to attain pronounced bactericidal levels. The high sigmoidicity in the Emax curves suggest that the threshold for attaining bactericidal levels is relatively low and easily attainable once the ED50 is surpassed.
Despite the achievement of early bactericidal activity, significant regrowth was observed by 48 h with smaller dosing regimens despite the administration of a second dose (given at 24 h). Although we observed a multifold concentration exposure with smaller dosage simulations (i.e., against staphylococci), regrowth can be explained by inadequate overall drug exposure (AUC24-free/MIC or Cmax-free/MIC ratios) for the continued suppression of bacterial densities but enough for an initial bacterial kill due to the concentration-dependent activity of daptomycin. The lack of effect of the second dose may be due to a variety of possible factors. We believe that this may be attributed to slight changes in the bacterial population subsequent to low antimicrobial exposures. There is the possibility of a highly susceptible portion of a heterogeneic bacterial population possibly accounting for the majority of the initial bacterial densities that is killed off (i.e., 0- to 8-h observations, with the initial dose at 0 h), leaving a more resilient portion of the population that may grow despite the rechallenging of a second dose. This concept was retrospectively tested in duplicate by simulating daptomycin at 1 mg/kg/24 h against MRSA-67 (daptomycin MIC = 0.125 μg/ml) in an in vitro model, accompanied by subpopulation analysis by previously reported methods (1). Samples from 0 and 24 h were immediately plated onto antibiotic-containing agar plates (0.500, 0.375, 0.250, 0.180, 0.125, 0.088, 0.063, 0.031, 0.016, and 0 μg/ml) and quantified. No significant differences (>1 log10 CFU/ml) were observed between sample populations and can be weakly explained by the need for a single passage, a limited sampling strategy, low concentration-related dilutional errors, and methodological inadequacies. The differential effects of daptomycin on bacterial growth phases are remote and also difficult to confirm by real-time phase determination measures during model simulations (11).
This phenomenon can also be due to the inherent procedural aspects of this study. Due to the large number of simulations and subsequent samples, we chose to test significant levels of resistance from 48-h samples at four and eight times the MIC, rendering the detection of smaller incremental changes impossible, which would explain some of the regrowth phenomenon and the lack of effect of subsequent small concentration exposures. Also, the inherent nature of our resistance screening required a single passage of the sample prior to the application to antibiotic-containing medium, allowing for the potential reversion of elevated MICs to preexposure MICs. There is the remote possibility that a dilutional error was made during serial dilution in bacterial quantification assessments. In addition, limiting sampling strategies in this study may have prevented the observation of any potentially small bacterial reductions by the second dose at 24 h over the period of 24 to 28 h. We also accept that this phenomenon could also be an inherent artifact of the model due to the potential adhesion of bacteria to the tubing, with subsequent reinoculation of the central compartment during sampling; pooling of bacteria at the edge of the meniscus, where there may be limited antimicrobial distribution; possible biofilm production; and other biological or physical situations that favor protected microenvironments for bacteria. For a complete characterization of this phenomenon, further intricate microbiologic investigation is required.
The dose requirement to achieve 80% maximal kill activity was 3 mg/kg against both MRSA isolates. This equates an AUC24-free of approximately 26 with a corresponding AUC24-total of approximately 370, based on 93% protein binding. The subsequent AUC24-total/MIC ratio (2,960 and 1,480 for the two MRSA isolates in this study) substantially exceeds the previously established breakpoint of 516 for the 80% maximal kill target, which was determined against S. aureus isolates exhibiting daptomycin MICs of less than 1 μg/ml (J. Legget, K. Totsuka, S. Ebert, B. Vogelman, and W. A. Craig, Program Abstr. 27th Intersci. Conf. Antimicrob. Agents Chemother., abstr. 154, 1987). However, overall AUC24-free/MIC ratios that represent ED80 values ranged from approximately 16.5 to 189 for all study isolates. This wide disparity in ratios was due mostly to the MIC in the denominator. Consequently, significantly lower AUC24-free/MIC ratios were required against the VREF isolates than those required against the MRSA isolates to achieve the 80% maximal kill target. Overall, there was an incrementally higher dose requirement to achieve the ED50 and ED80 for MRSA, GISA, and VREF, respectively. Rather than the species, the increasing dose requirements were more likely due to the expression of higher daptomycin MICs.
In conclusion, daptomycin exhibited pronounced activity against drug-resistant gram-positive isolates (MICs ranging from 0.125 to 4.0 μg/ml), as evidenced by the rapid bactericidal activity and lack of resistance development despite subinhibitory antimicrobial pressure (particularly against VREF). Bactericidal levels were achieved and maintained within the dosing range of 3 to 7 mg/kg given every 24 h for the drug-resistant gram-positive isolates evaluated in this study, suggesting that the coverage of the potential clinical 6-mg/kg dose given every 24 h may be adequate for a wide range of drug-resistant gram-positive infections.
FIG. 2.
Pharmacodynamic time-kill analysis of GISA-992. GC, growth control; D2 through D8, daptomycin at dose regimens simulating 2 to 8 mg/kg every 24 h.
FIG. 5.
Pharmacokinetic-pharmacodynamic dose modeling to effect for GISA isolates. ED50, dose correlating to 50% bacterial density reduction from growth control; ED80, dose correlating to 80% bacterial density reduction from growth control. •, GISA-992 bacterial densities at 48 h; ○, GISA-147398 bacterial densities at 48 h.
REFERENCES
- 1.Aeschlimann, J. R., Hershberger, E., and M. J. Rybak. 1999. Analysis of vancomycin population susceptibility profiles, killing activity, and postantibiotic effect against vancomycin-intermediate Staphylococcus aureus. Antimicrob. Agents Chemother. 43:1914-1918. [DOI] [PMC free article] [PubMed] [Google Scholar]
- 2.Akins, R. L., and M. J. Rybak. 2000. In vitro activities of daptomycin, arbekacin, vancomycin, and gentamicin alone and/or in combination against glycopeptide intermediate-resistant Staphylococcus aureus in an infection model. Antimicrob. Agents Chemother. 44:1925-1929. [DOI] [PMC free article] [PubMed] [Google Scholar]
- 3.Centers for Disease Control and Prevention. 1998. Summary of notifiable diseases, United States. Morb. Mortal. Wkly. Rep. 47:19.
- 4.Centers for Diseases Control and Prevention. 1997. Interim guidelines for prevention and control of staphylococcal infection associated with reduced susceptibility to vancomycin. Morb. Mortal. Wkly. Rep. 46:626-628, 635. [PubMed]
- 5.Garrett, D. O., E. Jochimsen, K. Murfitt, B. Hill, S. McAllister, P. Nelson, R. V. Spera, R. K. Sall, F. C. Tenover, J. Johnston, B. Zimmer, and W. R. Jarvis. 1999. The emergence of decreased susceptibility to vancomycin in Staphylococcus epidermidis. Infect. Control Hosp. Epidemiol. 20:167-170. [DOI] [PubMed] [Google Scholar]
- 6.Hanberger, H., L. E. Nilsson, R. Maller, and B. Isaksson. 1991. Pharmacodynamics of daptomycin and vancomycin on Enterococcus faecalis and Staphylococcus aureus demonstrated by studies of initial killing and postantibiotic effect and influence of Ca2+ and albumin on these drugs. Antimicrob. Agents Chemother. 35:1710-1716. [DOI] [PMC free article] [PubMed] [Google Scholar]
- 7.Hospital Infection Control Practices Advisory Committee. 1995. Recommendations for preventing the spread of vancomycin resistance. Morb. Mortal. Wkly. Rep. 44:1-13. [PubMed] [Google Scholar]
- 8.Houlihan, H. H., D. P. Stokes, and M. J. Rybak. 2000. Pharmacodynamics of vancomycin and ampicillin alone and in combination with gentamicin once-daily or thrice-daily against Enterococcus faecalis in an in vitro infection model. J. Antimicrob. Chemother. 46:79-86. [DOI] [PubMed] [Google Scholar]
- 9.Kaatz, G. W., S. M. Seo, V. N. Reddy, E. M. Bailey, and M. J. Rybak. 1990. Daptomycin compared with teicoplanin and vancomycin for therapy of experimental Staphylococcus aureus endocarditis. Antimicrob. Agents Chemother. 34:2081-2085. [DOI] [PMC free article] [PubMed] [Google Scholar]
- 10.Lalonde, R. L. 1992. Pharmacodynamics, p. 4.1-4.33. In W. E. Evans, J. J. Schentag, and W. J. Jusko (ed.), Applied pharmacokinetics, 3rd ed. Applied Therapeutics, Inc., Vancouver, Wash.
- 11.Lamp, K. C., M. J. Rybak, E. M. Bailey, and G. W. Kaatz. 1992. In vitro pharmacodynamic effects of concentration, pH, and growth phase on serum bactericidal activities of daptomycin and vancomycin. Antimicrob. Agents Chemother. 36:2709-2714. [DOI] [PMC free article] [PubMed] [Google Scholar]
- 12.Lee, B. L., M. M. Sachdeva, and H. F. Chambers. 1991. Effect of protein binding of daptomycin on mice and antibacterial activity. Antimicrob. Agents Chemother. 35:2505-2508. [DOI] [PMC free article] [PubMed] [Google Scholar]
- 13.Mobarakai, N., J. M. Quale, and D. Landman. 1994. Bactericidal activities of peptide antibiotics against multi-drug-resistant Enterococcus faecium. Antimicrob. Agents Chemother. 38:385-387. [DOI] [PMC free article] [PubMed] [Google Scholar]
- 14.National Committee for Clinical Laboratory Standards. 2000. Methods for dilution antimicrobial susceptibility tests for bacteria that grow aerobically, 5th ed. Approved standard M100-S10/M7. NCCLS, Villanova, Pa.
- 15.Oleson, F. B., Jr., C. L. Berman, J. B. Kirkpatrick, K. S. Regan, J. Lai, and F. P. Tally. 2000. Once-daily dosing in dogs optimizes daptomycin safety. Antimicrob. Agents Chemother. 44:2948-2953. [DOI] [PMC free article] [PubMed] [Google Scholar]
- 16.Rybak, M. J., E. Hershberger, T. Moldovan, and R. G. Grucz. 2000. In vitro activities of daptomycin, vancomycin, linezolid, and quinupristin-dalfopristin against staphylococci and enterococci, including vancomycin-intermediate and -resistant strains. Antimicrob. Agents Chemother. 44:1062-1066. [DOI] [PMC free article] [PubMed] [Google Scholar]
- 17.Schwalbe, R. S., J. T. Stapleton, and P. H. Gilligan. 1987. Emergence of vancomycin resistance in coagulase-negative staphylococci. New Engl. J. Med. 316:927-931. [DOI] [PubMed] [Google Scholar]
- 18.Sieradzki, K., and A. Tomasz. 1997. Inhibition of cell wall turnover and autolysis by vancomycin in a highly vancomycin-resistant mutant of Staphylococcus aureus. J. Bacteriol. 179:2557-2566. [DOI] [PMC free article] [PubMed] [Google Scholar]
- 19.Tally, F. P., and M. F. Debruin. 2000. Development of daptomycin for gram-positive infections. J. Antimicrob. Chemother. 46:523-526. [DOI] [PubMed] [Google Scholar]
- 20.Tenover, F. C., M. V. Lancaster, B. C. Hill, C. D. Steward, S. A. Stocker, G. A. Hancock, C. M. O'Hara, N. C. Clark, and K. Hiramatsu. 1998. Characterization of staphylococci with reduced susceptibilities to vancomycin and other glycopeptides. J. Clin. Microbiol. 36:1020-1027. [DOI] [PMC free article] [PubMed] [Google Scholar]
- 21.Wenzel, R. P., and M. B. Edmond. 1998. Vancomycin-resistant Staphylococcus aureus: infection control considerations. Clin. Infect. Dis. 27:245-251. [DOI] [PubMed] [Google Scholar]
- 22.Woodworth, J. R., E. H. Nyhart, Jr., G. L. Brier, J. D. Wolny, and H. R. Black. 1992. Single-dose pharmacokinetics and antibacterial activity of daptomycin, a new lipopeptide antibiotic, in healthy volunteers. Antimicrob. Agents Chemother. 36:318-325. [DOI] [PMC free article] [PubMed] [Google Scholar]


