Abstract
The pharmacokinetics and pharmacodynamics of oritavancin (LY333328), a glycopeptide antibiotic with concentration-dependent bactericidal activity against gram-positive pathogens, in a neutropenic-mouse thigh model of Staphylococcus aureus infection were studied. Plasma radioequivalent concentrations of oritavancin were determined by using [14C]oritavancin at doses ranging from 0.5 to 20 mg/kg of body weight. Peak plasma radioequivalent concentrations after an intravenous dose were 7.27, 12.56, 69.29, and 228.83 μg/ml for doses of 0.5, 1, 5, and 20 mg/kg, respectively. The maximum concentration of drug in serum (Cmax) and the area under the concentration-time curve (AUC) increased linearly in proportion to the dose. Neither infection nor neutropenia was seen to affect the pharmacokinetics of oritavancin. Intravenous administration resulted in much higher concentrations in plasma than the concentrations obtained with subcutaneous administration. Single-dose dose-ranging studies suggested a sigmoid maximum effect (Emax) dose-response relationship, with a maximal effect evident at single doses exceeding 2 mg/kg. The oritavancin dose (stasis dose) that resulted in a 24-h colony count similar to the pretreatment count was 1.53 (standard error [SE], 0.35) mg/kg. The single oritavancin dose that resulted in 50% of maximal bacterial killing (ED50) was 0.95 (SE, 0.20) mg/kg. Dose fractionation studies suggested that single doses of 0.5, 1, 2, 4, and 16 mg/kg appeared to have greater bactericidal efficacy than the same total dose subdivided and administered multiple times during the 24-h treatment period. When using an inhibitory Emax model, Cmax appears to correlate better with bactericidal activity than do the time during which the concentration in plasma exceeds the MIC (T>MIC) and AUC. These data suggest that optimal oritavancin dosing strategies will require regimens that favor high Cmax concentrations rather than long periods during which unbound concentrations in plasma exceed the MIC.
The recent emergence of enterococci and staphylococci with reduced susceptibility to vancomycin (16, 23) has highlighted the need for improved infection control measures (24) and the development of new antibiotic agents (20). Oritavancin, a semisynthetic glycopeptide derived from the N alkylation of the naturally occurring glycopeptide LY264826 (A82846B) (7), has a broad spectrum of activity against gram-positive cocci (25), including glycopeptide-resistant enterococci and Staphylococcus aureus strains with intermediate susceptibility to glycopeptides (1, 18). Oritavancin also displays several in vitro properties that distinguish it from vancomycin, including in vitro concentration-dependent bactericidal activity against S. aureus and enterococci (6, 18, 26, 27), activity against intracellular gram-positive bacteria (3, 4), a prolonged postantibiotic effect (5), and elevated serum protein binding (P. A. Rowe and T. J. Brown, Abstr. AAPS Annu. Meet. Expo., 2001). Pharmacokinetic studies suggest that oritavancin possesses a long plasma half-life in animal models (Y. Lin, R. E. Stratford, L. L. Zornes, W. L. Confer, V. Vasudevan, T. W. Jones, T. I. Nicas, D. A. Preston, C. J. Boylan, D. L. Zeckner, B. J. Boyll, P. A. Raab, N. J. Snyder, M. J. Zweifel, S. C. Wilkie, M. J. Rodriguez, R. C. Thompson, and R. D. G. Cooper, Abstr. 35th Intersci. Conf. Antimicrob. Agents Chemother., 1995) and in healthy volunteers (J. Chien, S. Allerheiligen, D. Phillips, B. Cerimele, and H. R. Thomasson, Abstr. Intersci. Conf. Antimicrob. Agents Chemother., 1998; H. R. Thomasson, D. Phillips, B. P. Smith, J. Y. Chien, Abstr. 9th Eur. Congr. Clin. Microbiol. Infect. Dis., Berlin, Germany, 1999, abstr. P191, 1999).
The present study uses a neutropenic-mouse thigh model of S. aureus infection to characterize oritavancin pharmacokinetics in mice and explore the relationship between relevant pharmacodynamic indices (maximum concentration of drug in serum [Cmax], time during which the concentration of drug in plasma exceeds the MIC [T>MIC], and area under the concentration-time curve [AUC]) and in vivo efficacy. This report expands on preliminary results presented previously (C. J. Boylan, K. Campanale, T. R. Parr, Jr., D. Phillips, T. Nicas, and M. Zeckel, Abstr. 38th Intersci. Conf. Antimicrob. Agents Chemother., abstr. A-041, 1998).
MATERIALS AND METHODS
Animals.
Six-week-old specific-pathogen-free ICR female mice (Harlan Sprague-Dawley, Indianapolis, Ind.) weighing 19 to 21 g were used for all studies. Animals were cared for in accordance with the National Institutes of Health Guide for the Care and Use of Laboratory Animals guidelines in a facility accredited by the American Association of Laboratory Animal Care, International. The Eli Lilly and Company Institutional Animal Care and Use Committee approved all of the experimental protocols.
Antimicrobial agents.
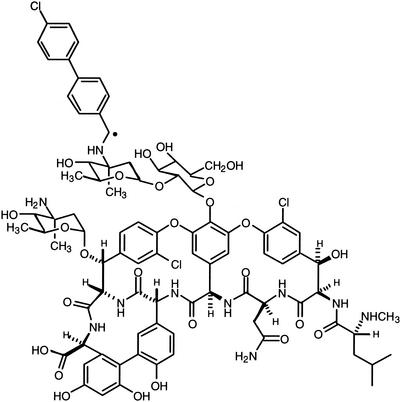
Clinical laboratory standards of oritavancin and vancomycin were supplied by Eli Lilly and Company (Indianapolis, Ind.) and were prepared for intravenous and subcutaneous administration in 5% dextrose in water or sterile water for injection (USP) immediately before each experiment. Radiolabeled oritavancin (14C-LY333328) (Fig. 1) was synthesized by Eli Lilly and Company. All intravenous injections were administered through the dorsal tail vein.
FIG. 1.
Oritavancin. •, position of 14C radiolabel.
Microorganisms.
S. aureus strain ATCC 13709 (American Type Culture Collection, Rockford, Md.) was used for all studies; for this strain the MIC of oritavancin and that of vancomycin were 0.5 μg/ml. MICs were determined in brain heart infusion (BHI) broth by using a broth microdilution method described by the NCCLS (19). The bacteria were stored at −70°C in BHI broth. Fresh isolates were prepared from overnight cultures grown on BHI (Difco, Detroit, Mich.) agar. Colonial growth was suspended in saline, adjusted to a density of approximately 108 cells/ml, and then diluted 1:100 in BHI broth.
Neutropenic-mouse thigh model of S. aureus infection.
The neutropenic-mouse thigh model outlined by Craig et al. (9) was used. Mice were made neutropenic (<100 polymorphonuclear leukocytes/mm3) by treatment with cyclophosphamide (Sigma Chemical Company, St. Louis, Mo.) (150 and 100 mg/kg of body weight administered intraperitoneally 4 days and 1 day [days −4 and −1] prior to infection). Mice were anesthetized briefly with approximately 4% isoflurane just prior to inoculation. The bacterial suspension (0.1 ml) was injected intramuscularly into each thigh (approximately 105 CFU/thigh). In all studies, treatment was initiated approximately 1 h following bacterial inoculation. Upon completion of the study, the animals were humanely sacrificed by CO2 asphyxiation. The entire thigh muscle mass including the bone was homogenized (Polytron; Kinematica AG) and decimally diluted in 0.9% saline (five 10-fold serial dilutions were performed for each homogenate), and 10-μl aliquots were plated on BHI agar. Following overnight incubation at 35°C, CFU were enumerated for each thigh and expressed as log10 CFU per thigh. The limit of detection was ≤2.95 log CFU/ml.
Analytical methods for plasma and tissue concentration determinations.
Plasma radioequivalent concentrations were measured by liquid scintillation counting or by scintillation counting of trapped 14CO2 after combustion of dried samples. These concentrations were subsequently used to determine the reported pharmacokinetic parameters. No metabolites of oritavancin were detected by using radiochromatographic profiling of plasma; therefore, radioequivalent concentrations measured in these studies were considered equivalent to oritavancin concentrations. In the evaluation of the dose proportionality of oritavancin in the plasma of mice after single intravenous doses, three aliquots of plasma were placed into scintillation vials. After the addition of liquid scintillation fluid, samples were assayed by using liquid scintillation counting. Plasma samples from infected mice were also analyzed by liquid scintillation counting. In the determination of plasma radioequivalent concentrations for determining the pharmacokinetics after subcutaneous versus intravenous dosing and in immune-suppressed versus non-immune-suppressed mice, three aliquots of each plasma sample were placed into separate combustion thimbles after collection and allowed to dry overnight. Plasma radioequivalent concentrations were measured by scintillation counting of trapped 14CO2 after combustion of dried samples. Samples were combusted in a Packard Sample Oxidizer Model 307 (Packard Instruments, Meriden, Conn.). Thigh or thigh homogenate radioequivalent concentrations were also measured after combustion of dried samples. For thigh homogenate samples, homogenates were prepared as described above (see “Neutropenic-mouse thigh model of S. aureus infection”). Homogenate aliquots were then placed into combustion thimbles and weighed. For thigh tissue concentration measurements, each thigh sample (the entire muscle mass, including the bone, from each thigh) was placed into a combustion thimble and weighed. All samples were allowed to dry overnight and were then combusted. To confirm the specific activity of the dose solution used in these studies, five aliquots of dose solution were placed into scintillation vials and assayed by using liquid scintillation counting.
Dosing regimens.
A total of three studies were performed: (i) pharmacokinetic studies; (ii) single-dose dose-ranging studies of oritavancin and vancomycin; and (iii) oritavancin dose fractionation studies to explore the relationship between pharmacodynamic indices and efficacy, expressed as CFU/thigh. Pharmacokinetic studies using [14C]oritavancin involved administration of the following single doses: 0.5, 1, 5, and 20 mg/kg (n = 1/time point). At the 20-mg/kg dose, the concentrations of oritavancin in the plasma of neutropenic versus nonneutropenic animals, those following subcutaneous versus intravenous administration, and those of neutropenic-infected versus neutropenic-uninfected animals were compared. The single-dose dose-ranging studies involved single-dose intravenous administration of 0.25, 0.5, 0.75, 1, 2, 4, 5, 10, 16, and 20 mg of oritavancin/kg. In dose fractionation studies the single dose was administered at 1 h postinfection, and doses divided in two, three, and four subdoses were administered twice daily, three times daily, and four times daily, respectively, as outlined in Table 1.
TABLE 1.
Calculated pharmacokinetic and pharmacodynamic variables for various dosage regimens tested in the dose fractionation studiesa
| Total dose (mg/kg/24 h) | Dose (mg/kg) | Time point(s) (h) | Cmax | T > MIC | AUC0-24 |
|---|---|---|---|---|---|
| 0.5 | 0.167 | 0, 8, and 16 | 0.37 | 0.00 | 2.13 |
| 0.25 | 0 and 12 | 0.53 | 0.25 | 2.16 | |
| 0.5 | 0 | 1.03 | 0.50 | 2.14 | |
| 1.0 | 0.25 | 0, 6, 12, and 18 | 0.59 | 0.75 | 4.19 |
| 0.33 | 0, 8, and 16 | 0.74 | 0.75 | 4.24 | |
| 0.5 | 0 and 12 | 1.06 | 1.25 | 4.31 | |
| 1.0 | 0 | 2.06 | 2.50 | 4.29 | |
| 2.0 | 0.666 | 0, 8, and 16 | 1.48 | 4.50 | 8.48 |
| 1.0 | 0 and 12 | 2.11 | 5.50 | 8.62 | |
| 2.0 | 0 | 4.11 | 5.50 | 8.58 | |
| 4.0 | 1.0 | 0, 6, 12, and 18 | 2.35 | 14.25 | 16.74 |
| 4 | 0 | 8.23 | 8.25 | 17.16 | |
| 16.0 | 4.0 | 0, 6, 12, and 18 | 9.40 | 24.00 | 66.96 |
| 16 | 0 | 32.90 | 14.25 | 68.62 |
Concentrations represent free (unbound) concentrations, assuming 85% protein binding (mouse plasma protein binding estimated using human data).
Pharmacokinetic sample collection.
Heparinized whole blood was collected via cardiac puncture at one or more of the following time points: 0.083, 0.25, 0.5, 1, 2, 4, 6, 8, 12, 18, 24, 36, and 48 h after the administration of [14C]oritavancin. Plasma was separated by centrifugation, placed into individual centrifuge tubes, and stored at approximately −70°C until analysis. Thigh tissue was collected for CFU determinations and/or determinations of amounts of [14C]oritavancin in tissue at one or more of the following time points: 0, 8, 12, 24, 48, 72, and 96 h after administration of [14C]oritavancin. To harvest the thighs, the skin from the hind leg of each euthanatized mouse was removed and the hind leg was then separated at the hip joint. Thigh samples for CFU determination were processed immediately, whereas thigh samples for the measurement of tissue radioequivalent concentrations were stored at approximately −70°C until analysis.
Data analysis and calculations.
Radioequivalent concentrations of oritavancin in plasma, thigh, and/or thigh homogenate were determined. Pharmacokinetic parameters were calculated by using the proprietary (Eli Lilly and Company) ADME/PTK computer software application. The pharmacokinetic parameters calculated include peak concentration in plasma, half-life, and AUC. The AUC was calculated by using the linear trapezoidal rule. The nonlinear-fit algorithm of JMP 4.1 statistical software (SAS Institute Inc., Cary, N.C.) was used to fit a two-compartment pharmacokinetic model to data of concentration in plasma and to fit a sigmoid maximum effect (Emax) dose-response model to pharmacokinetic and pharmacodynamic data. Weighting in all models was by inverse mean of observations.
RESULTS
Concentrations in plasma of neutropenic animals.
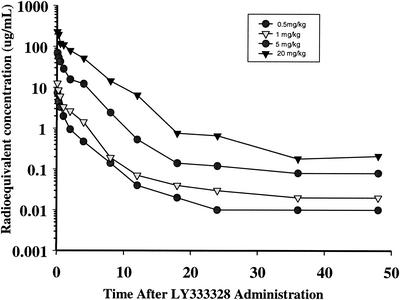
Time-concentration profiles of plasma for the four single intravenous [14C]oritavancin doses are presented in Fig. 2. Peak radioequivalent concentrations in plasma (in microgram equivalents [equiv] per milliliter) were 7.27, 12.56, 69.29, and 228.83 μg/ml for doses of 0.5, 1, 5, and 20 mg/kg, respectively. The AUC values for plasma, calculated from 0.83 to 48 h, were 8.24, 17.67, 129.90, and 562.17 μg equiv*h/ml for doses of 0.5, 1, 5, and 20 mg/kg, respectively. The plasma elimination half-life ranged from approximately 14 to 33 h. The oritavancin radioequivalent concentrations in plasma and AUC values were dose proportional from 0.5 to 20 mg/kg.
FIG. 2.
Radioequivalent concentrations of oritavancin in plasma of mice given a single intravenous 0.5-, 1-, 5-, or 20-mg/kg dose of 14C-LY333328.
Effects of neutropenia, route of administration, and presence of infection on plasma pharmacokinetics.
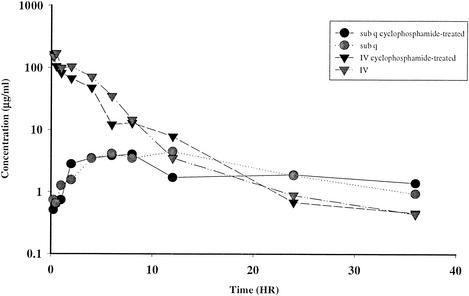
The effects of neutropenia and route of administration (subcutaneous versus intravenous) on radioequivalent oritavancin concentrations in plasma are illustrated in Fig. 3. Mice receiving a 20-mg/kg intravenous [14C]oritavancin dose had a substantially higher peak radioequivalent concentration in plasma than did mice receiving an identical subcutaneous dose (169.52 versus 4.46 μg equiv/ml for intravenous and subcutaneous doses, respectively). The calculated AUC was markedly higher in the intravenous-dose groups during the time period evaluated (0.25 to 36 h). After 12 h, the concentrations in plasma and blood were similar for intravenously and subcutaneously dosed mice. No differences in the concentration in plasma for infected and noninfected neutropenic mice were detected (data not shown).
FIG. 3.
Radioequivalent concentrations of oritavancin in plasma of mice after an intravenous or subcutaneous (sub q) 20-mg/kg dose of 14C-LY333328.
Concentrations in thigh tissues.
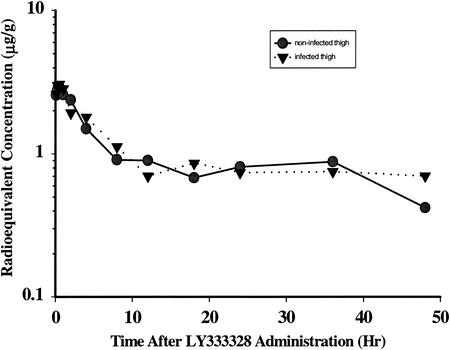
The concentration-time curves for thighs of neutropenic mice with and without infection are shown in Fig. 4. Fifteen minutes following intravenous administration of 5 mg of [14C]oritavancin/kg to neutropenic mice, the concentrations in thigh tissue averaged 2.49 ± 0.03 (standard error of the mean [SEM]) μg equiv/g and 2.32 ± 0.07 (SEM) μg equiv/g in infected and noninfected thigh samples, respectively. The thigh tissue half-life was approximately 128 h in the infected thigh and approximately 45 h in the noninfected thigh. The difference in half-life may not be meaningful and may result from a drop in compound concentration that occurred from 36 to 48 h in the control, which was not observed in the infected mice. Concentrations of oritavancin in the thigh were substantially higher at 8 and at 24 h in the groups receiving an intravenous dose than in the groups receiving a subcutaneous dose (data not shown).
FIG. 4.
Radioequivalent concentrations of oritavancin in noninfected and infected thigh tissues of mice after intravenous administration of a 5-mg/kg dose of 14C-LY333328.
Pharmacokinetic modeling.
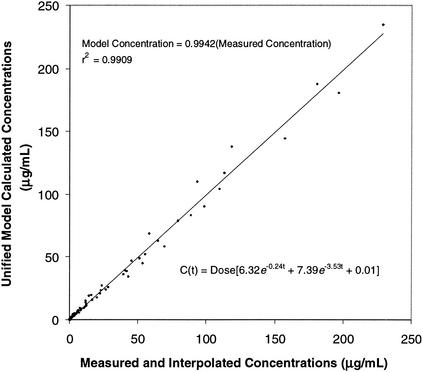
A two-compartment open pharmacokinetic model was fitted to the concentration-time values for plasma noted above. Since both Cmax and AUC increased linearly with dose, dose (in milligrams per kilogram of body weight) was incorporated into the model. The concentration in plasma of neutropenic mice at any time (t) after dosing could be described by using the following equation: C(t) = dose (6.32e−0.24t + 7.39e−3.53t + 0.01).
The relationship between the measured concentrations in plasma and those predicted by using this two-compartment model is illustrated in Fig. 5. This model was used to calculate pharmacokinetic variables (Cmax, T>MIC, and AUC) for each of the single- and multiple-dose regimens tested in the dose fractionation studies (Table 1).
FIG. 5.
Plot of measured (and interpolated) oritavancin concentrations versus calculated concentrations from the two-compartment pharmacokinetic model.
Single-dose dose-response study.
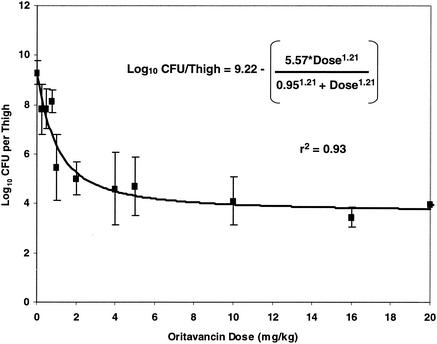
Figure 6 summarizes the results of single-dose dose escalation studies using oritavancin doses ranging from 0.25 to 20 mg/kg. The data suggest a sigmoid Emax dose-response relationship, with a maximal effect evident at single doses exceeding 2 mg/kg. Quantitative thigh cultures obtained from untreated animals sacrificed within 1 h after inoculation with S. aureus averaged 5.67 (standard deviation [SD], 0.18) log10 CFU/thigh. The oritavancin dose (stasis dose) that resulted in a 24-h colony count similar to the pretreatment count was 1.53 (SE, 0.35) mg/kg. The single oritavancin dose that resulted in 50% of maximal bacterial killing (ED50) was 0.95 (SE, 0.20) mg/kg.
FIG. 6.
Relationship between a single oritavancin dose and log10 CFU of S. aureus per thigh at 24 h.
Comparison of single-dose and dose fractionation regimens.
To identify which pharmacokinetic parameters might best predict efficacy in this model, groups of mice were administered dosage regimens as outlined in Table 1. Protein binding of oritavancin in human plasma is estimated to be approximately 85% (binding ranged from 85.7 to 89.9% at a compound concentration in plasma of 1 to 91 μg/ml) (Rowe and Brown, Abstr. AAPS Annu. Meet. Expo., 2001), and Cmax, T>MIC, and AUC were simulated for free (unbound) drug, assuming that protein binding in mouse plasma would be similar to that in human plasma.
Table 2 lists the S. aureus densities (log10 CFU/thigh ± 1 SD) in neutropenic mice, comparing the effects of oritavancin doses given as a single dose to those obtained with the same dose subdivided throughout the 24-h treatment period. For oritavancin doses of 0.5, 1, and 2 mg/kg (residing on the steep part of the sigmoid Emax curve), bacterial densities were lowest when the dose was given as a single injection and appeared to increase as the same dose was subdivided. This trend did not appear to be statistically significant at doses of 4 and 16 mg/kg (residing on the flat part of the sigmoid Emax curve). These data suggest that, for any dose in this model, the greatest reduction in bacterial density occurs when the entire dose is administered in a single injection.
TABLE 2.
Results of dose fractionation studies
| Total dosage (mg/kg) |
S. aureus density (log10 CFU/thigh ± SD) obtained with the following no. of doses:
|
Pa | |||
|---|---|---|---|---|---|
| 1 | 2 | 3 | 4 | ||
| 0.5 | 7.83 ± 0.80 | 8.79 ± 0.23 | 9.39 ± 0.38 | ND | 0.028 |
| 1 | 5.22 ± 1.37 | 6.67 ± 2.64 | 7.74 ± 0.22 | 7.40 ± 1.55 | 0.033 |
| 2 | 5.02 ± 0.66 | 6.04 ± 1.27 | 6.98 ± 1.12 | ND | 0.004 |
| 4 | 4.61 ± 1.48 | NDb | ND | 5.83 ± 1.98 | 0.35 |
| 16 | 3.46 ± 0.42 | ND | ND | 4.02 ± 0.43 | 0.16 |
By analysis of variance.
ND, not determined.
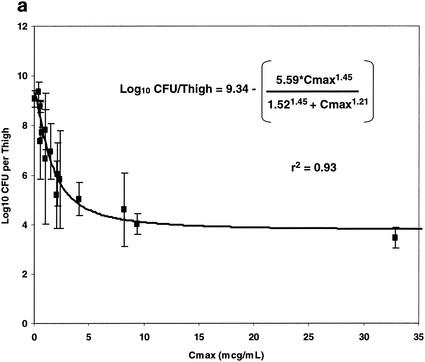
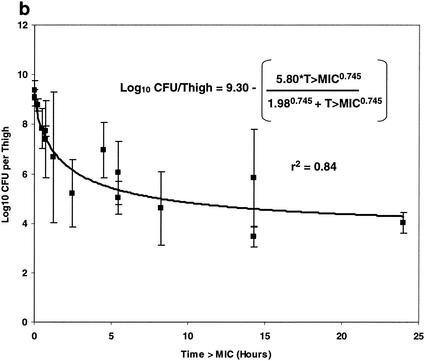
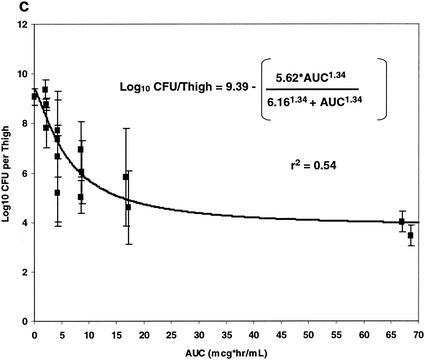
The relationships between each of the three pharmacokinetic parameters and pharmacodynamic indices (Cmax, T>MIC, and AUC) and bacterial density (log10 CFU/thigh ± 1 SD) are illustrated in Fig. 7. Panels a, b, and c of Fig. 7 illustrate the relationships between free oritavancin Cmax (in microgram equivalents per ml) in plasma, T>MIC, and free oritavancin AUC and bacterial density (log10 CFU/thigh ± 1 SD), respectively. Each of these relationships could be fitted to a sigmoid Emax model (P < 0.001 for each relationship). Free oritavancin Cmax of plasma, however, appeared to be the pharmacodynamic variable most closely correlated with reductions in log10 CFU/thigh (r2 = 0.93 versus 0.84 or 0.54).
FIG. 7.
Relationship between free Cmax, (a), T>MIC (b), and AUC (c) and log10 CFU of S. aureus per thigh at 24 h in dose fractionation studies.
DISCUSSION
Oritavancin is a semisynthetic glycopeptide antibiotic that differs from vancomycin with respect to in vitro activity (3-6, 18, 26, 27; Rowe and Brown, AAPS Annu. Meet. Expo., 2001) and in pharmacokinetics (Chien et al., Abstr. 38th ICAAC 1998; Lin et al., Abstr. 35th ICAAC, 1995). Clinical studies, currently ongoing, will establish whether these differences will translate to clinical benefits.
Our pharmacokinetic data suggest that Cmax and AUC increase linearly as the oritavancin dose increases. This dose linearity allowed us to construct a mathematical model, which in turn was used to estimate relevant pharmacokinetic parameters and pharmacodynamic indices for each dose studied in dose fractionation experiments. The oritavancin concentrations in plasma were much higher following intravenous than following subcutaneous routes of administration. Therefore, all subsequent efficacy studies were conducted with intravenous administration. The levels of oritavancin in plasma and thigh tissue appeared to be unaffected by the presence of neutropenia or infection. The long plasma half-lives calculated after single-dose administration suggest that accumulation in plasma or tissue may be possible over time upon multiple daily dosing.
We could not definitively identify which pharmacodynamic parameter (Cmax, T>MIC, or AUC) was best correlated with efficacy (lowest CFU/thigh) in this study, since all three parameters were highly correlated with efficacy. The long plasma half-life of oritavancin makes it difficult to distinguish the effects of Cmax, T>MIC, and AUC in this model. Cmax appeared to have the best correlation with efficacy, based on the experiments that we conducted; however, there is no assurance that this finding would be replicated if another pathogen were studied, if an end point other than 24 h were used, or if other dosing regimens were explored. Our dose fractionation studies suggest that, for any of the five doses studied, the lowest colony counts were encountered when the total dose was given as a single dose rather than as divided doses. The suggestion that Cmax might be correlated with efficacy is not unexpected, given the marked concentration-dependent killing exhibited by oritavancin in vitro (6, 18, 26, 27). This property suggests that oritavancin efficacy might be enhanced by a dosing strategy that provides larger doses given infrequently rather than smaller doses given more often.
For several other antibiotics used to treat gram-positive infections, the ratio of AUC to MIC or T>MIC appears to be most closely associated with the efficacy of other antibiotics active against resistant gram-positive pathogens. With some exceptions (12), clinical (22), in vivo (2), and in vitro studies (11, 13) suggest that the AUC/MIC ratio may be the most relevant pharmacodynamic variable for vancomycin. For teicoplanin, trough concentration appears to be associated with efficacy (17). The AUC/MIC ratio also appears to be the most relevant pharmacodynamic parameter for quinupristin-dalfopristin (21) and linezolid (8). In a neutropenic-mouse thigh model of S. aureus infection, Louie et al. (15) noted that the activity of daptomycin was similar whether or not the total daily dose was given as a single or a fractionated dose.
The findings in this study appear to be consistent with those of several animal studies involving oritavancin. Gerber et al. (10), using a rabbit model of penicillin-susceptible Streptococcus pneumoniae meningitis, found that the rate of bacterial killing in cerebrospinal fluid increased as the Cmax in cerebrospinal fluid increased. In a rat model of central venous catheter-associated S. aureus infection, Rupp and Ulphanin (M. E. Rupp and J. S. Ulphanin, Abstr. 38th Intersci. Conf. Antimicrob. Agents Chemother., abstr. F111, p. 260, 1998) noted that an oritavancin regimen of 20 mg/kg administered every 96 h was more efficacious in eradicating pathogens at the 7-day end point than the same 20 mg/kg given as 2.5 mg/kg every 12 h, 5 mg/kg every 24 h, or 10 mg/kg every 48 h.
The finding that Cmax may be an important determinant of efficacy with oritavancin is not supported by two studies. Lefort et al. (14), using a rabbit model of Enterococcus faecalis endocarditis, found that increasing Cmax and AUC did not improve efficacy. Instead they concluded that optimizing trough levels in serum was most likely to improve in vivo efficacy. Bauernfeind et al. (A. Bauernfeind, E. Eberlein, and R. Jungwirth, Abstr. 37th Intersci. Conf. Antimicrob. Agents Chemother., abst. F-14, p. 147, 1997), using an in vitro pharmacodynamic model to compare two dosing strategies with identical simulated AUC results, found that a regimen simulating constant oritavancin concentrations resulted in greater bacterial killing than a regimen simulating intermittent infusions. These contradictory results may be related to differences in study design, animal models used, or pathogens studied.
Our data suggest that oritavancin dosing strategies should attempt to maximize the concentration of the drug in serum rather than the time during which concentrations in plasma exceed the MIC.
Acknowledgments
We gratefully acknowledge Thalia Nicas for helpful discussions and Douglas Zecker and Bobbi Boyll for their excellent support in animal studies.
REFERENCES
- 1.Aeschlimann, J. R., G. P. Allen, E. Hershberger, and J. M. Rybak. 2000. Activities of LY333328 and vancomycin administered alone or in combination with gentamicin against three strains of vancomycin-intermediate Staphylococcus aureus in an in vitro pharmacodynamic infection model. Antimicrob. Agents Chemother. 44:2991-2998. [DOI] [PMC free article] [PubMed] [Google Scholar]
- 2.Ahmed, A., H. Jafri, I. Lutsar, C. C. McCoig, M. Trujillo, L. Wubbel, S. Shelton, and G. H. McCracken, Jr. 1999. Pharmacodynamics of vancomycin for the treatment of experimental penicillin- and cephalosporin-resistant pneumococcal meningitis. Antimicrob. Agents Chemother. 43:876-881. [DOI] [PMC free article] [PubMed] [Google Scholar]
- 3.Al-Nawas, B., J. Swantes, and P. M. Shah. 2000. In vitro activity of LY333328, a new glycopeptide, against extracellular and intracellular vancomycin-resistant enterococci. Infection 28:214-218. [DOI] [PubMed] [Google Scholar]
- 4.Al-Nawas, B., and P. M. Shah. 1998. Activity of vancomycin and Ly333328, a new semisynthetic glycopeptide, against methicillin-resistant Staphylococcus aureus. Infection 26:165-167. [DOI] [PubMed] [Google Scholar]
- 5.Baltch, A. L., R. P. Smith, W. J. Ritz, and L. H. Bopp. 1998. Comparison of inhibitory and bactericidal activities and postantibiotic effects of LY333328 and ampicillin used singly and in combination against vancomycin-resistant Enterococcus faecium. Antimicrob. Agents Chemother. 42:2564-2568. [DOI] [PMC free article] [PubMed] [Google Scholar]
- 6.Biavasco, F., C. Vignaroli, R. Lupidi, E. Manso, B. Facinelli, and P. E. Varaldo. 1997. In vitro antibacterial activity of LY333328, a new semisynthetic glycopeptide. Antimicrob. Agents Chemother. 41:2165-2172. [DOI] [PMC free article] [PubMed] [Google Scholar]
- 7.Cooper, R. D., N. J. Snyder, M. J. Zweifel, M. A. Staszak, S. C. Wilkie, T. I. Nicas, D. L. Mullen, T. F. Butler, M. J. Rodriguez, B. E. Huff, and R. C. Thompson. 1996. Reductive alkylation of glycopeptide antibiotics: synthesis and antibacterial activity. J. Antibiot. 49:575-581. [DOI] [PubMed] [Google Scholar]
- 8.Craig, W. A. 2001. Does the dose matter? Clin. Infect. Dis. 33(Suppl. 3):S233-S237. [DOI] [PubMed] [Google Scholar]
- 9.Craig, W. A., J. Redington, and S. C. Ebert. 1991. Pharmacodynamics of amikacin in vitro and in mouse thigh and lung infections. J. Antimicrob. Chemother. 27(Suppl. C):29-40. [DOI] [PubMed] [Google Scholar]
- 10.Gerber, J., A. Smirnov, A. Wellmer, J. Raghab, J. Prange, E. Schutz, K. Wettich, S. Kalich, and R. Nau.2001. Activity of LY333328 in experimental meningitis caused by a Streptococcus pneumoniae strain susceptible to penicillin. Antimicrob. Agents Chemother. 5:2169-2172. [DOI] [PMC free article] [PubMed] [Google Scholar]
- 11.Houlihan, H. H., R. C. Mercier, M. J. Rybak. 1997. Pharmacodynamics of vancomycin alone and in combination with gentamicin at various dosing intervals against methicillin-resistant Staphylococcus aureus-infected fibrin-platelet clots in an in vitro infection model. Antimicrob. Agents Chemother. 41:2497-2501. [DOI] [PMC free article] [PubMed] [Google Scholar]
- 12.Knudsen, J. D., K. Fuursted, S. Raber, F. Espersen, and N. Frimodt-Moller. 2000. Pharmacodynamics of glycopeptides in the mouse peritonitis model of Streptococcus pneumoniae or Staphylococcus aureus infection. Antimicrob. Agents Chemother. 44:1247-1254. [DOI] [PMC free article] [PubMed] [Google Scholar]
- 13.Larsson, A. J., K. J. Walker, J. K. Raddatz, and J. C. Rotschafer. 1996. The concentration-independent effect of monoexponential and biexponential decay in vancomycin concentrations on the killing of Staphylococcus aureus under aerobic and anaerobic conditions. J. Antimicrob. Chemother. 38:589-597. [DOI] [PubMed] [Google Scholar]
- 14.Lefort, A., A. Saleh-Jghir, L. Garry, C. Carbon, and B. Fantin.2000. Activity of LY333328 combined with gentamicin in vitro and in rabbit experimental endocarditis due to vancomycin-susceptible or -resistant Enterococcus faecalis. Antimicrob. Agents Chemother. 44:3017-3021. [DOI] [PMC free article] [PubMed] [Google Scholar]
- 15.Louie, A., P. Kaw, W. Liu, N. Jumbe, M. H. Miller, and G. L. Drusano. 2001. Pharmacodynamics of daptomycin in a murine thigh model of Staphylococcus aureus infection. Antimicrob. Agents Chemother. 45:845-851. [DOI] [PMC free article] [PubMed] [Google Scholar]
- 16.Low, D. E., N. Keller, A. Barth, and R. N. Jones. 2001. Clinical prevalence, antimicrobial susceptibility, and geographic resistance patterns of enterococci: results from the SENTRY Antimicrobial Surveillance Program, 1997-1999. Clin. Infect. Dis. 32(Suppl. 2):S133-S145. [DOI] [PubMed] [Google Scholar]
- 17.MacGowan, A., L. White, D. Reeves, and I. Harding. 1996. Retrospective review of serum teicoplanin concentrations in clinical trials and their relationship to clinical outcome. J. Infect. Chemother. 2:197-208. [DOI] [PubMed] [Google Scholar]
- 18.Mercier, R.-C., H. H. Houlihan, J. M. Rybak. 1997. Pharmacodynamic evaluation of a new glycopeptide, LY333328, and in vitro activity against Staphylococcus aureus and Enterococcus faecium. Antimicrob. Agents Chemother. 41:1307-1312. [DOI] [PMC free article] [PubMed] [Google Scholar]
- 19.National Committee for Clinical Laboratory Standards. 1995. Methods for dilution antimicrobial susceptibility tests for bacteria that grow aerobically, 3rd ed. Approved standard M7-A3. National Committee for Clinical Laboratory Standards, Wayne, Pa.
- 20.Nicas, T. I., M. L. Zeckel, and D. K. Braun. 1997. Beyond vancomycin: new therapies to meet the challenge of glycopeptide resistance. Trends Microbiol. 5:240-249. [DOI] [PubMed] [Google Scholar]
- 21.Rybak, M. J., H. H. Houlihan, R. C. Mercier, and G. W. Kaatz. 1997. Pharmacodynamics of RP 59500 (quinupristin-dalfopristin) administered by intermittent versus continuous infusion against Staphylococcus aureus-infected fibrin-platelet clots in an in vitro infection model. Antimicrob. Agents Chemother. 41:1359-1363. [DOI] [PMC free article] [PubMed] [Google Scholar]
- 22.Schentag, J. J. 1999. Antimicrobial action and pharmacokinetics/pharmacodynamics: the use of AUIC to improve efficacy and avoid resistance. J. Chemother. 11:426-439. [DOI] [PubMed] [Google Scholar]
- 23.Tenover, F. C., J. W. Biddle, and M. V. Lancaster. 2001. Increasing resistance to vancomycin and other glycopeptides in Staphylococcus aureus. Emerg. Infect. Dis. 7:327-332. [DOI] [PMC free article] [PubMed] [Google Scholar]
- 24.Wenzel, R. P., and M. B. Edmond. 1998. Vancomycin-resistant Staphylococcus aureus: infection control considerations. Clin. Infect. Dis. 27:245-249. [DOI] [PubMed] [Google Scholar]
- 25.Zeckel, M. L., D. A. Preston, and B. S. Allen. 2000. In vitro activities of LY333328 and comparative agents against nosocomial gram-positive pathogens collected in a 1997 global surveillance study. Antimicrob. Agents Chemother. 44:1370-1374. [DOI] [PMC free article] [PubMed] [Google Scholar]
- 26.Zelenitsky, S. A., J. A. Karlowsky, G. G. Zhanel, D. J. Hoban, and T. Nicas. 1997. Time-kill curves for a semisynthetic glycopeptide, LY333328, against vancomycin-susceptible and vancomycin-resistant Enterococcus faecium strains. Antimicrob. Agents Chemother. 41:1407-1408. [DOI] [PMC free article] [PubMed] [Google Scholar]
- 27.Zelenitsky, S. A., B. Booker, N. Laing, J. A. Karlowsky, D. J. Hoban, and G. G. Zhanel. 1999. Synergy of an investigational glycopeptide, LY333328, with once-daily gentamicin against vancomycin-resistant Enterococcus faecium in a multiple-dose, in vitro pharmacodynamic model. Antimicrob. Agents Chemother. 43:592-597. [DOI] [PMC free article] [PubMed] [Google Scholar]


