Abstract
One of the genes that is up-regulated by thyroid hormone (TH) during Xenopus laevis metamorphosis encodes a type III deiodinase (D3) that inactivates TH. Transgenic X. laevis tadpoles overexpressing a GFP-D3 fusion protein were produced. These transgenic tadpoles had high levels of deiodinase activity and were resistant to exogenous TH added 1 week after fertilization. They developed normally throughout embryogenesis and premetamorphic stages but became retarded in their development late in prometamorphosis when endogenous TH reaches its highest level. Gill and tail resorption were delayed and most of the animals arrested and died. One tadpole completed its metamorphosis without resorbing its tail. These results demonstrate that D3 can modulate the action of TH in vivo, and document the value of the new transgenic method for functional analysis of genes involved in metamorphosis.
One of the direct response genes that is up-regulated by thyroid hormone (TH) during Xenopus laevis metamorphosis is a type III deiodinase (D3) (originally called gene 15) (1). This enzyme inactivates TH by cleaving an iodine from the inner ring of the hormone (2). The basal expression, the developmental profile, the induction by TH (1), and the cell and tissue localization (3, 4) of D3 gene expression suggest that this enzyme plays a role in modulating the tadpole’s response to TH.
Two organs that have different expression patterns of D3 and that respond differently to TH during metamorphosis are the limb and the tail. Limb buds, which are one of the first organs to undergo a metamorphic change, have no detectable basal expression of D3 and high levels of thyroid hormone receptor α (TRα) (1). They undergo TH-induced changes early during prometamorphosis, when the endogenous TH level is low (5). Limb growth can be induced by low levels of exogenous TH. In contrast, the tail, which is the last organ to change, has a basal expression of D3 and low levels of TRα (1), and undergoes TH-induced changes late during metamorphic climax, when the endogenous TH level is maximal and TRβ has been induced (6). Tail resorption can be induced only by high levels of exogenous TH. As the endogenous level of TH rises during prometamorphosis, so does the level of D3 in the tail. When endogenous TH is at its highest level, D3 expression decreases. A class of delayed TH-response genes that includes several proteases is then induced, and the tail resorbs rapidly (7). Both the basal and up-regulated expression of D3 occur within cells adjacent to collagen lamellae that underlie the epidermis and surround the notochord (4). Coincident with the down-regulation of D3, these same cells up-regulate the delayed-response genes (4).
The correlation of D3 gene expression with other TH response genes extends to a variety of tissues during metamorphosis (3). Basically, decrease of D3 expression correlates with increase of expression of TH response genes. This expression pattern suggests that D3 can protect tissues from the action of TH.
In this paper, we report the phenotypes of transgenic tadpoles that overexpress D3 driven by a constitutive promoter. The transgenic tadpoles are resistant to exogenous TH and inhibited in spontaneous metamorphosis.
MATERIALS AND METHODS
Plasmids.
The vector pCS2+ (a gift of Dave Turner, Fred Hutchinson Cancer Research Center, Seattle) allows the expression of cDNAs from the simian cytomegalovirus (CMV) IE94 promoter/enhancer (8, 9). Various constructs were made by using primers with appropriate restriction enzyme sites to amplify cDNAs by PCR using Pfu polymerase (Stratagene). The plasmid pCS2+GFP* was made by amplifying a green fluorescent protein (GFP) cDNA containing a point mutation (S65C) with primers GATCCCATCGATCCACCATGAGTAAAGG and GAGGAATTCCCTTTGTATAGTTCATCCATGCCATGTG and cloning the amplified fragment into the ClaI and EcoRI sites of pCS2+. The plasmid pCS2+GFP-D3 was made by amplifying D3 cDNA including 580 bp of the 3′-untranslated region with primers CAGGAATTCATTCATTGCACTGCGCGGGA and CAGCTCTAGATCTACTGGACTGGAGG and cloning the amplified fragment into the EcoRI and XbaI sites of pCS2+GFP*. The plasmid pCS2+D3 was made by amplifying the D3 cDNA with primers CAGGAATTCGGAGGGGGTGAGGGCTGAGC and CAGCTCTAGATCTACTGGACTGGAGG and cloning the amplified fragment into the EcoRI and XbaI sites of pCS2+.
Cell Transfections.
X. laevis XL58 and XTC cultured cells were routinely grown at 25°C in 70% L-15 medium supplemented with 10% fetal bovine serum. Subconfluent cells were transfected with pCS2+GFP-D3 or pCS2+D3 plasmids by using the Lipofectamine reagent (Life Technologies, Grand Island, NY). Cells were collected 48 hr posttransfection, and whole cell extracts were prepared. The intracellular localization of GFP-D3 was observed in transfected cells on a coverslip. Cells were stained for endoplasmic reticulum 48 hr posttransfection in 0.4 μM of ER-Tracker Blue-White DPX (Molecular Probes) in culture medium for 10 min. The cells were then washed in PBS and fixed in 4% paraformaldehyde for 15 min. The coverslip was then mounted onto a slide and checked for fluorescence.
Deiodinase Assay of Cell and Tadpole Extracts.
Cells were rinsed twice in homogenization buffer (0.25 M sucrose/20 mM Tris, pH 7.6) 48 hr posttransfection before being scraped into Eppendorf tubes. The cells were sonicated for 15 sec and centrifuged at 1,000 × g for 5 min at 4°C. The supernatant was collected and assayed for D3 activity. Tadpoles were homogenized in Eppendorf tubes in the same buffer with a motor-driven plastic pestle (Kontes). The preparation was centrifuged at 1,000 × g for 5 min at 4°C. The supernatant was collected and assayed for D3 activity. D3 activity was assayed according to the method of Koopdonk-Kool et al. (10). Extracts were incubated with radioactive [125I]T3 (DuPont/NEN) in the presence of 40 mM DTT for 30 min at 37°C. The product and substrate were separated by TLC using an LD5K plate (Whatman). The product was quantified by using a Storm 860 PhosphorImager (Molecular Dynamics) and imagequant Version 1.2 software. D3 activities were normalized for protein content measured by the Bradford method (Pierce).
Transgenesis.
Transgenic animals were prepared by the method of Kroll and Amaya (11). A two-layer discontinuous Percoll (Sigma) centrifugation step was added to purify the sperm prior to the permeabilization step. The two layers were 25% and 50% Percoll in 1× NPB (0.25 M sucrose/15 mM Hepes, pH 7.7/1 mM EDTA/0.5 mM spermidine/0.2 mM spermine/1 mM DTT) respectively. The sperm suspension was loaded over the two layers and centrifuged at 3,000 rpm for 15 min at 4°C in a Sorvall HB-4 rotor. NotI was used to linearize plasmids and 0.5 units were added to the transgenesis reaction. In some experiments, sperm were permeabilized with 100 μg/ml digitonin (Sigma) instead of lysolecithin. Digitonin permeabilizes preferentially the cytoplasmic membrane rather than the nuclear membrane (12, 13). Digitonin-permeabilized sperm gave comparable results in terms of the percentage of normal transgenic animals. Sperm nuclei frozen in liquid nitrogen and stored at −80°C were used routinely for at least 2 months.
Identifying Transgenic Animals.
Animals were anesthetized either in 0.01% 3-aminobenzoic acid ethyl ester (Sigma) or iced water. GFP expression was monitored by using a Leica fluorescent dissecting microscope. The increase of tadpole pigmentation made it difficult to detect transgene expression in older tadpoles by using fluorescence. Therefore, we made transgenic tadpoles with a 2:1 mixture of pCS2+GFP-D3 and γCrys/GFP plasmids. The γCrys/GFP plasmid, a gift of R. Grainger (University of Virginia), contains a X. laevis lens-specific γ-crystalline 1 promoter driving GFP. Animals integrated both plasmids ≈80% of the time, as shown by PCR typing. The intense lens fluorescence permits rapid screening of potential transgenic animals. Definitive transgenesis was always confirmed by using PCR. Tadpole tail tip or another small piece of tissue was digested with 1 mg/ml proteinase K in PCR buffer for a few hours at 55°C, boiled for 10 min, and centrifuged briefly at 12,000 × g (14). The supernatant was amplified by using PCR with specific primers for each plasmid.
Tadpole Raising Conditions.
The rate of tadpole growth and development depends on water quality, light, temperature, tadpole density, and feeding (15). Suboptimal conditions cause drastic differences in the rate of growth of sibling tadpoles. Because an important assay for genes that affect metamorphosis is their influence on tadpole growth and development, it is critical to standardize the raising conditions. Transgenic embryos were raised to feeding stage for 1 week at room temperature in 0.1× MMR (10 mM NaCl/0.2 mM KCl/0.1 mM MgCl2/0.2 mM CaCl2/0.5 mM Hepes, pH 7.5) with 50 μg/ml gentamicin in Petri dishes. As many as 50 tadpoles were then transferred to 9.5-liter tanks of running dechlorinated water at 22°C. The addition of fresh water in 1 day was equal to at least 3 times the tank volume. Animals were fed daily with 1–5 ml of a suspension of 12% powdered nettle, depending on the number of tadpoles, plus about 0.5 g of trout and salmon starter (Rangen, Buhl, ID) twice a week. Tadpoles grew fairly uniformly to metamorphosis in 8 wk or less. After metamorphosis, froglets were fed with Tubifex worms. Embryos and tadpoles were staged according to Nieuwkoop and Faber (16).
Spontaneous Metamorphosis.
As individual tadpoles reached stage 59 they were placed into individual 500-ml beakers without food, and the water was changed daily. The length of the tail and the stage of development was recorded daily. Normal tadpoles remain at stage 59 and 60 for 4 days or less, at which time the head shape begins to change. Head remodeling is completed (stage 63) within another 2 to 3 days followed by rapid tail resorption which takes an additional 3 days. Typically the tail length shortens by half each day. Animals left in the 9.5-liter tank will metamorphose more slowly, probably because they continue to eat and grow as tadpoles. Metamorphosis is complete when the froglet begins to eat Tubifex worms after stage 65. The average time for 40 control animals to proceed from stage 59 to stage 64 was 8 ± 1 days.
Induced Metamorphosis.
A 2-wk TH induction assay was also used to detect an effect of the transgene on metamorphosis. T3 is added 1 wk after fertilization to a final concentration of 10 nM to tadpole rearing water for 1 wk. Preceding and during the treatment regimen, tadpoles are maintained in 0.1× MMR in the absence of any food. Under this treatment, tadpoles respond to the hormone uniformly. We have never seen a control tadpole that is resistant to TH induction in this assay.
Cartilage Staining.
Animals were fixed with 10% formaldehyde in PBS for 24 hr and stained for cartilage in Alcian blue working solution (0.02% Alcian blue 8GX in 70% ethanol/30% glacial acetic acid) overnight. After rinsing briefly (70% ethanol/30% glacial acetic acid), animals were cleared in a 1:2 mixture of benzyl alcohol/benzyl benzoate.
Imaging.
Some pictures of tadpoles were taken on a Leica fluorescent dissecting microscope by using the Leica LEI-750 charge-coupled device video camera system. When a tadpole was too big to photograph even under the lowest magnification, multiple pictures were taken, and a composite was assembled in Adobe pagemaker. Pictures of one tadpole and the frog were taken with an Agfa ePhoto 1280 digital camera.
RESULTS
The GFP-D3 Fusion Protein Is Active.
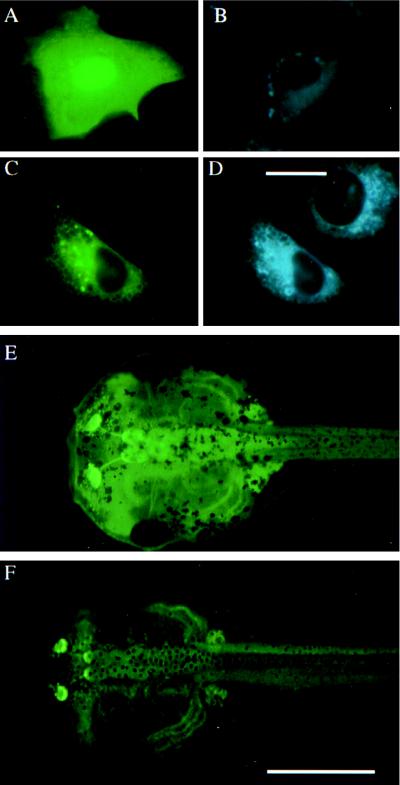
To detect transgene expression, a plasmid expressing a fusion protein of GFP and D3 driven by the constitutive simian cytomegalovirus (CMV) promoter (pCS2+GFP-D3) was constructed as well as a plasmid expressing D3 alone (pCS2+D3). Because D3 is a selenocysteine-containing protein, it was necessary to include 580 bp of 3′-untranslated region containing the selenocysteine insertion sequence (2). These constructs were tested with transient transfection of X. laevis cultured XL58 cells, a cell line that has no detectable endogenous D3 activity (2). Extracts of cells transfected with pCS2+GFP-D3 were compared for D3 enzymatic activity with extracts of cells that had been transfected with pCS2+D3. The enzymatic activity of the fused protein was comparable to that of the unfused protein (data not shown). The subcellular distribution pattern of fused protein in transfected X. laevis XTC cells was similar but not identical to the staining pattern of an endoplasmic reticulum-specific marker ER-Tracker Blue-White DPX (Fig. 1 C and D). It has been reported that D3 activity cofractionates with marker enzymes of the endoplasmic reticulum, such as glucose-6-phosphatase and NADPH-cytochrome c reductase (17, 18). Cells expressing the fused protein were much less fluorescent than those expressing GFP alone, presumably because of the reduced translation of the selenocysteine-containing protein (19).
Figure 1.
The subcellular localization of GFP and GFP-D3 proteins in X. laevis XTC cells and the expression pattern of transgenic animals. (A) GFP fluorescence in transfected XTC cell. (B) ER-Tracker fluorescence of the same cell shown in A. (C) GFP-D3 fluorescence in transfected cell next to untransfected cell. (D) ER-Tracker fluorescence of the same cells shown in C. (Bar = 20 μm, A–D.) (E) GFP fluorescence of a 2-wk-old pCS2+GFP transgenic animal. (F) GFP fluorescence of a 2-wk-old pCS2+GFP-D3 transgenic animal expressing high levels of GFP-D3. (Bar = 2 mm, E and F.)
Transgenic Tadpoles Express GFP-D3 Widely.
Transgenic animals were made with the plasmids pCS2+GFP and pCS2+GFP-D3. Animals expressing the fused protein GFP-D3 were much less fluorescent than those expressing GFP alone. However, the two proteins had similar tissue distributions (Fig. 1 E and F). Fig. 1F shows the GFP fluorescence pattern of one of the transgenic animals expressing a high level of GFP-D3. Although the transgene expression is widespread, it varies in intensity in different tissues and between different tadpoles. A detailed analysis of the cellular distribution of the transgene expression was not carried out.
Transgenic Animals Overexpressing GFP-D3 Have Greatly Increased D3 Enzymatic Activity.
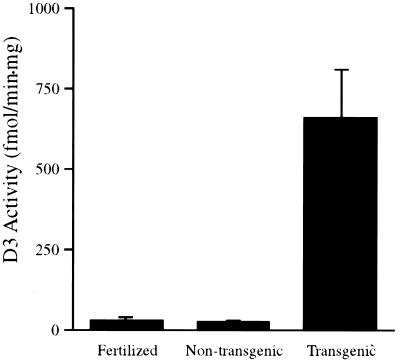
To confirm that the transgenic tadpoles have high levels of D3 activity, animals were scored for transgene expression by fluorescence and raised to 1 wk of age. Extracts from transgenic tadpoles, nontransgenic siblings, and normal fertilized individuals were assayed for D3 activity by using [125I]T3 as substrate. All of the animals that were scored as positive by fluorescence had greatly increased levels of D3 activity. On average, D3 activity in these animals was about 20-fold higher than that in animals not carrying the transgene (Fig. 2).
Figure 2.
The D3 enzymatic activities in extracts of 1-wk-old normal fertilized, pCS2+GFP-D3 nontransgenic siblings and pCS2+GFP-D3 transgenic tadpoles. Transgenic tadpoles were screened by GFP fluorescence. Values shown are the average of five individual animals in each group. The error bar represents SD.
Transgenic Tadpoles Are Resistant to Exogenous TH.
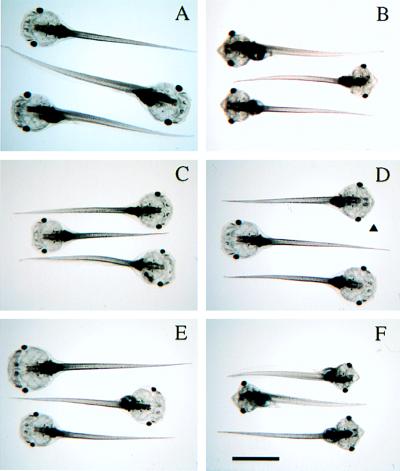
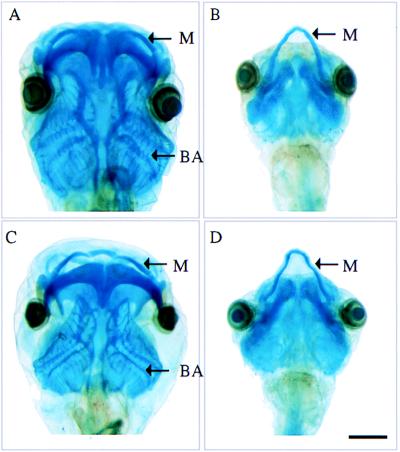
One week after fertilization, tadpoles are competent to respond to exogenous TH in many of their tissues and organs (20). The most obvious TH-induced morphological change is the reshaping of the head, mainly the result of the resorption of the gills and the protrusion of the lower jaw caused by the extensive growth of Meckel’s cartilage (Fig. 3 and 4). These same cartilage changes occur during spontaneous metamorphosis (21). Less obvious TH-induced changes include the precocious appearance of the limb buds and widening and shortening of the brain. Changes in the tail length and morphology are minimal at this level of exogenous hormone.
Figure 3.
Tadpoles overexpressing GFP-D3 are resistant to exogenous T3. One-week-old tadpoles were screened by using GFP fluorescence and treated with 10 nM T3 for 1 wk. The reshaping of their heads and the protrusion of the lower jaw are the most obvious TH-induced changes. (A) Normal fertilized animals, no T3. (B) Normal fertilized animals treated with T3. (C) pCS2+GFP-D3 transgenic animals, no T3. (D) pCS2+GFP-D3 transgenic animals treated with T3. The arrowhead points to an animal showing partial response as evidenced by slight protrusion of the lower jaw. (E) Nontransgenic siblings, no T3. (F) Nontransgenic siblings treated with T3. (Bar = 4 mm.)
Figure 4.
Cartilage staining of tadpoles after the T3 induction assay. (A) Normal fertilized animal. (B) Normal fertilized animal treated with T3. (C) pCS2+GFP-D3 transgenic animal treated with T3. (D) Nontransgenic sibling treated with T3. M, Meckel’s cartilage; BA, branchial arch cartilages. (Bar = 1 mm.)
Tadpoles overexpressing GFP-D3 fusion protein were identified by their fluorescence (Fig. 1F). At 1 wk of age, 10 nM T3 was added to the rearing water of transgenic tadpoles, nontransgenic siblings, and normal fertilized controls for a second week. At the level of gross morphology, the majority of 14 transgenic animals were completely resistant to TH-treatment (Fig. 3). Four animals showed partial resistance, perhaps reflecting a lower level of transgene expression, although correlation of the level of D3 enzymatic activity with the extent of T3 resistance was not carried out. Expression of the GFP-D3 fusion protein prevented both T3-induced growth of Meckel’s cartilage and resorption of the gills (Fig. 4). TH-induced changes in the brain (Fig. 3) and formation of the limb buds also were inhibited by the expression of the transgene.
Transgenic Tadpoles Overexpressing GFP-D3 Are Arrested in Resorption Programs at the Climax of Metamorphosis.
Transgenic and nontransgenic siblings were raised together in a single tank under standardized conditions as described in Materials and Methods. The γCrys/GFP construct was included so that animals with a high likelihood of carrying the GFP-D3 transgene could be identified easily by their fluorescent lenses. Twice each week, animals were anesthetized, sorted under a fluorescent dissecting scope by their fluorescent lenses, and scored for developmental differences. Especially noted were their size and stage as determined by limb development. On reaching stage 59, when the forelimbs had broken through, each tadpole was placed into a separate 500-ml beaker without food and its stage and tail length were recorded daily until metamorphosis was complete. Each individual was then typed by using PCR for definitive transgenesis.
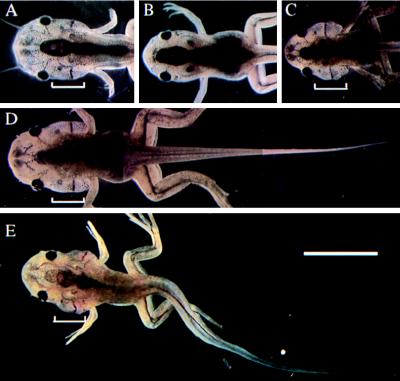
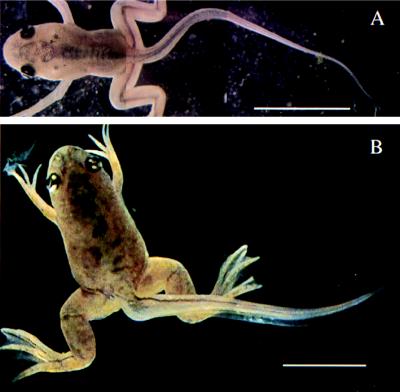
The transgenic animals underwent normal embryogenesis. No difference in the size or rates of development, including limb development, was found between transgenic and control animals until stage 59. About two-thirds of the transgenic tadpoles arrested at about stage 60–61 without resorbing their gills or tail and died (Table 1). The gills of these animals were disproportionately large compared with the trunk and the front of the head, yet Meckel’s cartilage had begun to grow (Fig. 5). Several transgenic animals remained at stage 60–61 for more than 4 days and then slowly completed metamorphosis. One animal very slowly resorbed its gills and then began to feed as a frog without having resorbed its tail (Fig. 6). The remainder of the transgenic animals metamorphosed normally. These different phenotypes may reflect the different levels of transgene expression caused by position effect of transgene integration.
Table 1.
Phenotypes of transgenic animals overexpressing GFP-D3 during spontaneous metamorphosis
| Animal type | Phenotypes during metamorphosis
|
||
|---|---|---|---|
| Arrested | Slowed* | Normal | |
| Transgenic | 29 | 5 | 13 |
| Nontransgenic | 0 | 0 | 22 |
Data is scored as number of individual animals.
These transgenic tadpoles took from 11 to 15 days from stage 59 to metamorphose compared to 8 days for control tadpoles (see Materials and Methods).
Figure 5.
Arrest of pCS2+GFP-D3 transgenic animals at stage 60–61. (A) Control animal, stage 60. (B) Control animal, stage 62. (C, D, and E) Three arrested transgenic animals showing retardation of gill and tail resorption. The brackets indicate the gills. (Bar = 1 cm.)
Figure 6.
Tailed transgenic frog overexpressing GFP-D3. The animal having just completed gill resorption (A) and the same animal 2 months later (B). (Bar = 1 cm.)
DISCUSSION
The Effects of Overexpressing GFP-D3 on Induced and Spontaneous Metamorphosis.
During the second week after fertilization, transgenic animals overexpressing GFP-D3 driven by a cytomegalovirus promoter are resistant to the morphological changes that can be induced by exogenous TH in nontransgenic siblings and control tadpoles of the same age (Figs. 3 and 4). These include growth of Meckel’s cartilage, growth of limb buds, shortening and thickening of the brain, and resorption of the gill arches.
The phenotype of transgenic tadpoles undergoing spontaneous metamorphosis becomes evident at stage 60 (Fig. 5), which is the climax of metamorphosis when the endogenous TH concentration has reached its highest level (5). The high concentration of TH is required for the subsequent resorption of the gill arches, the final stages of intestinal remodeling, and finally tail resorption. Only developmental programs that require the highest TH level were affected during spontaneous metamorphosis of the transgenic tadpoles overexpressing D3 (Fig. 5).
The differences between the two assays, spontaneous and TH-induced metamorphosis, can be explained by the changing levels of TRs, TH, and D3 in individual tissues. Young tadpoles respond more slowly to TH, and the relative sensitivity of various tissues to exogenous TH differs from that seen in older tadpoles or during spontaneous metamorphosis. After tadpoles have entered prometamorphosis (beyond stage 52), limb buds respond to low levels of TH, which correlates with their high level of TR (1). It is likely that even the elevated D3 levels in the transgenic tadpoles cannot reduce the TH level enough to inhibit limb growth.
The phenotypes can be influenced by other changes. It is known that the negative-feedback loop in which the pituitary controls thyroid gland production of TH by way of TSH is functional in tadpoles (ref. 22 and H.H. and D.B., unpublished data). The lowering of TH by overexpressing D3 could result in an increase in TSH, which in turn would up-regulate TH production.
The Function of D3 in Vivo.
D3 activity has been described in a number of tissues from a wide variety of species (23). High D3 activity has been found in placental homogenates in vitro, suggesting that the enzyme protects the fetus from excessive levels of endogenous or maternal T4 and T3 during critical stages of development (23). Galton and her colleagues (24) have proposed that both D3 and D2 (the enzyme that converts T4 to T3) modulate metamorphosis of Rana catesbeiana. They found that both genes are expressed at their highest levels in a given tissue at the time when the tissue was undergoing its greatest changes. This differs from our analysis of D3 expression in X. laevis, which drops in activity just before metamorphic changes occur.
In these experiments we have demonstrated the protective role of D3 in vivo. An important unanswered question is whether D3 inactivates TH only in the cells where it is expressed or whether high enzyme levels in some cells or tissues can influence nonexpressing cells by acting as a sink that can destroy circulating TH.
Assaying for Gene Function in Metamorphosis.
Our goal is to understand the developmental programs that are induced by TH during metamorphosis. Many TH-regulated genes were isolated by a PCR-based subtractive-hybridization method (1). These genes were cloned and identified by sequencing (7). However, the fact that a gene is up- or down-regulated by TH does not guarantee that it plays a role in a particular developmental program. Therefore we have sought a functional method to assay the role of these genes in metamorphosis. Although injection of mRNAs into fertilized eggs has been valuable for assessing the function of genes involved in early amphibian embryogenesis (25), the mRNAs and their protein products are too short-lived to be useful for the study of metamorphosis. The injection of plasmid DNAs into fertilized eggs only results in transient and mosaic gene expression (26, 27).
The new technique for making transgenic X. laevis animals (11), in which permeabilized sperm nuclei is incubated with a linearized DNA construct in the presence of egg extract and restriction enzyme, and the sperm nuclei are injected into unfertilized eggs, is without a doubt the most versatile and generally useful method yet developed to study the function of X. laevis genes at metamorphosis. Large numbers of normal developing animals expressing transgenes can be obtained from a single day of injections. Whereas the rate of developmental abnormalities in these nuclear transplantation animals is much higher than when eggs are fertilized, those animals that do develop normally through feeding stages are indistinguishable from controls. Because sibling transgenic animals do not have identical genotypes, the similarity of their phenotypes is crucial and will depend in part on the strength and reproducibility of the promoter because each transgenic individual integrates an unknown number of DNA molecules into unknown genomic locations. In this study the constitutive promoter derived from the simian cytomegalovirus driving the cDNA encoding GFP-D3 fusion protein produces a reproducible phenotype. This method thus offers great potential for the functional analysis of metamorphosis-related genes.
Acknowledgments
The authors are grateful to Kris Kroll and Enrique Amaya for their advice on transgenesis. We thank Benjamin Remo for excellent technical support and our colleagues for their helpful comments on the manuscript. This research has been performed by H.H. in partial fulfillment of the requirements for the Ph.D. degree at the Johns Hopkins University. N.M. was supported by a Jane Coffin Childs Memorial Fund for Medical Research Fellowship. This work was supported in part by grants from the National Institutes of Health and the G. Harold and Leila Y. Mathers Charitable Trust.
ABBREVIATIONS
- TH
thyroid hormone
- TR
thyroid hormone receptor
- D3
type III deiodinase
- GFP
green fluorescent protein
References
- 1.Wang Z, Brown D D. J Biol Chem. 1993;268:16270–16278. [PubMed] [Google Scholar]
- 2.St. Germain D L, Schwartzman R A, Croteau W, Kanamori A, Wang Z, Brown D D, Galton V A. Proc Natl Acad Sci USA. 1994;91:7767–7771. doi: 10.1073/pnas.91.16.7767. [DOI] [PMC free article] [PubMed] [Google Scholar]
- 3.Berry D L, Rose C S, Remo B F, Brown D D. Dev Biol. 1998;203:24–35. doi: 10.1006/dbio.1998.8975. [DOI] [PubMed] [Google Scholar]
- 4.Berry D L, Schwartzman R A, Brown D D. Dev Biol. 1998;203:12–23. doi: 10.1006/dbio.1998.8974. [DOI] [PubMed] [Google Scholar]
- 5.Leloup J, Buscaglia M. C R Acad Sci. 1977;284D:2261–2263. [Google Scholar]
- 6.Eliceiri B P, Brown D D. J Biol Chem. 1994;269:24459–24465. [PubMed] [Google Scholar]
- 7.Brown D D, Wang Z, Furlow J D, Kanamori A, Schwartzman R A, Remo B F, Pinder A. Proc Natl Acad Sci USA. 1996;93:1924–1929. doi: 10.1073/pnas.93.5.1924. [DOI] [PMC free article] [PubMed] [Google Scholar]
- 8.Rupp R A, Snider L, Weintraub H. Genes Dev. 1994;8:1311–1323. doi: 10.1101/gad.8.11.1311. [DOI] [PubMed] [Google Scholar]
- 9.Turner D L, Weintraub H. Genes Dev. 1994;8:1434–1447. doi: 10.1101/gad.8.12.1434. [DOI] [PubMed] [Google Scholar]
- 10.Koopdonk-Kool J M, van Lopik-Peterse M C, Veenboer G J, Visser T J, Schoenmakers C H, de Vijlder J J. Anal Biochem. 1993;214:329–331. doi: 10.1006/abio.1993.1497. [DOI] [PubMed] [Google Scholar]
- 11.Kroll K L, Amaya E. Development. 1996;122:3173–3183. doi: 10.1242/dev.122.10.3173. [DOI] [PubMed] [Google Scholar]
- 12.Leno G H, Downes C S, Laskey R A. Cell. 1992;69:151–158. doi: 10.1016/0092-8674(92)90126-w. [DOI] [PubMed] [Google Scholar]
- 13.Diaz R, Stahl P D. Methods Cell Biol. 1989;31:25–43. doi: 10.1016/s0091-679x(08)61600-3. [DOI] [PubMed] [Google Scholar]
- 14.Hogan B, Beddington R, Costantini F, Lacy E. Manipulating the Mouse Embryo: A Laboratory Manual. Plainview, NY: Cold Spring Harbor Laboratory Press; 1994. pp. 303–304. [Google Scholar]
- 15.Dodd M H I, Dodd J M. In: Physiology of the Amphibia. Lofts B, editor. Vol. 3. New York: Academic; 1976. pp. 467–599. [Google Scholar]
- 16.Nieuwkoop P D, Faber J. Normal Table of Xenopus laevis (Daudin) New York: Elsevier/North–Holland; 1956. [Google Scholar]
- 17.Fekkes D, van Overmeeren-Kaptein E, Docter R, Hennemann G, Visser T J. Biochim Biophys Acta. 1979;587:12–19. doi: 10.1016/0304-4165(79)90215-0. [DOI] [PubMed] [Google Scholar]
- 18.Auf dem Brinke D, Kohrle J, Kodding R, Hesch R D. J Endocrinol Invest. 1980;3:73–76. doi: 10.1007/BF03348222. [DOI] [PubMed] [Google Scholar]
- 19.Berry M J, Maia A L, Kieffer J D, Harney J W, Larsen P R. Endocrinology. 1992;131:1848–1852. doi: 10.1210/endo.131.4.1396330. [DOI] [PubMed] [Google Scholar]
- 20.Tata J R. Dev Biol. 1968;18:415–440. doi: 10.1016/0012-1606(68)90050-x. [DOI] [PubMed] [Google Scholar]
- 21.Trueb L, Hanken J. J Morphol. 1992;214:1–41. doi: 10.1002/jmor.1052140102. [DOI] [PubMed] [Google Scholar]
- 22.Kaye N W. Gen Comp Endocrinol. 1961;1:1–19. doi: 10.1016/0016-6480(61)90019-3. [DOI] [PubMed] [Google Scholar]
- 23.St. Germain D L. In: Thyroid Hormone Metabolism. Wu S, Visser T J, editors. Boca Raton, FL: CRC; 1994. pp. 45–66. [Google Scholar]
- 24.Becker K B, Stephens K C, Davey J C, Schneider M J, Galton V A. Endocrinology. 1997;138:2989–2997. doi: 10.1210/endo.138.7.5272. [DOI] [PubMed] [Google Scholar]
- 25.Vize P D, Melton D A, Hemmati-Brivanlou A, Harland R M. Methods Cell Biol. 1991;36:367–387. doi: 10.1016/s0091-679x(08)60288-5. [DOI] [PubMed] [Google Scholar]
- 26.Etkin L D, Pearman B. Development. 1987;99:15–23. doi: 10.1242/dev.99.1.15. [DOI] [PubMed] [Google Scholar]
- 27.Fu Y, Wang Y, Evans S M. Nat Biotechnol. 1998;16:253–257. doi: 10.1038/nbt0398-253. [DOI] [PubMed] [Google Scholar]


