Abstract
Objective: The prevalence of non-alcoholic fatty liver disease (NAFLD) has markedly increased. Insulin resistance has been implicated in the pathogenesis of NAFLD. This study was aimed at observing the relationship between insulin resistance and NAFLD, and evaluating the role of pioglitazone (PGZ) acting as insulin-sensitizing agents in the prevention and treatment of rat fatty liver induced by high fat feeding. Methods: The rats were separated randomly into 6 groups: model group I were fed high fat diet for 8 weeks, PGZ prevention group were given PGZ 4 mg/(kg·d) simultaneously, while control group I were fed normal food for 8 weeks; model group II were fed high fat diet for 16 weeks, PGZ treatment group were given PGZ 4 mg/(kg·d) orally simultaneous with high fat diet for 8 weeks after high fat feeding for 8 weeks, control group II were fed normal food for 16 weeks. The rats were sacrificed after 8 weeks and 16 weeks respectively. Liver weight, body weight, serum activities of alanine aminotransferase (ALT), aspartate aminotransferase (AST), alkaline phosphatase (ALP), tumor necrosis factor alpha (TNF-α), fasting blood glucose (FBG), fasting plasma insulin (FINS), HOMA (homeostasis model assessment) insulin resistance index (HOMA-IR), and the liver histology of rats of all groups were assayed. Results: After 8 weeks, the liver in model group I showed typical steatosis, accompanied with mild to moderate lobular inflammatory cell infiltration, liver indexes and serum levels of ALT, AST, ALP, TNF-α were significantly increased (P<0.05) compared with control group I. Whereas, the degree of hepatic injury was attenuated in PGZ prevention group, liver indexes and serum levels of ALT, ALP were significantly decreased (P<0.05) compared with model group I. After 16 weeks, notable steatosis, and lobular inflammation were observed in model group II rat liver, while the degree of hepatic injury was attenuated in the PGZ treatment group. Liver index, serum levels of ALT, AST, ALP, FINS and HOMA-IR were significantly increased (P<0.05) in model group II compared with control group II. Whereas, in PGZ treatment group, serum levels of AST and FINS showed decreasing tendency, liver indexes, serum levels of ALT, ALP, TNF-α and HOMA-IR were significantly decreased compared with model group II. Conclusion: Insulin resistance plays a role in the pathogenesis of NAFLD in rats. Pioglitazone can attenuate insulin resistance and biochemical and histological injury in high fat-induced fatty liver in rats.
Keywords: Fatty liver, Insulin resistance, Pioglitazone
INTRODUCTION
Non-alcoholic fatty liver disease (NAFLD) is one of the most frequent causes of abnormal liver dysfunction in clinic. Along with the change of life style and dietary pattern, its prevalence has markedly increased. However, the mechanisms involved in the pathogenesis of NAFLD have not been thoroughly investigated. Some studies show that insulin resistance plays a key role in the pathogenesis of NAFLD. Acting as the high-affinity agonist of peroxisome proliferator activated receptor gamma (PPARγ), pioglitazone (PGZ) can significantly enhance the tissue sensitivity to insulin. In this study, we establish NAFLD animal model through high fat diet, investigate the relationship between insulin resistance and NAFLD, assess the effect of pioglitazone in prevention and treatment for high fat-induced fatty liver in rats.
MATERIALS AND METHODS
Materials
1. Experimental animals
Sixty-eight, 80~100 g, male Sprague-Dawley (SD) rats, were housed in individual cages and maintained at (23±1) °C room temperature and 12/12 h dark/light rhythm, were obtained from the Zhejiang Province Experimental Animal Center.
2. Main reagents
Cholesterol was purchased from Eastern China Medicine Corporation. Yolk flour was purchased from Changxing Aige Biological Product Corporation. Glucose liquid kit (hexokinase method) was purchased from Shanghai Shenneng-Desai Diagnostic Technique Corporation. Transaminase kit (velocity method) was purchased from Beijing Boding Biotechnology Corporation. Insulin kit and tumor necrosis factor-α (TNF-α) kit were purchased from Beijing North Biotechnology Institute. Pioglitazone (PGZ) was obtained from Takeda Chemical Industries (Osaka, Japan).
Methods
1. Animal modelling and grouping
SD rats were separated randomly into 6 groups: (1) control group I: feeding rats normal diet for 8 weeks; (2) model group I: feeding rats high fat diet containing 80.5% basal feedstuff, 2% cholesterol, 7% lard, 10% yolk flour and 0.5% bile salt for 8 weeks; (3) PGZ prevention group: feeding rats high fat diet accompanied by intragastric administration of PGZ 4 mg/(kg·d) for 8 weeks; (4) control group II: feeding rats normal diet for 16 weeks; (5) model group II: feeding rats high fat diet for 16 weeks; (6) PGZ treatment group: feeding rats high fat diet for 8 weeks, then feeding them high fat diet simultaneously with intragastric administration of PGZ 4 mg/(kg·d) for another 8 weeks.
2. Sampling procedures
The rats were killed after 12 h of fasting. Blood samples were collected from femoral artery, centrifugated for 3 min at 3000 r/min, and serum was stored at −70 °C. The liver was removed and weighed after being cleaned with ice-cold saline. Liver sample was taken from 5 mm away from the edge of the largest hepatic lobe, fixed with 10% formaldehyde; embedded in paraffin wax, stained with hematoxylin and eosin (HE), and then observed under light microscope.
3. Biochemical and histological assay
Liver index was calculated (liver weight/body weight×100%). Serum level of alanine transaminase (ALT), aspartic transaminase (AST), alkaline phosphatase (ALP) and fasting blood glucose (FBG) were assayed using biochemistry automatic analyzer (Hitachi7600). Serum levels of tumor necrosis factor alpha (TNF-α) and fasting insulin (FINS) were determined by radioimmunoassay (RIA). Homeostasis model assessment-insulin resistance was calculated (HOMA-IR=[fasting glucose (mmol/L)×fasting insulin (μU/ml)]/22.5) (Bonora et al., 2000). Pathological changes (including steatosis and inflammation) were analyzed by semiquantitative method according to standards proposed by Dixon et al.(2004) (Table 1).
Table 1.
Criteria used for histological scoring
| Score | Steatosis | Lobular inflammation | Portal inflammation intensity | Portal inflammation extent |
| 0 | <5% of lobular parenchyma | No inflammation | Nil | No |
| 1 | <25% of lobular parenchyma | Sparse zone 3 inflammation | Mild | <25% of portal tracts |
| 2 | <50% of lobular parenchyma | Mild focal zone 3 inflammation | Moderate | <50% of portal tracts |
| 3 | <75% of lobular parenchyma | Notable zone 3 inflammation | Severe | <75% of portal tracts |
| 4 | >75% of lobular parenchyma | Severe zone 3 inflammation | >75% of portal tracts |
Statistical analysis
Results were expressed as mean±SD. Differences of P<0.05 were considered statistically significant. The data were analyzed with SPSS 11.5. The continuous variable was analyzed by single factor analysis of variance, and the qualitative variable was analyzed by rank-sum test.
RESULTS
Effects on hepatic gross manifestation
In the experiment, the body weight (P<0.05), liver weight (P<0.01) and liver index (P<0.01) in model group I were significantly increased over those of control group I. However, the liver weight and liver index in PGZ prevention group decreased significantly compared with model group I (P<0.01). Compared with control group II, the body weight of rats in model group II increased to some extent, but had no significant difference, whereas the liver weight and the liver index increased significantly (P<0.01). The liver weight and the liver index in PGZ treatment group significantly decreased over those of model group II (P<0.05) (Table 2). The hepatic surface was smooth, red-brown, and of moderate texture in control group, whereas the hepatic volume was enlarged, and of dimmer color and hard texture in the model group. The liver condition of PGZ prevention and treatment group is in-between that of the above two groups.
Table 2.
Body weight (BW), liver weight (LW) and liver index (LI) of rats in each group
| Groups | Number | BW (g) | LW (g) | LI |
| Control group I | 12 | 422.83±38.77 | 12.06±1.40 | 2.85±0.24 |
| Model group I | 12 | 456.17±30.38a | 24.47±2.93b | 5.36±0.42b |
| PGZ prevention group | 12 | 457.75±30.41a | 21.13±3.48bc | 4.63±0.65bc |
| Control group II | 11 | 527.50±66.35 | 14.02±2.50 | 2.69±0.55 |
| Model group II | 10 | 555.11±32.14 | 29.55±4.12d | 5.31±0.58d |
| PGZ treatment group | 11 | 542.75±50.26 | 25.85±4.03de | 4.75±0.46de |
P<0.05 vs control group I
P<0.01 vs control group I
P<0.01 vs model group I
P<0.01 vs control group II
P<0.05 vs model group II
Effects on hepatic biochemical manifestation
Compared with control group I, the serum levels of ALT (P<0.01), AST (P<0.01), ALP (P<0.05) and TNF-α (P<0.01) in model group I increased significantly. Compared with model group I, the serum levels of ALT and ALP in PGZ prevention group decreased significantly (P<0.05), and the serum level of AST and TNF-α in PGZ prevention group also had decreasing tendency, but there was no significant difference. Compared with control group II, the serum level of ALT, AST, ALP in model group II increased significantly (P<0.01), the level of TNF-α also increased, but had no significant difference. Compared with model group II, the serum level of ALT (P<0.05), ALP (P<0.01) and TNF-α (P<0.01) in PGZ treatment group decreased obviously, and the level of AST also had decreasing tendency, but there was no significant difference (Table 3).
Table 3.
Hepatic biochemical manifestation of rats in each group
| Groups | ALT (U/L) | AST (U/L) | ALP (U/L) | TNF-α (ng/ml) |
| Control group I | 54.8±7.1 | 200.3±14.5 | 167.3±29.4 | 7.81±3.50 |
| Model group I | 134.1±80.6a | 286.8±79.0a | 205.1±38.1b | 11.59±1.19a |
| PGZ prevention group | 83.7±30.8c | 264.0±33.0a | 169.4±54.5c | 9.84±2.33 |
| Control group II | 51.8±7.9 | 195.9±19.5 | 112.1±33.8 | 8.42±4.22 |
| Model group II | 171.8±88.6d | 340.0±119.1d | 215.3±45.5d | 11.01±1.59 |
| PGZ treatment group | 110.2±27.5de | 326.2±58.3d | 157.4±36.2f | 7.07±2.69f |
P<0.01 vs control group I
P<0.05 vs control group I
P<0.05 vs model group I
P<0.01 vs control group II
P<0.05 vs model group II
P<0.01 vs model group II
Effects on insulin resistance
Compared with control group I, the serum levels of insulin and HOMA-IR in model group I showed increasing tendency, and compared with model group I, the serum levels of insulin and HOMA-IR in PGZ prevention group showed decreasing tendency, but both of the differences were not statistical significant. Compared with control group II, the serum levels of insulin and HOMA-IR in model group II increased significantly (P<0.01). Compared with model group II, HOMA-IR in PGZ treatment group decreased significantly (P<0.01), and the serum level of insulin also had decreasing tendency, but there was no significant difference (Table 4).
Table 4.
Blood glucose, insulin and insulin resistance of rats in each group
| Groups | HOMA-IR | FBG (mmol/L) | FINS (mU/L) |
| Control group I | 5.78±1.44 | 6.51±0.63 | 19.93±4.48 |
| Model group I | 6.65±1.53 | 6.36±0.47 | 23.50±5.12 |
| PGZ prevention group | 5.71±1.33 | 5.94±0.53a | 21.52±3.96 |
| Control group II | 5.81±1.42 | 6.44±0.96 | 20.33±4.22 |
| Model group II | 8.21±0.98b | 7.04±0.52 | 26.41±4.21b |
| PGZ treatment group | 5.93±1.06c | 5.89±0.35c | 22.61±3.62 |
P<0.05 vs control group I
P<0.01 vs control group II
P<0.01 vs model group II
Effects on hepatopathological manifestation
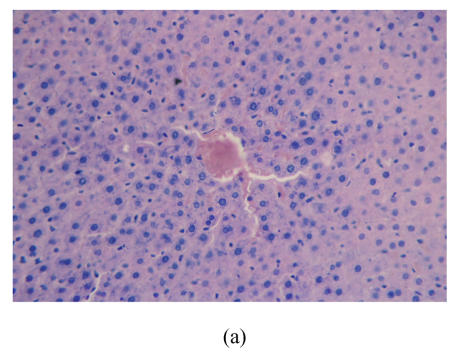
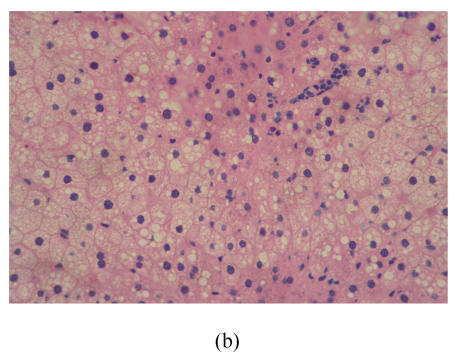
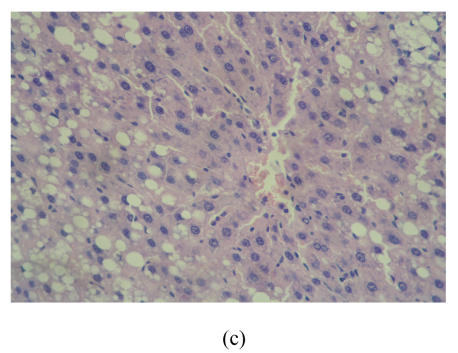
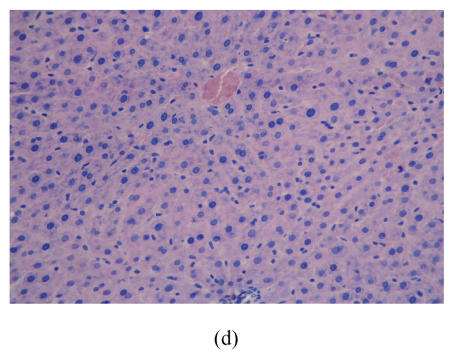
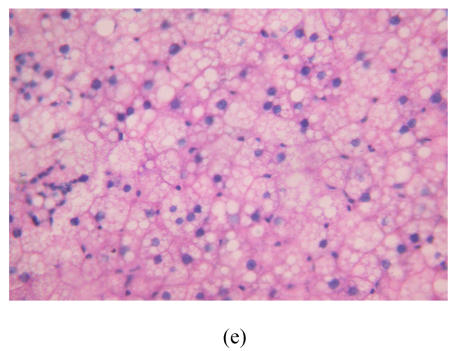
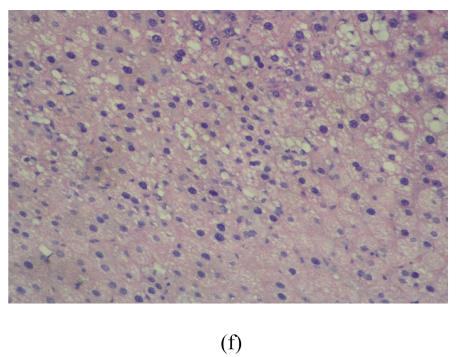
After 8 weeks, in control group I (Fig.1a), the liver lobules were distinct, the liver cell cords arranged regularly, whereas, the liver in model group I (Fig.1b) showed typical steatosis accompanied by mild to moderate lobular inflammatory cell infiltration. However, the degree of hepatic injury including steatosis and lobular inflammation were attenuated in PGZ prevention group (Fig.1c). After 16 weeks, compared with control group II (Fig.1d), notable steatosis, lobular infiltration by mononuclear cell and lymphocyte, spotty necrosis and focal necrosis were shown in rat liver in model group II (Fig.1e), while steatosis and extension of lobular inflammation in PGZ treatment group were relieved significantly (Fig.1f) (Table 5).
Fig. 1.
Pathology of rats liver in control group I (a), model group I (b), PGZ prevention group (c), control group II (d), model group II (e), and PGZ treatment group (f) (HE staining×200)
Table 5.
Hepatopathological manifestation of rats in each group
| Groups | Steatosis | Lobular inflammation | Portal inflammation intensity | Portal inflammation extent |
| Control group I | 0.56±1.33 | 0.22±0.67 | 0.89±0.60 | 1.00±0.71 |
| Model group I | 3.89±0.33a | 2.44±0.53a | 1.11±0.33 | 1.11±0.33 |
| PGZ prevention group | 2.50±1.41bc | 1.38±0.52ad | 1.00±0.00 | 1.13±0.35 |
| Control group II | 0.17±0.41 | 0.33±0.52 | 0.83±0.41 | 0.83±0.41 |
| Model group II | 4.00±0.00e | 3.11±0.60e | 1.11±0.33 | 1.11±0.33 |
| PGZ treatment group | 3.38±0.52ef | 1.50±0.54eg | 1.00±0.00 | 1.00±0.00 |
P<0.01 vs control group I
P<0.05 vs control group I
P<0.05 vs model group I
P<0.01 vs model group I
P<0.01 vs control group II
P<0.05 vs model group II
P<0.01 vs model group II
DISCUSSION
Non-alcoholic fatty liver disease (NAFLD) is a common chronic liver disease in clinic, and has a spectrum ranging from that of fatty liver alone, usually a benign and non-progressive condition, to nonalcoholic steatohepatitis (NASH), which may progress to liver cirrhosis (Poonawala et al., 2000; Mehta et al., 2002; Bugianesi et al., 2002). But the pathogenesis of NAFLD remains unknown. NAFLD is considered one of the clinical features of the metabolic syndrome in which insulin resistance plays a central role (Bugianesi et al., 2005; Machado and Cortez-Pinto, 2005). Marchesini et al.(2001) and Sanyal et al.(2001) using euglycemic-hyperinsulinemic clamping showed that insulin resistance is present in both fatty liver and NASH. Peripheral insulin resistance improves the mobilization of peripheral fat and the serum level of free fatty acids (FFA). However, the liver oxidation or utilization of FFA is inhibited. Triglyceride (TG) esterified from FFA shows increasing trend, whereas secreted by the liver shows decreasing trend, thus leading to fat deposits in hepatocyte. Lipid peroxidase of microsome was up-regulated and β-oxidation of mitochondrion was down-regulated by insulin resistance, which make the liver more sensitive to oxidative stress (Wang and Liu, 2003). By the second hit of oxidative stress, lipid peroxidation stimulate the formation of NASH and activation of hepatic stellate cell (HSC), ultimately leading to liver fibrosis and cirrhosis. Fatty liver also facilitates hyperinsulinemia and IR, and induces lipid peroxidation thus aggravating liver necroinflammatory change and fibrosis (Lu and Zeng, 2003).
In this study, rats model of NAFLD induced by high fat diet was established. After 8 weeks, typical steatosis accompanied by mild to moderate lobular inflammatory cell infiltration were demonstrated in the liver of rats in model group I, serum level of ALT, AST, ALP increased significantly, serum level of insulin and HOMA-IR also showed elevated tendency compared with control group I. After 16 weeks, notable steatosis and lobular inflammation were demonstrated in rat liver in model group II, serum level of ALT, AST, ALP, FINS and HOMA-IR were significantly increased in model group II compared with control group II. These results indicated that hyperinsulinemia and insulin resistance are present in rats of NAFLD, and that insulin resistance may play an important role in the development of fatty liver.
Weight loss achieved through lifestyle modifications (diet and exercise) has been promoted as the standard treatment for NAFLD as a result of lack of other effective treatments, but the compliance of patient is not satisfactory (Clark, 2006; Bugianesi et al., 2004). Thiazolidinediones (TZDs) or ‘glitazones’, with the primary structure of thiazolidine-2,4-diketone, are a new class of oral antidiabetic drugs that improve insulin sensitivity in patients through a mechanism involving activation of the gamma isoform of the peroxisome proliferator activated receptor (PPAR gamma) (Zhao and Jiang, 2003; Hauner, 2002). Among the total TZDs, rosiglitazone (RGZ) and pioglitazone (PGZ) which have the milder adverse effect such as liver damage, may be the desirable option for NAFLD therapy. A pilot study of vitamin E versus vitamin E and pioglitazone for the treatment of nonalcoholic steatohepatitis (Sanyal et al., 2004) showed that a combination of vitamin E and pioglitazone produces a greater improvement in NASH histology including fatty degeneration, vacuole degeneration and Mallory body. Research on pioglitazone for the treatment of liver fibrosis induced in rats by either carbon tetrachloride administration (Kon et al., 2002) or bile duct ligation (Galli et al., 2002) indicated that pioglitazone inhibits both hepatic inflammation, collagen synthesis and hepatic stellate cell activation, thereby ameliorating early-phase fibrogenesis in the liver. In this study, great improvement of pathological and biochemical changes was demonstrated in PGZ prevention group, indicating that pioglitazone may prevent or delay the development of NAFLD. Great improvement of pathological and biochemical changes was also demonstrated in PGZ treatment group. PGZ treatment also exerted beneficial effect on ameliorating insulin resistance. These results indicated that PGZ was effective in the treatment of NAFLD in rats through a mechanism of regulating insulin resistance. Some studies showed that serum level of TNF-α, the proinflammatory cytokine, is positively correlated with hyperinsulinemia and obesity (Diehl, 2004). TNF-α is an important mediator of insulin resistance in obesity and diabetes through its ability to decrease the tyrosine kinase activity of the insulin receptor (Hotamisligil et al., 1996). The study conducted by Solomon et al.(2001) proved that TZDs can reverse the insulin resistance induced by TNF-α. In this study, the level of TNF-α in model group I was significantly higher than that of control group I, the level of TNF-α in model group II also had increasing tendency, the level of TNF-α in PGZ treatment group was significantly lower than that of model group II. These results indicated that the therapeutical effect of pioglitazone on fatty liver may be associated with the regulation of the proinflammatory cytokine.
In conclusion, insulin resistance plays a role in the pathogenesis of NAFLD in rats. Pioglitazone prevention/treatment can attenuate insulin resistance, ameliorate biochemical and histological injury in high fat-induced fatty liver in rats. PGZ acting as insulin-sensitizing agent may be the promising drug in prevention/treatment for NAFLD. The safety and efficacy of pioglitazone for fatty liver in clinic and its underlying mechanism deserve study further.
References
- 1.Bonora E, Targher G, Alberiche M, Bonadonna RC, Saggiani F, Zenere MB, Monauni T, Muggeo M. Homeostasis model assessment closely mirrors the glucose clamp technique in the assessment of insulin sensitivity: studies in subjects with various degrees of glucose tolerance and insulin sensitivity. Diabetes Care. 2000;23(1):57–63. doi: 10.2337/diacare.23.1.57. [DOI] [PubMed] [Google Scholar]
- 2.Bugianesi E, Leone N, Vanni E, Marchesini G, Brunello F, Carucci P, Musso A, de Paolis P, Capussotti L, Salizzoni M, et al. Expanding the natural history of nonalcoholic steatohepatitis: from cryptogenic cirrhosis to hepatocellular carcinoma. Gastroenterology. 2002;123(1):134–140. doi: 10.1053/gast.2002.34168. [DOI] [PubMed] [Google Scholar]
- 3.Bugianesi E, Marzocchi R, Villanova N, Marchesini G. Non-alcoholic fatty liver disease/non-alcoholic steatohepatitis (NAFLD/NASH): treatment. Best Pract Res Clin Gastroenterol. 2004;18(6):1105–1116. doi: 10.1016/j.bpg.2004.06.025. [DOI] [PubMed] [Google Scholar]
- 4.Bugianesi E, McCullough AJ, Marchesini G. Insulin resistance: a metabolic pathway to chronic liver disease. Hepatology. 2005;42(5):987–1000. doi: 10.1002/hep.20920. [DOI] [PubMed] [Google Scholar]
- 5.Clark JM. Weight loss as a treatment for nonalcoholic fatty liver disease. J Clin Gastroenterol. 2006;40(Suppl. 1):S39–S43. doi: 10.1097/01.mcg.0000168641.31321.fa. [DOI] [PubMed] [Google Scholar]
- 6.Diehl AM. Tumor necrosis factor and its potential role in insulin resistance and nonalcoholic fatty liver disease. Clin Liver Dis. 2004;8(3):619–638. doi: 10.1016/j.cld.2004.04.012. [DOI] [PubMed] [Google Scholar]
- 7.Dixon JB, Bhathal PS, Hughes NR, O′Brien PE. Nonalcoholic fatty liver disease: improvement in liver histological analysis with weight loss. Hepatology. 2004;39(6):1647–1654. doi: 10.1002/hep.20251. [DOI] [PubMed] [Google Scholar]
- 8.Galli A, Crabb DW, Ceni E, Salzano R, Mello T, Svegliati-Baroni G, Ridolfi F, Trozzi L, Surrenti C, Casini A. Antidiabetic thiazolidinediones inhibit collagen synthesis and hepatic stellate cell activation in vivo and in vitro. Gastroenterology. 2002;122(7):1924–1940. doi: 10.1053/gast.2002.33666. [DOI] [PubMed] [Google Scholar]
- 9.Hauner H. The mode of action of thiazolidinediones. Diabetes Metab Res Rev. 2002;18(Suppl. 2):S10–S15. doi: 10.1002/dmrr.249. [DOI] [PubMed] [Google Scholar]
- 10.Hotamisligil GS, Peraldi P, Budavari A, Ellis R, White MF, Spiegelman BM. IRS-1-mediated inhibition of insulin receptor tyrosine kinase activity in TNF-alpha- and obesity-induced insulin resistance. Science. 1996;271(5249):665–668. doi: 10.1126/science.271.5249.665. [DOI] [PubMed] [Google Scholar]
- 11.Kon K, Ikejima K, Hirose M, Yoshikawa M, Enomoto N, Kitamura T, Takei Y, Sato N. Pioglitazone prevents early-phase hepatic fibrogenesis caused by carbon tetrachloride. Biochem Biophys Res Commun. 2002;291(1):55–61. doi: 10.1006/bbrc.2002.6385. [DOI] [PubMed] [Google Scholar]
- 12.Lu LG, Zeng MD. The role of improving insulin-resistant in the treatment and prevention of nonalcoholic fatty liver disease. Chin J Hepatol. 2003;11(2):113. (in Chinese) [PubMed] [Google Scholar]
- 13.Machado M, Cortez-Pinto H. Non-alcoholic fatty liver disease and insulin resistance. Eur J Gastroenterol Hepatol. 2005;17(8):823–826. doi: 10.1097/00042737-200508000-00008. [DOI] [PubMed] [Google Scholar]
- 14.Marchesini G, Brizi M, Bianchi G, Tomassetti S, Bugianesi E, Lenzi M, McCullough AJ, Natale S, Forlani G, Melchionda N. Nonalcoholic fatty liver disease: a feature of the metabolic syndrome. Diabetes. 2001;50(8):1844–1850. doi: 10.2337/diabetes.50.8.1844. [DOI] [PubMed] [Google Scholar]
- 15.Mehta K, van Thiel DH, Shah N, Mobarhan S. Nonalcoholic fatty liver disease: pathogenesis and the role of antioxidants. Nutr Rev. 2002;60(9):289–293. doi: 10.1301/002966402320387224. [DOI] [PubMed] [Google Scholar]
- 16.Poonawala A, Nair SP, Thuluvath PJ. Prevalence of obesity and diabetes in patients with cryptogenetic cirrhosis: a case control study. Hepatology. 2000;32(4 Pt 1):689–692. doi: 10.1053/jhep.2000.17894. [DOI] [PubMed] [Google Scholar]
- 17.Sanyal AJ, Campbell-Sargent C, Mirshahi F, Rizzo WB, Contos MJ, Sterling RK, Luketic VA, Shiffman ML, Clore JN. Nonalcoholic steatohepatitis: association of insulin resistance and mitochondrial abnormalities. Gastroenterology. 2001;120(5):1183–1192. doi: 10.1053/gast.2001.23256. [DOI] [PubMed] [Google Scholar]
- 18.Sanyal AJ, Mofrad PS, Contos MJ, Sargeant C, Luketic VA, Sterling RK, Stravitz RT, Shiffman ML, Clore J, Mills AS. A pilot study of vitamin E versus vitamin E and pioglitazone for the treatment of nonalcoholic steatohepatitis. Clin Gastroenterol Hepato. 2004;2(12):1107–1115. doi: 10.1016/S1542-3565(04)00457-4. [DOI] [PubMed] [Google Scholar]
- 19.Solomon SS, Usdan LS, Palazzolo MR. Mechanisms involved in TNF-α induction of insulin resistance and its reversal by TZD. Am J Med Sci. 2001;322(2):75–78. doi: 10.1097/00000441-200108000-00005. [DOI] [PubMed] [Google Scholar]
- 20.Wang JT, Liu YL. Non-alcoholic fatty liver disease: the problems we are facing. Hepatobiliary Pancreat Dis Int. 2003;2(3):334–337. [PubMed] [Google Scholar]
- 21.Zhao CY, Jiang LL. Peroxisome proliferators-activated receptor in liver disease. Chin J Hepatol. 2003;11(6):382–384. (in Chinese) [PubMed] [Google Scholar]


