

Abstract
Emission and absorption properties of indocyanine green (ICG) in Intralipid solution have been investigated. The study is focused on relatively low ICG concentration at a range of 0 to 20 μM. A diffusion model was used to analyze the emission properties of ICG solution at different concentrations. In the low-concentration region, the emission strength increases with the concentration of ICG, while in the high-concentration region, the emission decreases with the concentration. In general, a maximum of emission strength exists and its position (concentration) depends on the wavelength of the excitation light, the distance between the source and the detector, and the sample geometry and size. A so-called “inner-cell-effect” and re-absorption of emission photons are found to contribute to the decay of emission strength. Also, in the concentration range of 0 to 2 μM, ICG solution always has a higher absorption coefficient at wavelength 830 nm than that at 660 nm, which is quite different from the ICG in water case.
Keywords: indocyanine green, Intralipid solution, absorption, emission properties
1 Introduction
Indocyanine green (ICG) as a fluorescent agent has been widely used in biomedical fields since its introduction.1–5 ICG has attractive features of very low toxicity and high absorptance in a wavelength range of 600 to 900 nm, which is a relatively transparent window for biological tissues. It is well known that the absorption and emission properties of ICG are affected by the concentration of ICG and the solvent in which ICG is dissolved.3–5 In a dilute aqueous solution, an absorption peak at the wavelength of 780 nm and an emission peak at the wavelength of 830 nm were observed. With the increasing ICG concentration, the absorption peak shifts to the wavelength of 695 nm.1, 3–7 This shift of absorption peak is attributed to aggregation of ICG molecules from monomer to oligomer. Absorption and emission properties of ICG in other solvents, such as plasma and human serum albumin (HAS), are different from those in aqueous solution.3–7 These odd optical characteristics make ICG intriguing to investigators.3–5
Van Den Biesen6 and Mordon7 have reported a relationship between the emission strength and ICG concentration and observed a maximum value of emission strength in plasma or blood solvent. The ICG concentration at which the emission strength reaches a maximum is 0.1 mg/ml (~129 μM) in plasma and 0.05 mg/ml (~64.5 μM) in blood. Abugo et al.1 have demonstrated that when ICG concentration is ~60 μM in 0.5% Intralipid solution, the emission strength reaches a maximum in a thin sample. Such a thin sample greatly avoids the “inner-cell-effect”8 and re-absorption of emission light, which will be discussed in this paper. Self-quenching, resulting from ICG molecule aggregation, was thought to be responsible for the emission strength in the above-mentioned papers. In this paper, we focus on a relatively low ICG concentration of 0 to 20 μM. This concentration range is typical in fluorescence imaging using diffusive photon density wave (FDPDW).9–14 In this concentration range, the aggregation of ICG molecules is very weak, therefore it is reasonable to exclude the effect of molecule aggregation on absorption and emission properties.
Recently, FDPDW is under intensive investigations because it can provide more tissue functional information.9–14 The aforementioned advantages make ICG a good candidate for FDPDW. In FDPDW phantom experiments, Intralipid solution with dissolved ICG is commonly used. Therefore, an investigation of the absorption and emission of ICG in Intralipid solution is indispensable. Since Intralipid solution contains a high concentration of light scattering particles, its scattering coefficient is much larger than its absorption coefficient. Thus, diffusion model is appropriate for analyzing the experimental results. In addition, the finding of a higher absorption of ICG in Intralipid solution at 830 nm relative to 690 nm reported in Milstein’s9 recent paper further stimulates our interest of this study.
2 Materials and Methods
A portable frequency domain system is used in our experiments.15 This system features measurement with three wavelengths of 660, 780, and 830 nm. ICG is obtained from Aldrich Company (Product Number: 22,886-9) and the molecular weight is 775. A M-series analytical balance (M-220D, Denver Instrument Co.) is used for ICG weight measurement. Limited by the accuracy of the balance, 10% errors in concentration exist. However, all solutions of different concentrations are obtained from dilution of the same concentrated solution. Therefore the relative accuracy of concentration is maintained, which makes solutions of different ICG concentrations comparable to each other. Typical infinite and cylindrical geometries are used in our studies and the experimental configurations are illustrated in Figs. 1(a) and 1(b), respectively. In the infinite geometry experiments shown in Fig. 1(a), the source and detector fibers were placed deeply into the Intralipid solution. Channel D1 is used to collect emission photons and is connected to a collimating system shown in Fig. 2. The collected photons are collimated by two lenses before entering an avalanche photodiode (APD) detector. A narrow bandpass optical filter (CVI F-10-830.0-4, CVI Laser Corporation) is placed between two lenses to filter out the excitation light and pass the emission light. Channels D2–D10 are used for detecting the excitation light at multiple distances and the measurements are used to calculate absorption coefficients and reduced scattering coefficients of the solution with different ICG concentrations. In the cylindrical geometry experiments shown in Fig. 1(b) (top view), the source and the detector are located in the same plane with a 90-deg angle. ICG solution is injected into a cuvette with about 1-cm inner and 1.2-cm outer diameter. The two dotted lines in Fig. 1(b) represent the horizontal and vertical axes of the cuvette and their intersection is the origin. Figure 1(b) is a typical configuration in fluorescent measurements and is called “front-face right angle observation.”16
Fig. 1.
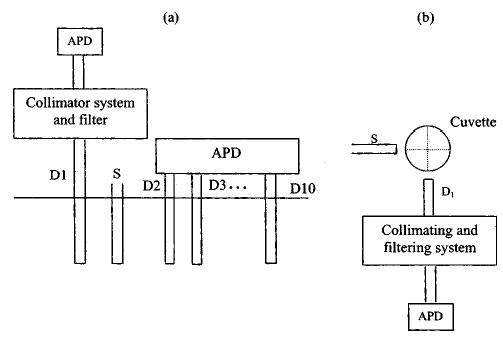
Distribution of source and detector fibers. (a) An infinite geometry. D1 is connected to a collimating and filtering system. The emission signal is detected by an APD detector. Fibers D2 to D10 are directly connected to APD detectors to measure the excitation signals for calculating absorption and reduced scattering coefficients of the medium. (b) A cylindrical measurement geometry viewed from the top. The inner radius is 1 cm and outer radius 1.2 cm. Source and detector are located in the same plan with an approximately 90-deg angle.
Fig. 2.
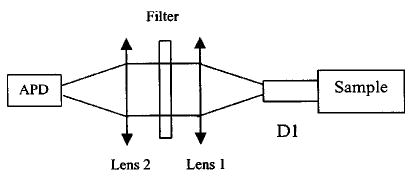
Configuration of the collimating system and the optical bandpass filter. The two lenses have a 25-mm focal distance. The collimator ensures that the incident light is normal to the interference filter and therefore does not cause any wavelength shift from 830 nm.
Since the fluorescence emission strength of ICG is much weaker than the excitation strength with a ratio of 10−2 to 10−3, it is reasonable to neglect the effect of emission photons on measurements collected from D2 to D10 for absorption and scattering calculations. The frequency domain method17 is used to measure the absorption coefficients μa and reduced scattering coefficients μs′ of different ICG concentrations. For the infinite geometry, the following linear equations can be used to determine the wave vector k of DPDW as:
| (1) |
| (2) |
where r is the source-detector distance, A(r) and θ(r) are the measured amplitude and phase of photon density wave at position r, and A0 and θ0 are constants. By curve fitting Eqs. (1) and (2), we can measure slopes ki and kr, which are imaginary and real parts of k. From ki and kr, μa and μs′ can be obtained as:
| (3) |
However, the phase measurements at distance source-detector separation are more sensitive to noise than the amplitude when the ICG concentration is high and the signal is weak, therefore, the fitting result of Eq. (2) is not as robust as that obtained from Eq. (1). By assuming that ICG molecules do not change the scattering coefficient of the solution, the μs′ can be approximated as a constant once it is measured. Then μa can be calculated as:
| (4) |
Thus, we can use the fitting results obtained from Eqs. (1) and (2) to obtain μs′ when there is no ICG added to the Intralipid solution and then compute μa from Eq. (4) for different ICG concentrations. Intralipid concentration is kept at ~0.6% for all absorption and emission measurements. The experimental validation that μs′ can be approximated as a constant at different ICG concentrations is given at the end of the next section.
3 Results
Figure 3 shows the amplitude of emission light as a function of ICG concentration. Figures 3(a) and 3(b) are obtained from infinite and cylindrical geometries, respectively. Each set of measurement data is normalized to its maximum, which makes the data of different wavelengths comparable. In all wavelengths and both configurations, the emission strength increases quickly, reaches a maximum, and then decreases gradually. The dashed and the dotted lines in Fig. 3(a) represent the fit to the corresponding data by using the diffusion model, which will be discussed in detail in Sec. 4.1. It can be seen that the emission properties are different for different source-detector separations (rsd) and different excitation wavelengths of 660 and 780 nm. At the excitation wavelength 780 nm, the positions of maxima are located at ~0.3 μM and ~0.4 μM for rsd=1.0 cm and rsd=1.6 cm, respectively. At 660 nm, a relative flat region of 1.7 to 2.7 μM appears in Fig. 3(a). For the cylindrical geometry, the concentration values of maximum emission are located between 4 to 6 μM for both wavelengths of 660 and 780 nm. These values are much higher than those of infinite geometry. The strength of excitation light collected by D2–D10 decreases with the increasing ICG concentration because the total absorption coefficient of the solution is increased. Figure 4 shows an example of the measured excitation strength at 4-cm source-detector separation as a function of the ICG concentration. Because the sources of different wavelength have different strengths, all data are normalized to their respective maxima. With the increasing ICG concentration, the normalized signals become weaker for all wavelengths. At the region of low concentration, 780 nm has the quickest decay rate, 830 nm is second, and 660 nm has the slowest decay rate. This result implies that the effect of ICG concentration on the absorption measurements of 780 and 830 nm in Intralipid solution is more dramatic than that of 660 nm. It is necessary to note that the emission photons excited by 660 and 780 nm in absorption measurement may increase the detected signal strength of excitation light at 660 and 780 nm. However, this increment is so weak that it can be neglected.
Fig. 3.
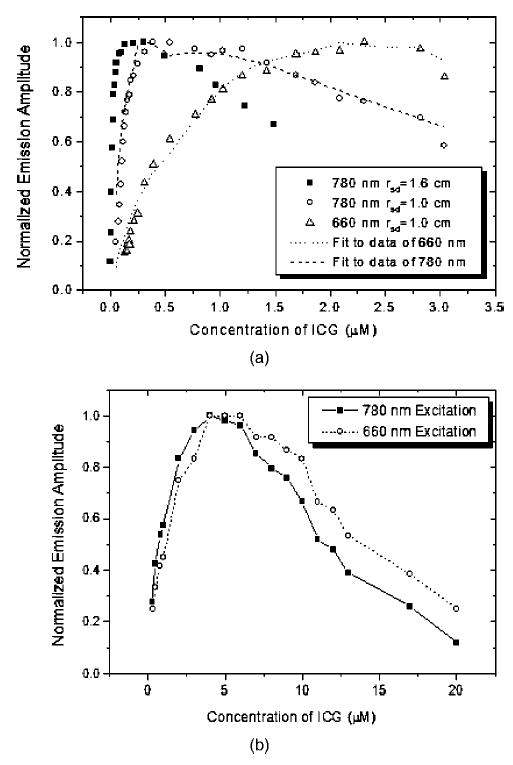
Normalized emission amplitude of ICG in Intralipid solution as a function of ICG concentration. (a) Infinite geometry. The excitation wavelengths are 660 and 780 nm. The dashed and dotted lines are curves obtained from the diffusion model discussed in Sec. 4.1. (b) Cylindrical measurement geometry.
Fig. 4.
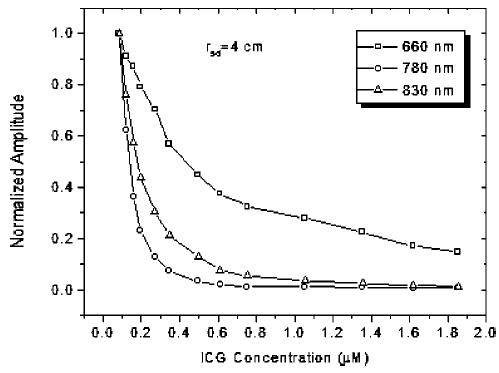
Normalized amplitude of excitation light as a function of ICG concentration measured at source-detector separation of rsc=4 cm.
The measurement results of absorption coefficient as a function of ICG concentration for three wavelengths are given in Fig. 5. Figures 5(a) to 5(c) correspond to measurements of 660, 780, and 830 nm, respectively. The dashed lines in Fig. 5 are linear fit to the experimental data. For the concentration range of approximately 0 to 2.0 μM, the experimental data in Fig. 5(a) can be fitted into a straight line, which has a slope of 0.041 and therefore the extinction coefficient ε=4.1 × 104 cm−1 M−1. Note that the absorption coefficient μa =ε[F], where ε is the molar extinction coefficient and [F] is the molarity of the solute. The last three points in Fig. 5(a) can also be fitted into a straight line, which has a slope of 0.01365 and therefore the extinction coefficient ε=1.365 ×104 cm−1 M−1. We believe that the difference between the two slopes may originate from two possible reasons. One possibility is that the extinction coefficient of ICG in Intralipid solution decreases with the increasing ICG concentration. Another possibility is attributed to error in high concentration measurement due to weaker signal strength and lower signal-to-noise ratio (SNR). Nevertheless, we can select the extinction coefficient between the two values as 1.36×10⁴<ε660 <4.1×104 cm−1 M−1. Similarly, results of 780 and 830 nm are shown in Figs. 5(b) and 5(c). The corresponding extinction coefficients are 3.43×10⁵<ε780<5.73×105 cm−1 M−1 and 0.75×10⁵<ε830<1.77×105 cm−1 M−1. It should be noted that in Fig. 5(b) the accuracy of data is low for 780-nm excitation due to weaker signal and low SNR when the concentration of ICG is higher than 0.6 μM. Therefore, only the results with concentration less than 0.6 μM are given in Fig. 5(b).
Fig. 5.
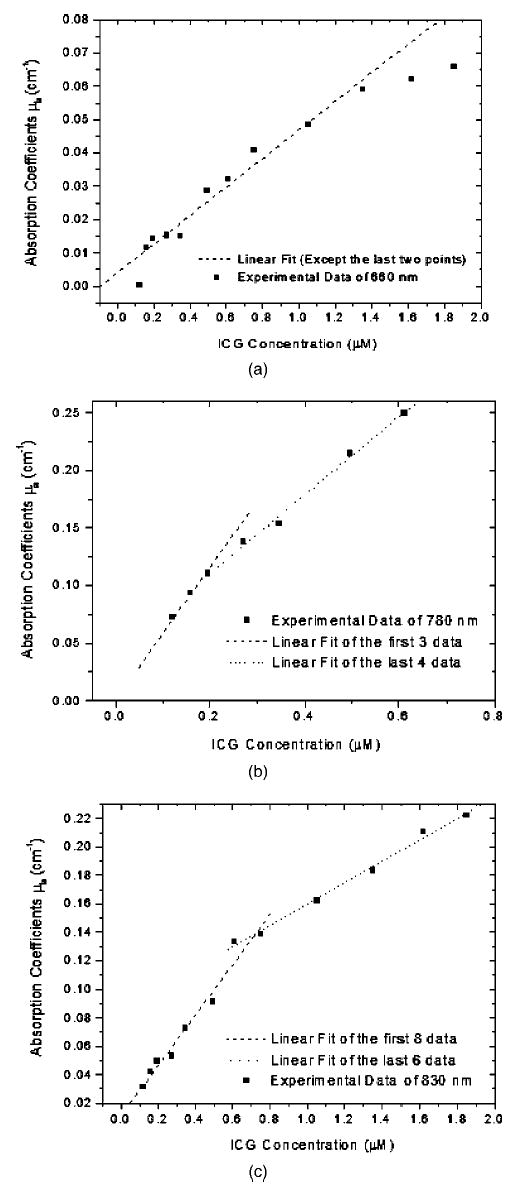
Absorption coefficients of ICG solution in 0.6% Intralipid as a function of ICG concentration measured at (a) 660 nm, (b) 780 nm, and (c) 830 nm using a frequency domain multidistance photon migration method.
To validate that μs′ can be approximated as a constant, we have used measured amplitude and phase and Eqs. (1) and (2) to extract the real and the imaginary part of wave vector k, and then compute μa and μs′ from Eq. (3). The results of μs′ obtained from 660 nm are shown in Fig. 6. It can be seen that μs′ is limited in a small range of 6.7 to 7.5 cm−1 with an average of 7.25 cm−1 when the ICG concentration is low. At higher concentration, μs′ varies in a larger range due to fitting errors when Eq. (2) is used to obtain the real part of the wave vector. However, the average value is about the same as the low concentration case. Thus, we have used an average μs′ of 7.25 cm−1 and Eq. (4) to extract absorption coefficient μa shown in Fig. 5. The measured absorption coefficient and reduced scattering coefficient of background medium without ICG (0.6% Intralipid solution) were μa660 = 0.009 cm−1, μa780 = 0.018 cm−1, μa830 = 0.035 cm−1, μ′s660 = 7.25 cm−1, μ′s780 = 6.44 cm−1, and μ′s830 = 6.04 cm−1.
Fig. 6.
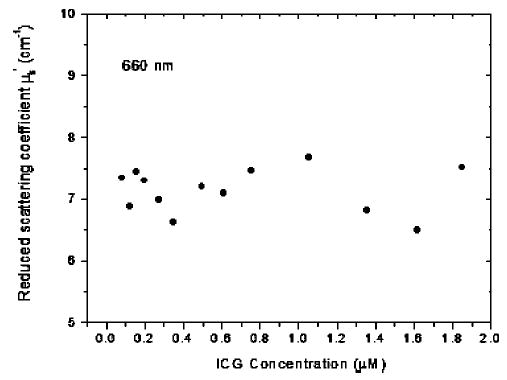
Measured reduced scattering coefficients at 660 nm vs. ICG concentration.
4 Analysis and Discussion
4.1 Fluorescence Diffusion Model
The emission characteristics of ICG in Intralipid solution can be explained by the diffusion model. Since infinite geometry has a simple analytical expression, we focus our analysis on this geometry. The analytical expression for the distribution function of emission photon density in infinite medium can be written as:
| (5) |
The amplitude of Φfl(rs ,r) is
| (6) |
where S0 is the source strength and
which is independent of concentration of ICG if the diffusion coefficients Dex and Dfl are approximated as constants. The term
| (7) |
where g is a function of total absorption coefficient, which is the sum of the absorption coefficient of chromophores in background medium μacex,fl and absorption of fluorophore of ICG μafex,fl. The superscripts “ex” and “fl” denote the excitation wavelength and fluorescent emission wavelength. The wave vector kex, fl is a complex number and can be written as kex, fl = krex,rfl+ikiex,ifl, where krex,rfl and kiex,ifl represent the real part and imaginary part of wave vector for excitation and emission wavelength, respectively, and can be written as
| (8) |
| (9) |
| (10) |
In our measurements, the diffusion coefficients Dex660 = 1/(3μ′s660) = 0.046 cm, Dex780 = 1/(3 μ′s780) = 0.0518 cm, and Dex830 = 1/(3 μ′s830) = 0.0552 cm. The modulation frequency is ω = 2 π × 140×106 and the refractive index of the solution is 1.33. Substituting all these parameters and background absorption coefficients into Eqs. (6) to (10) and fitting to the experimental data of 660 and 780 nm shown in Fig. 3(a), we obtain the following extinction coefficients of ε660 = 2.8×104 cm−1, ε780 = 3.5 × 105 cm−1 M−1, and ε830 = 1.61×105 cm−1 M−1. Compared with the extinction coefficients measured from Fig. 5, we find that these values are in the ranges established by Fig. 5. Since the normalized amplitude is used in Fig. 3, the factor A in Eq. (6) is eliminated in the calculation.
4.2 Discussion
From Eq. (6), one can see that the emission strength |Φfl| increases with the absorption coefficient μafex, which results from ICG molecule absorption and is proportional to concentration [F] of ICG. However, to account for the decay of emission curves at higher ICG concentrations shown in Fig. 3, g must decrease with the increasing ICG. There are two factors that contribute to the reduction of emission strength in Fig. 3. The first is the propagation depth of the excitation light in solution. It decreases with the increasing ICG concentration due to the increased total absorption of the excitation light. The reduction of the propagation depth or region results in the decrease of the ICG volume illuminated by the excitation light, and therefore the decay of the emission strength. A similar effect occurs in a clear medium, which is named “inner-cell-effect” (IC effect).8 For convenience, we also name the reduction of the propagation depth of the excitation light the “IC effect.” The second factor that contributes to emission strength reduction is the re-absorption of emission photons by ICG molecules. The re-absorption directly reduces the strength of emission photons.
4.2.1 “IC effect”
To quantitatively describe the “IC effect,” we chose an infinite medium, which is the simplest case. An isotropic point source modulated with a frequency ω generates a decay spherical photon density wave in the scattering medium. The amplitude of the alternating current (AC) component of the excitation photon density wave can be written as:
| (11) |
Let us consider a sphere with a radius of R = |rs − r|, and assume that most diffusive excitation photons are included inside this sphere. Thus, the emission strength is proportional to the volume of the sphere and the concentration of the ICG within this sphere. The increasing ICG concentration leads to the increasing emission strength and, on the other hand, results in the decrease of the volume. Therefore, these two factors combine together to determine the emission strength if re-absorption effect is not considered. If we include most of excitation photons into the sphere R by letting C = (Φex(rs,r)|/S0 = 1/1000, where S0 is the source strength, we can rewrite Eq. (11) as:
| (12) |
where kiex is the imaginary part of the wave vector of excitation light, which is a function of the ICG concentration [see Eq. (9)]. Other parameters, such as Dex660 = 0.046 cm, Dex780 = 0.0518 cm, and C are constants. This equation can be solved numerically by substituting the extinction coefficients ε660,780 from the fitting results of Fig. 3. The results are shown in Fig. 7. It can be seen that the radius R reduces very quickly at lower concentration, such as <1 μM, and saturates at higher concentration, such as >3 μM, for both wavelengths. This implies that the IC effect is obvious at low concentration and almost vanishes at higher concentration for an infinite medium. The inner figure in Fig. 7 is an enlarged picture at the low concentration region.
Fig. 7.
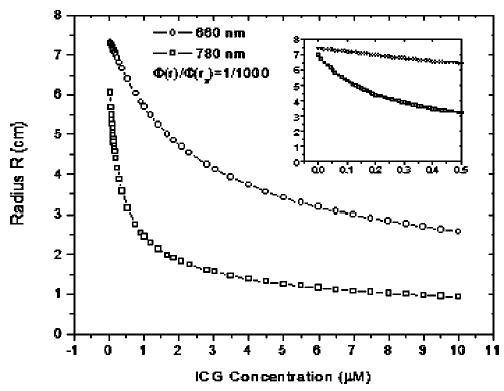
Radius R as a function of ICG concentration to demonstrate the “IC-effect.” The inner figure is an enlarged picture at low concentration region.
From Fig. 7, it is easy to understand the decay of emission strength shown in Fig. 3(a). At the beginning, no ICG exists, so the absorption coefficient of ICG at excitation wavelength μafex = 0. Therefore, no emission light signals can be detected. With the increasing ICG concentration, μafex increases, as shown in Figs. 5(a) and 5(b). When the absorption coefficients of ICG at excitation and emission wavelengths μafex and μaffl are much lower than the absorption coefficients of background solution μacex and μacfl, the g in Eq. (7) can be viewed as a constant. Thus, the emission strength is a linear function of ICG concentration as given in Eq. (6). With the increasing ICG concentration, the radius R reduces quickly, and consequently the excited ICG molecules are reduced dramatically. Therefore g decreases. The measured emission strength depends on which one is dominant. Since the volume of the sphere is proportional to R3, the decay of emission strength due to the IC effect becomes a dominant factor quickly. Therefore, for an infinite geometry and 780-nm excitation light, the IC effect is responsible for the decay of the emission strength shown in Fig. 3(a).
As shown in Fig. 7, the decay rate of R at 660 nm is much lower than that of 780 nm. Also shown in Fig. 5, the absorption coefficient of ICG at 660 nm is lower than that of 780 nm. As a result, the slope of emission strength is smaller and the emission attains to a maximum at a higher concentration than that of 780 nm. This result implies that the position of maximum emission strength increases if the IC effect can be reduced. This result can be further demonstrated with Fig. 3(a) for rsd =1 cm and 1.6 cm. The IC effect on the emission strength is weaker for a smaller source-detector separation, such as rsd=1 cm. Therefore, the position of maximum emission strength measured at rsd =1 cm is larger than that at rsd =1.6 cm.
The observed IC effect can be further explained from results obtained with the cylindrical geometry shown in Fig. 3(b). It is well known that reducing the optical path can avoid the IC effect in fluorescence measurements of nonscattering media.8 Hence, a smaller sample size has little IC effect until the concentration is high enough. This is because the volume excited by the excitation light is almost kept as a constant and approximately equals to the volume of the sample. In Fig. 1(b), the cylinder has a inner radius of 1.0 cm, which can be viewed as a smaller sample size with respect to the infinite medium shown in Fig. 1(a). Accordingly, the IC effect should be much smaller, which implies that the position of maximum emission strength should be larger than that of the infinite geometry. This is demonstrated in Fig. 3(b), where the ICG concentration of the maximum emission strength is about 4 to 6 μM, which is much larger than 0.3 to 0.4 μM obtained from the infinite geometry. It is necessary to note that although the concentration of 4 to 6 μM is much higher compared with 0.3 to 0.4 μM, it is still not high enough that the aggregation of ICG molecules can occur.
Abugo et al.1 reported maximum emission strength at a concentration of ~ 60 μM in 0.5% Intralipid solution. The authors attributed the reduction of emission strength to the aggregation of ICG molecules when ICG concentration is higher than 60 μM. This suggests that their measurements completely avoid the IC effect and the re-absorption of emission photons. Therefore, their sample must have a very small characteristic cell size, although they did not give a specific value about the thickness of their optical cell. According to Abugo’s results, we can exclude the effect of aggregation of ICG molecules in our ICG concentration range of < 20 μM.
4.2.2 Re-absorption of emission photons
The decay of the emission strength shown in Fig. 3(b) should be mainly attributed to re-absorption of emission photons. As shown in Fig. 3(b), the position of maximum emission strength of 780 nm is almost the same as that of 660 nm. Also, the decay rates of the two excitation wavelengths in the range of 7 to 20 μM are very similar. They imply that the same factor should be responsible for the decay of emission strength for both excitation wavelengths. If the IC effect induced by the excitation light at 660 and 780 nm were the dominant factor, the positions of maximum emission strength would not coincide as discussed in Sec. 4.2.1. We believe that the main reason is the re-absorption of emission photons because the absorption coefficient of 830 nm increases with the ICG concentration.
4.2.3 A comparison of ICG in water
By comparing Figs. 5(a) and 5(c), we have found that the absorption coefficient of 830 nm is always larger than that of 660 nm in our measurement range of 0 to 2 μM. This is quite different from ICG absorption in water.18 The extinction coefficients of ICG in water at a concentration of 6.5 μM are given as: 5.14 × 10⁴, 2.621 × 10⁵, and 2.42 × 104 cm −1 M−1 at 660, 780, and 830 nm.18 A factor of 2.303 is multiplied to the original data given in Ref. 18. Milstein9 experimentally reconstructed an absorption coefficient of 0.1 cm−1 at 830 nm for a 1-μM ICG target in 0.4% Intralipid solution. This result is comparable with our results shown in Fig. 5(c), where absorption coefficient of 0.152 cm−1 is measured at 830 nm for a 1-μM ICG solution in 0.6% Intralipid solution.
5 Summary
The ICG emission properties as a function of its concentration in 0.6% Intralipid solution are reported. This study is focused on relatively low ICG concentration at a range of 0 to 20 μM. We have found that the emission strength reaches a maximum quickly, and then decreases gradually with increasing ICG concentration. The maximum emission strength depends on the excitation wavelength, the source-detector separation distance, and the geometry and size of the sample. A similar phenomenon was observed in small-size samples by other researchers in a relatively high ICG concentration range and was attributed to the aggregation of ICG monomers.
To provide an explanation of such emission properties in the low concentration range, we have measured the absorption properties of ICG in Intralipid solution using a multidistance photon migration technique in frequency domain. Based on the measured absorption properties, we conclude that the decay of emission strength results from two reasons: one is the so called “inner-cell-effect” and another is the re-absorption of emission light. Our results have shown that the inner-cell-effect mainly results in the reduction of emission strength for large-size samples, such as an infinite medium, while the re-absorption is the main reason for the small-size sample.
Acknowledgments
We thank the following funding agents for their support: DOD ARMY (DAMD17-00-1-0217, 17-01-1-0216), Donaghue Foundation, and NIH (1R01CA94044-01A1).
References
- 1.Abugo OO, Gryczynski Z, Lakowicz JR. “Modulation sensing of fluorophores in tissue: A new approach to drug compliance monitoring,”. J Biomed Opt. 1999;4(4):429–442. doi: 10.1117/1.429956. [DOI] [PubMed] [Google Scholar]
- 2.Kuwana E, Sevick-Muraca EM. “Fluorescence lifetime spectroscopy in multiply scattering media with dyes exhibiting multiexponential decay kinetics,”. Biophys J. 2002;83(2):1165–1176. doi: 10.1016/S0006-3495(02)75240-5. [DOI] [PMC free article] [PubMed] [Google Scholar]
- 3.Gathje J, Steuer RR, Nicholes KRK. “Stability studies on indocyanine green dye,”. J Appl Physiol. 1970;29(2):181–185. doi: 10.1152/jappl.1970.29.2.181. [DOI] [PubMed] [Google Scholar]
- 4.Landsman MLJ, Kwant G, Mook GA, Zijlstra WG. “Light-absorbing properties, stability, and spectral stabilization of in-docyanine green,”. J Appl Physiol. 1976;40(4):575–583. doi: 10.1152/jappl.1976.40.4.575. [DOI] [PubMed] [Google Scholar]
- 5.J. F. Zhou, M. P. Chin, and S. A. Schafer, “Aggregation and degradation of indocyanine green,” Laser Surgery: Advanced Characterization, Therapeutics, and Systems IV, R. R. Anderson and A. Katzir, Eds., Proc. SPIE 2128, 495–505 (1994).
- 6.Van Den Biesen PR, Jongsma FH, Tangelder GJ, Slaaf DW. “Yield of fluorescence from indocyanine green in plasma and flowing blood,”. Ann Biomed Eng. 1995;23:475–481. doi: 10.1007/BF02584447. [DOI] [PubMed] [Google Scholar]
- 7.Mordon S, Devoisselle JM, Soulie-Begu S, Desmettre T. “Indocyanine green: physicochemical factors affecting its fluorescence in vivo,”. Microvasc Res. 1998;55:146–152. doi: 10.1006/mvre.1998.2068. [DOI] [PubMed] [Google Scholar]
- 8.G. G. Guilbault, Practical Fluorescence, Chap. 1, Marcel Dekker, New York (1973).
- 9.Milstein AB, Oh Seungseok, Webb KJ, Bouman CA, Zhang Q, Boas DA, Millane RP. “Fluorescence optical diffusion tomography,”. Appl Opt. 2003;42(16):3081–3094. doi: 10.1364/ao.42.003081. [DOI] [PubMed] [Google Scholar]
- 10.Lee J, Sevick-Muraca EM. “Three-dimensional fluorescence enhanced optical tomography using referenced frequency domain photon migration measurements at emission and excitation wavelengths,”. J Opt Soc Am A. 2002;19(4):759–771. doi: 10.1364/josaa.19.000759. [DOI] [PubMed] [Google Scholar]
- 11.Thompson AB, Hawrysz DJ, Sevick-Muraca EM. “Near-infrared fluorescence contrast-enhanced imaging with area illumination and area detection: the forward imaging problem,”. Appl Opt. 2003;42(19):4125–4136. doi: 10.1364/ao.42.004125. [DOI] [PubMed] [Google Scholar]
- 12.Li XD, O’Leary MA, Boas DA, Chance B, Yodh AG. “Fluorescent diffuse photon density waves in homogeneous and heterogeneous turbid media: analytic solutions and applications,”. Appl Opt. 1996;35(19):3746–3758. doi: 10.1364/AO.35.003746. [DOI] [PubMed] [Google Scholar]
- 13.O’Leary MA, Boas DA, Li XD, Chance B, Yodh AG. “Fluorescence lifetime imaging in turbid media,”. Opt Lett. 1996;21(2):158–160. doi: 10.1364/ol.21.000158. [DOI] [PubMed] [Google Scholar]
- 14.Paithankar DY, Chen AU, Pogue BW, Patterson MS, Sevick-Muraca EM. “Imaging of fluorescent yield and lifetime from multiply scattered light reemitted from random media,”. Appl Opt. 1997;36(10):2260–2272. doi: 10.1364/ao.36.002260. [DOI] [PubMed] [Google Scholar]
- 15.Chen NG, Huang MM, Xia H, Piao D, Zhu Q. “Portable near-infrared diffusive light imager for breast cancer detection,”. J Biomed Opt. 2004;9(3):504 –510. doi: 10.1117/1.1695410. (this issue). [DOI] [PMC free article] [PubMed] [Google Scholar]
- 16.J. R. Lakowicz, Principles of Fluorescence Spectroscopy, pp. 43–45, Plenum Press, New York (1983).
- 17.Danen RM, Wang Y, Li XD, Thayer WS, Yodh AG. “Regional imager for low-resolution functional imaging of the brain with diffusing near-infrared light,”. Photochem Photobiol. 1998;67(1):33–40. [PubMed] [Google Scholar]
- 18.http://omlc.ogi.edu/spectra/icg/index.html